

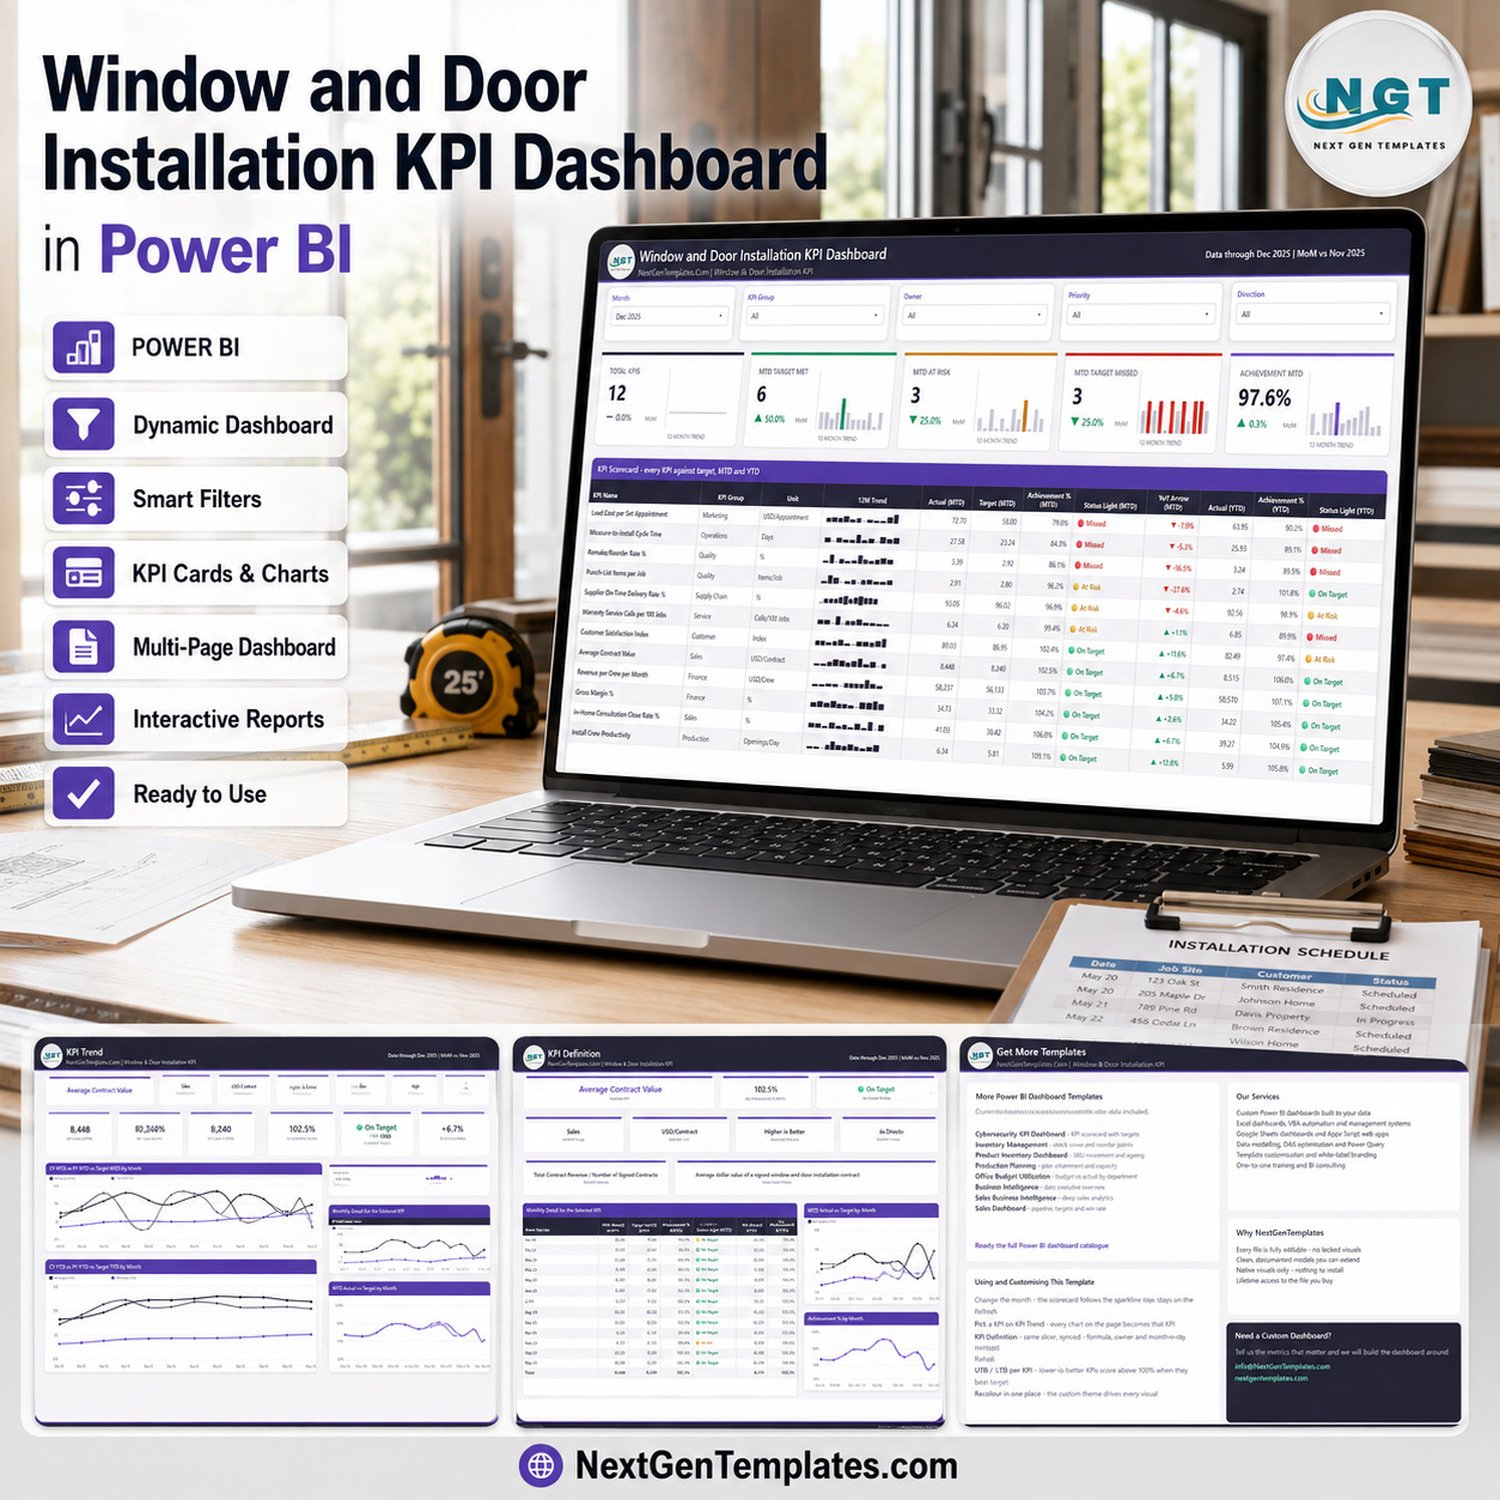

The Window and Door Installation KPI Dashboard in Power BI tracks 12 KPIs across 9 KPI groups on four report pages, with five slicers, five headline cards and a 12-column scorecard that scores every metric against target for both MTD and YTD. Twelve months of sample data plus a full prior year are already loaded, so the report opens populated. Setup takes under 10 minutes: point it at your own Data.xlsx and press Refresh.
🌍 Join 8,400+ teams in 40+ countries using NextGenTemplates to replace paid SaaS tools with one-time-purchase Excel, Google Sheets, Power BI and HTML templates.
✅ Instant download · One-time payment · No subscription · No per-user fees · Lifetime access
🔑 Key Features of the Window and Door Installation KPI Dashboard in Power BI
🎯 12 trade-specific KPIs, each with its own direction. This dashboard ships seven higher-is-better metrics (In-Home Consultation Close Rate %, Average Contract Value, Install Crew Productivity, Gross Margin %, Supplier On-Time Delivery Rate %, Revenue per Crew per Month, Customer Satisfaction Index) and five are lower-is-better (Measure-to-Install Cycle Time, Remake/Reorder Rate %, Punch-List Items per Job, Lead Cost per Set Appointment, Warranty Service Calls per 100 Jobs).
🚦 Direction-aware scoring, not a naive ratio. Higher-is-better KPIs score Actual divided by Target; lower-is-better KPIs score Target divided by Actual, so beating a cost or cycle-time target scores above 100%. Status bands are fixed and documented: On Target at 100% or more, At Risk from 95% to 100%, Missed below 95%.
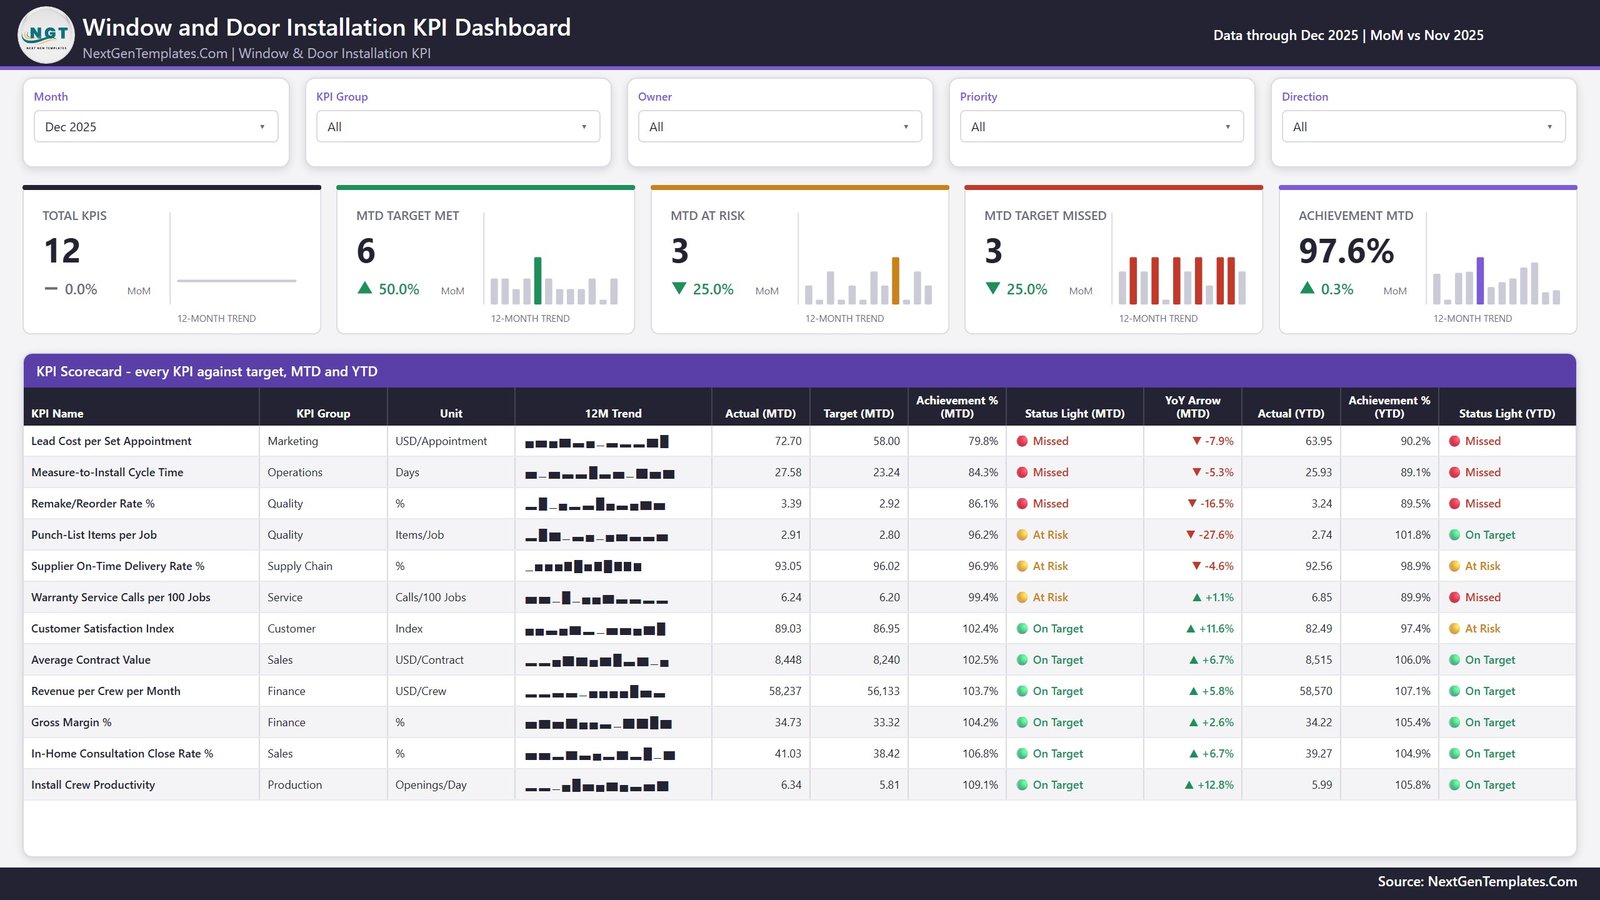
🎛️ Five slicers on the scorecard page — Month, KPI Group, Owner, Priority and Direction. The KPI Definition and KPI Trend pages carry their own synced KPI Name slicer, so choosing a KPI on one page keeps it selected on the other.
📈 A 12-month sparkline on every row and every card. The five header cards (Total KPIs, MTD Target Met, MTD At Risk, MTD Target Missed, Achievement MTD) each carry a 12-month trend bar, and the scorecard table repeats one per KPI row, so a month-level reading never loses the shape of the year.
🧾 Nothing is hard-coded. Every card, chart and table in the report is driven by the rows in the three input sheets. Rename a KPI, add one, or delete one, press Refresh, and the counts, the scorecard, the KPI picker and every chart follow.
📦 What is Inside This Power BI KPI Dashboard
The dashboard downloads as a ZIP holding three files: the .pbix report, Data.xlsx (the data pack) and a Power BI Dashboard user manual PDF. The report has four visible pages plus two hidden tooltip pages (KPI Detail and Trend Detail) that appear on hover.
Page 1: KPI Scorecard
The month view. Five slicers sit above five header cards, and below them a 12-row table gives each KPI its group, unit, 12-month sparkline, MTD actual, target, achievement %, status light, YoY arrow, then YTD actual, achievement % and status light. In the shipped December 2025 sample, 6 KPIs are On Target, 3 At Risk and 3 Missed, at 97.6% Achievement MTD.
Page 2: KPI Trend
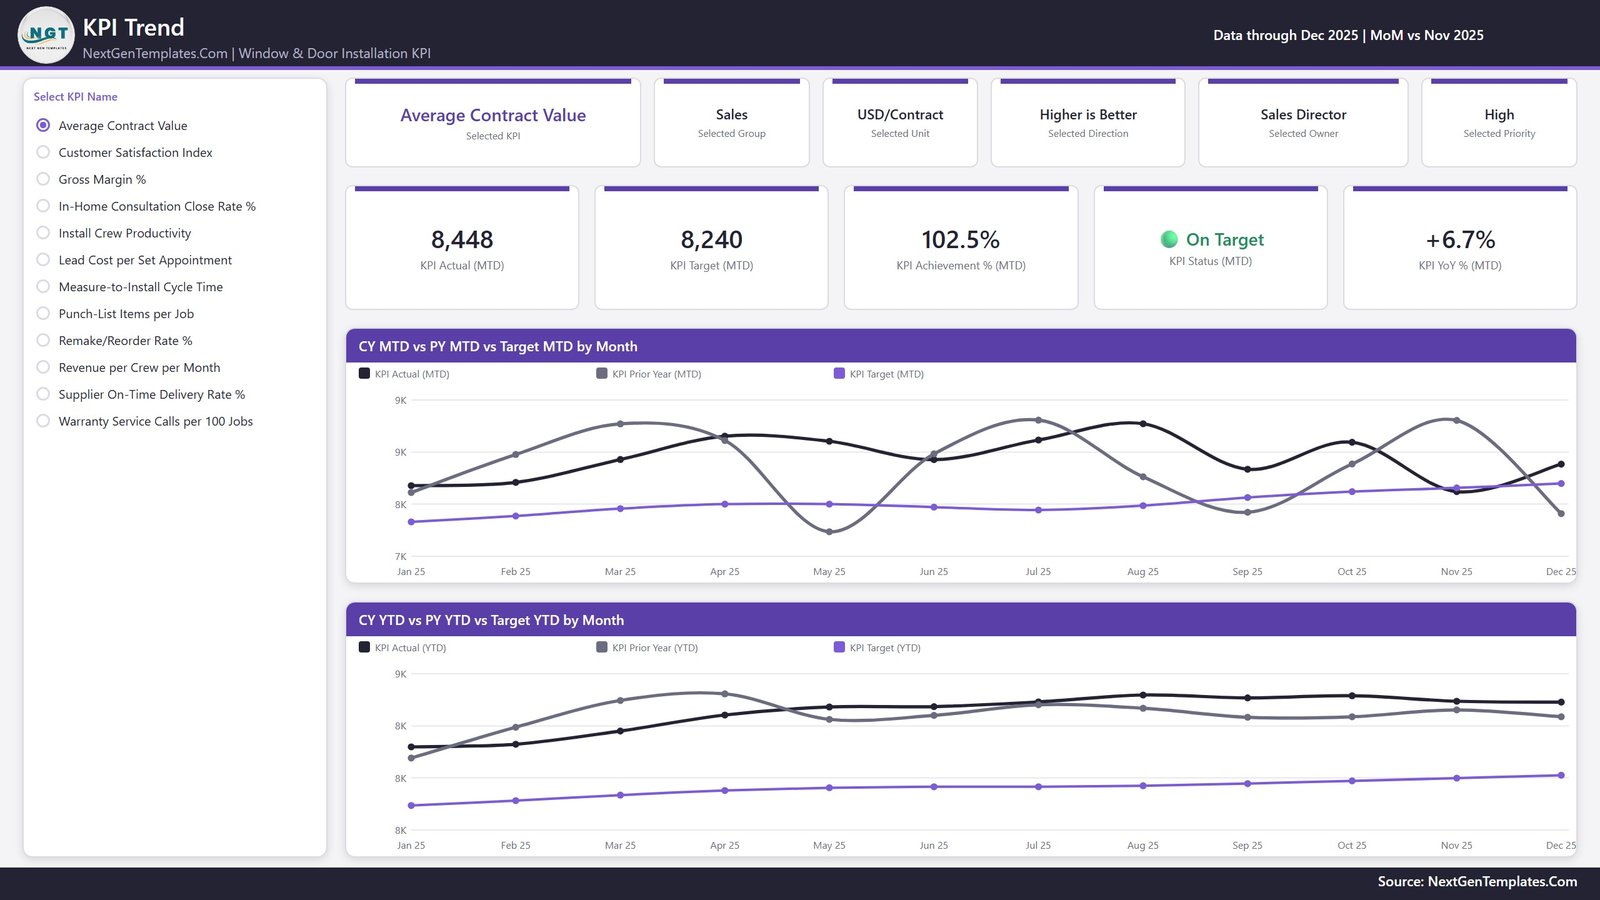
Pick one KPI from the left-hand list and the whole page becomes that KPI: six context cards (group, unit, direction, owner, priority), five value cards (MTD actual, target, achievement %, status, YoY %), then two line charts — CY MTD vs PY MTD vs Target MTD by Month, and CY YTD vs PY YTD vs Target YTD by Month.
Page 3: KPI Definition
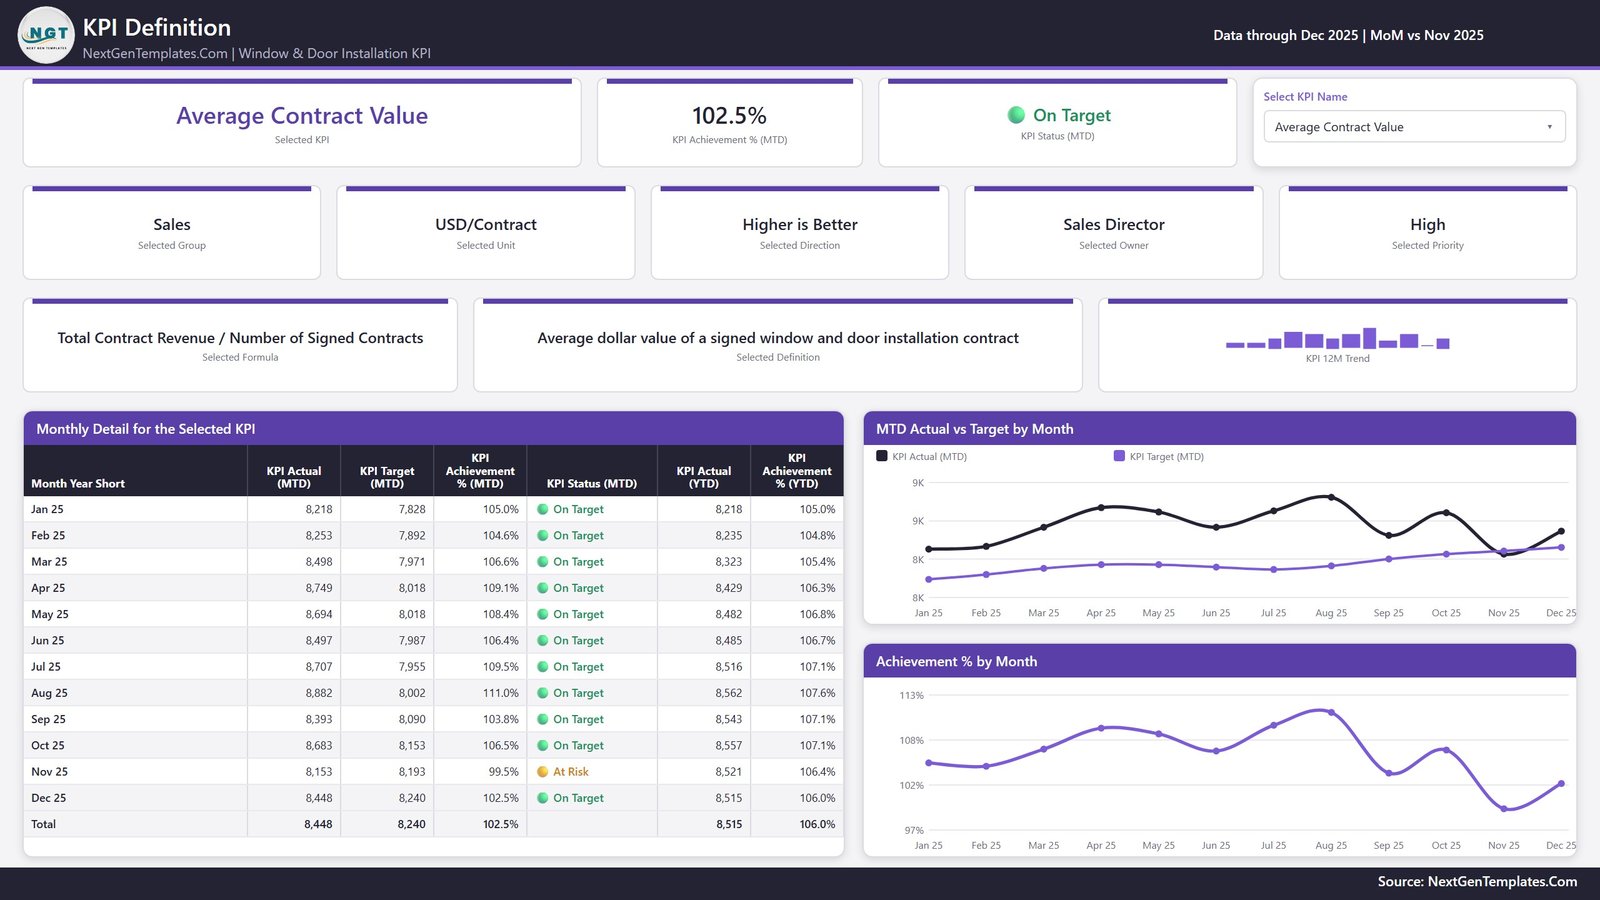
The same KPI selection, explained. This page shows the KPI formula and its plain-English definition alongside group, unit, direction, owner and priority, then a month-by-month table of actual, target, achievement % and status for all twelve months, plus MTD Actual vs Target by Month and Achievement % by Month charts.
Page 4: Get More Templates
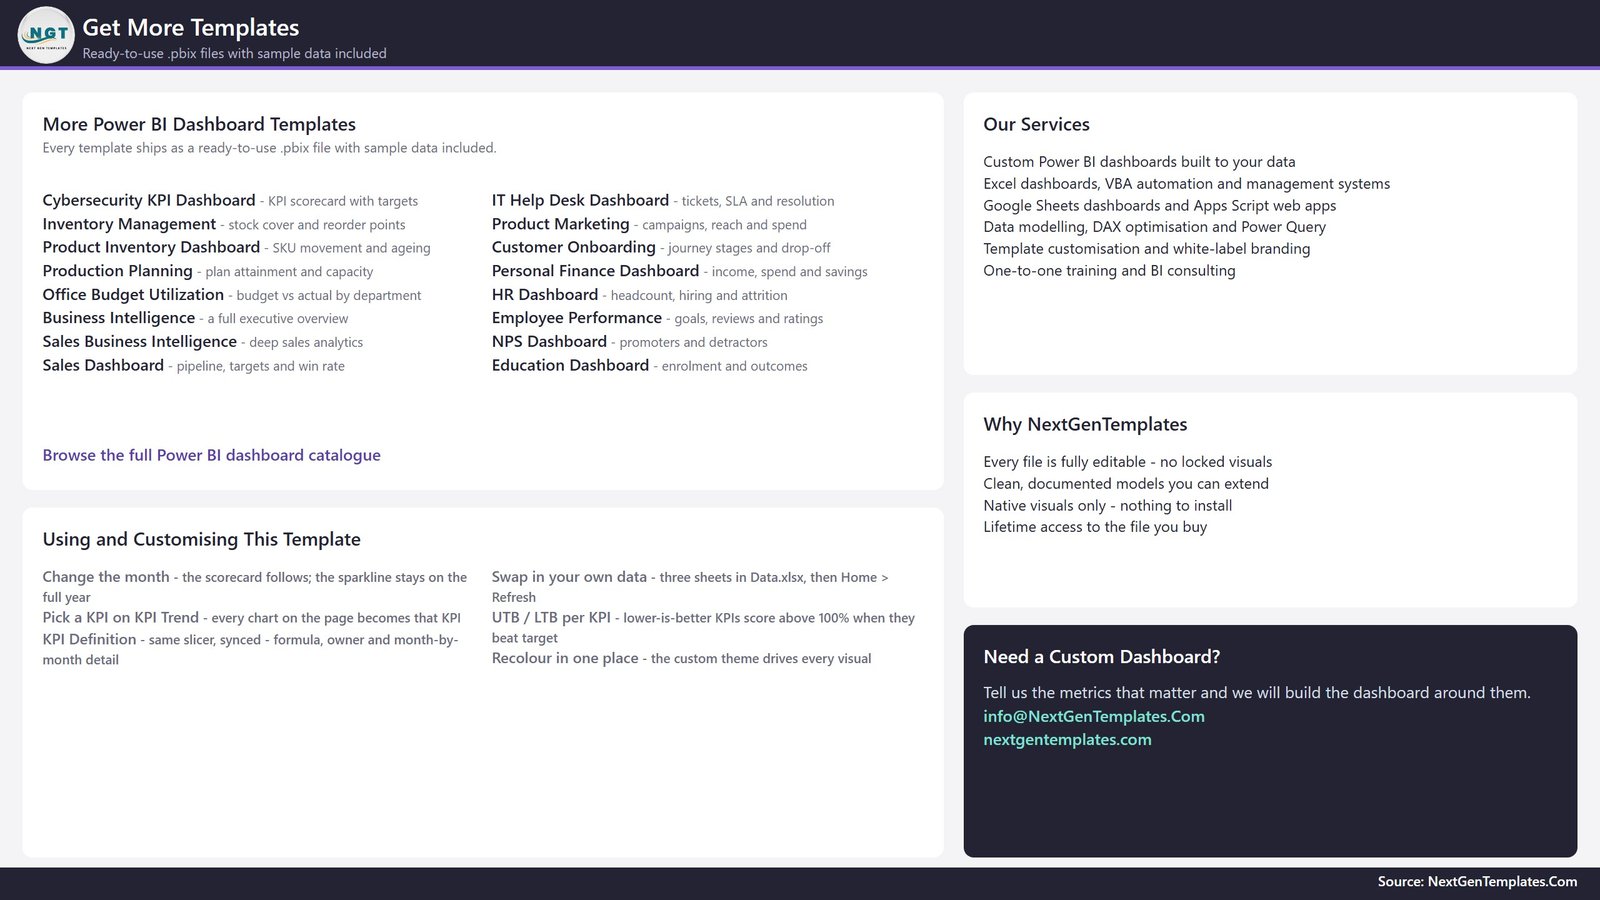
A catalogue and help page rather than a data page. It lists other Power BI dashboards, our services, and a short Using and Customising This Template panel covering the month picker, the KPI slicer, swapping in your own data and recolouring in one place.
The data pack
Data.xlsx carries four sheets: a Read Me, Input_ Target and Input_ Actual (one row per KPI per month, actuals covering the reporting year and the year before it), and KPI Definition, which holds each KPI group, unit, formula, definition, UTB or LTB type, owner and priority. The shipped KPIs are owned across 11 named roles at three priority levels.
📊 Power BI vs. Tableau or Qlik vs. Paid Field-Service SaaS — Where This Fits
| Feature | This Power BI Dashboard | Tableau / Qlik | ServiceTitan / JobNimbus |
|---|---|---|---|
| Cost | $12.99 one-time ✅ | $70-115 / user / month | $99-398 / user / month |
| Platform | Power BI Desktop (free) ✅ | Paid desktop plus server | Vendor cloud only |
| Setup time | Under 10 minutes ✅ | Days of modelling | Weeks of onboarding |
| KPI targets and RAG bands built in | Yes, 12 KPIs pre-scored ✅ | Build it yourself | Yes, but fixed to their schema |
| Lower-is-better metrics scored correctly | Yes, per-KPI UTB/LTB flag ✅ | Manual DAX or calc field | Partial |
| Add or rename a KPI | Edit a spreadsheet row ✅ | Edit the workbook | Vendor-controlled fields |
| Real-time team collaboration | Via Power BI Service (own licence) | Yes ✅ | Yes ✅ |
| Mobile access | Power BI mobile app | Yes ✅ | Yes ✅ |
| Year-1 cost at 5 users | $12.99 ✅ | $4,200-6,900 | $5,940-23,880 |
For an installation business that wants a scored, target-driven KPI pack without a per-seat BI bill or a field-service platform migration, this Power BI KPI dashboard sits in the sweet spot.
👥 Who This Template Is For — and Who It Is Not For
✅ This template is built for:
- Owners and general managers of window, door and glazing installation firms running 2-40 install crews
- Operations and production managers who already track measure-to-install time and remake rates in spreadsheets and want them scored monthly
- Sales managers reporting close rate, average contract value and lead cost to an owner or board
- Power BI users who want a finished, well-modelled KPI report to adapt rather than a blank canvas
❌ This template is NOT for:
- Anyone needing job scheduling, dispatch, quoting or invoicing — this is a reporting layer, not an operational system
- Teams wanting a live connection to ServiceTitan, JobNimbus, Procore, QuickBooks or a measure-and-quote tool; the source is an Excel workbook you maintain
- Firms looking for compliance tracking — it does not check building regulations, egress or thermal requirements, and it holds no FENSA, CE/UKCA, NFRC or installer-certification records
- Anyone who needs the numbers benchmarked against the industry; every target in the file is one you set yourself
⚙️ How to Use the Window and Door Installation KPI Dashboard in Power BI
- Unzip the download and keep the .pbix and Data.xlsx in the same folder.
- Open the .pbix in Power BI Desktop (free from Microsoft). The sample year loads immediately.
- If you moved the files, re-point the source once: Home > Transform data > Data source settings > Change Source. The Read Me sheet spells this out.
- Open Data.xlsx and edit the KPI Definition sheet — names, groups, units, formulas, owners, priorities, and the UTB or LTB flag that decides how each KPI is scored.
- Fill Input_ Target and Input_ Actual, one row per KPI per month. Load the prior year into Input_ Actual too; that is what every PY and YoY figure reads from.
- Back in Power BI, press Home > Refresh. Counts, cards, the scorecard, the KPI picker and every chart follow automatically.
- Use the Month slicer to move between months, and the KPI Name slicer on the Trend page to inspect one metric in depth.
💼 Real-World Use Cases
Dave owns a 6-crew replacement-window company. He opens the scorecard on the first Monday of each month, filters Priority to Critical, and sees at a glance that Remake/Reorder Rate % and Measure-to-Install Cycle Time are both Missed — which tells him the survey stage, not the fitters, is where the month went wrong.
Priya runs operations for a commercial glazing contractor. She uses the Owner slicer to produce one filtered view per manager before her monthly review, so the Procurement Manager sees Supplier On-Time Delivery Rate % and the Quality Control Lead sees Punch-List Items per Job and Remake/Reorder Rate % — the same file, five different conversations.
Marcus is a sales director at a 40-installer door specialist. He lives on the KPI Trend page, flipping between In-Home Consultation Close Rate %, Average Contract Value and Lead Cost per Set Appointment to show the board that a rising lead cost is being offset by a bigger average ticket.
❓ Frequently Asked Questions
What KPIs does the Window and Door Installation KPI Dashboard in Power BI track?
It tracks 12 KPIs across 9 groups: In-Home Consultation Close Rate %, Average Contract Value, Measure-to-Install Cycle Time, Remake/Reorder Rate %, Install Crew Productivity, Punch-List Items per Job, Gross Margin %, Lead Cost per Set Appointment, Warranty Service Calls per 100 Jobs, Supplier On-Time Delivery Rate %, Revenue per Crew per Month and Customer Satisfaction Index.
How long does setup take?
Under 10 minutes if you already have monthly actuals and targets. Unzip, open the .pbix in Power BI Desktop, replace the rows in Data.xlsx with your own, and press Refresh. The longest part is deciding your targets, not configuring the file.
Can I add or remove KPIs?
Yes. Nothing in the report hard-codes a KPI. Add a row to the KPI Definition sheet with its monthly target and actual rows, then Refresh — the counts, scorecard, slicers and charts all pick it up. Deleting works the same way in reverse.
Does it handle metrics where lower is better?
Yes, through a per-KPI UTB or LTB flag. Five of the twelve shipped KPIs are lower-is-better and score Target divided by Actual, so cutting cycle time or remake rate pushes achievement above 100%. Note that the YoY arrow column colours on the sign of the change alone, not on direction.
How does this compare to ServiceTitan or JobNimbus?
Those are field-service platforms that run the business at $99-398 per user per month. The Window and Door Installation KPI Dashboard in Power BI is a $12.99 one-time reporting layer that sits on top of whatever you already use. It reports; it does not schedule, quote or invoice.
Do I need a paid Power BI licence?
No. Power BI Desktop is free from Microsoft and opens the .pbix, refreshes it and prints it. A paid Power BI Pro licence is only needed if you want to publish the report to the Power BI Service and share it with colleagues online.
Is there a Google Sheets or Excel version?
Yes. A Google Sheets edition is live, and an Excel edition of the same dashboard is prepared. The KPI list comes from the same trade research, though each platform build is scoped to what that platform does well.
👤 About the Author
Built by PK — Microsoft Certified Professional with 15+ years of Excel, Google Sheets and Power BI experience. Founder of NextGenTemplates, reaching 300K+ subscribers across YouTube channels (@PK-AnExcelExpert, @NextGenTemplates, @NeoTechNavigators). Every template is hand-built and tested before release.
🔗 Explore Related Templates
Also available as: the Window and Door Installation KPI Dashboard in Google Sheets — the same trade, built as a browser-based scorecard, and the Window and Door Installation KPI Dashboard in Excel for teams that live in workbooks.
A different tool for the same trade: the Window and Door Installation KPI Scorecard in Google Sheets is our scorecard line, not this dashboard line — a 10-KPI monthly card rather than a multi-page report with trend and definition pages. Many buyers own both.
More KPI dashboards on this platform: Locksmith Business KPI Dashboard in Power BI, Pest Control Business KPI Dashboard in Power BI and Septic Tank Service KPI Dashboard in Power BI. Browse the full range of Power BI Dashboards.
📖 Click here to read the Detailed Blog Post
🎥 Visit our YouTube channel for step-by-step video tutorials
👉 YouTube.com/@NextGenTemplates
📅 Last updated: September 2026






























Reviews
There are no reviews yet.