

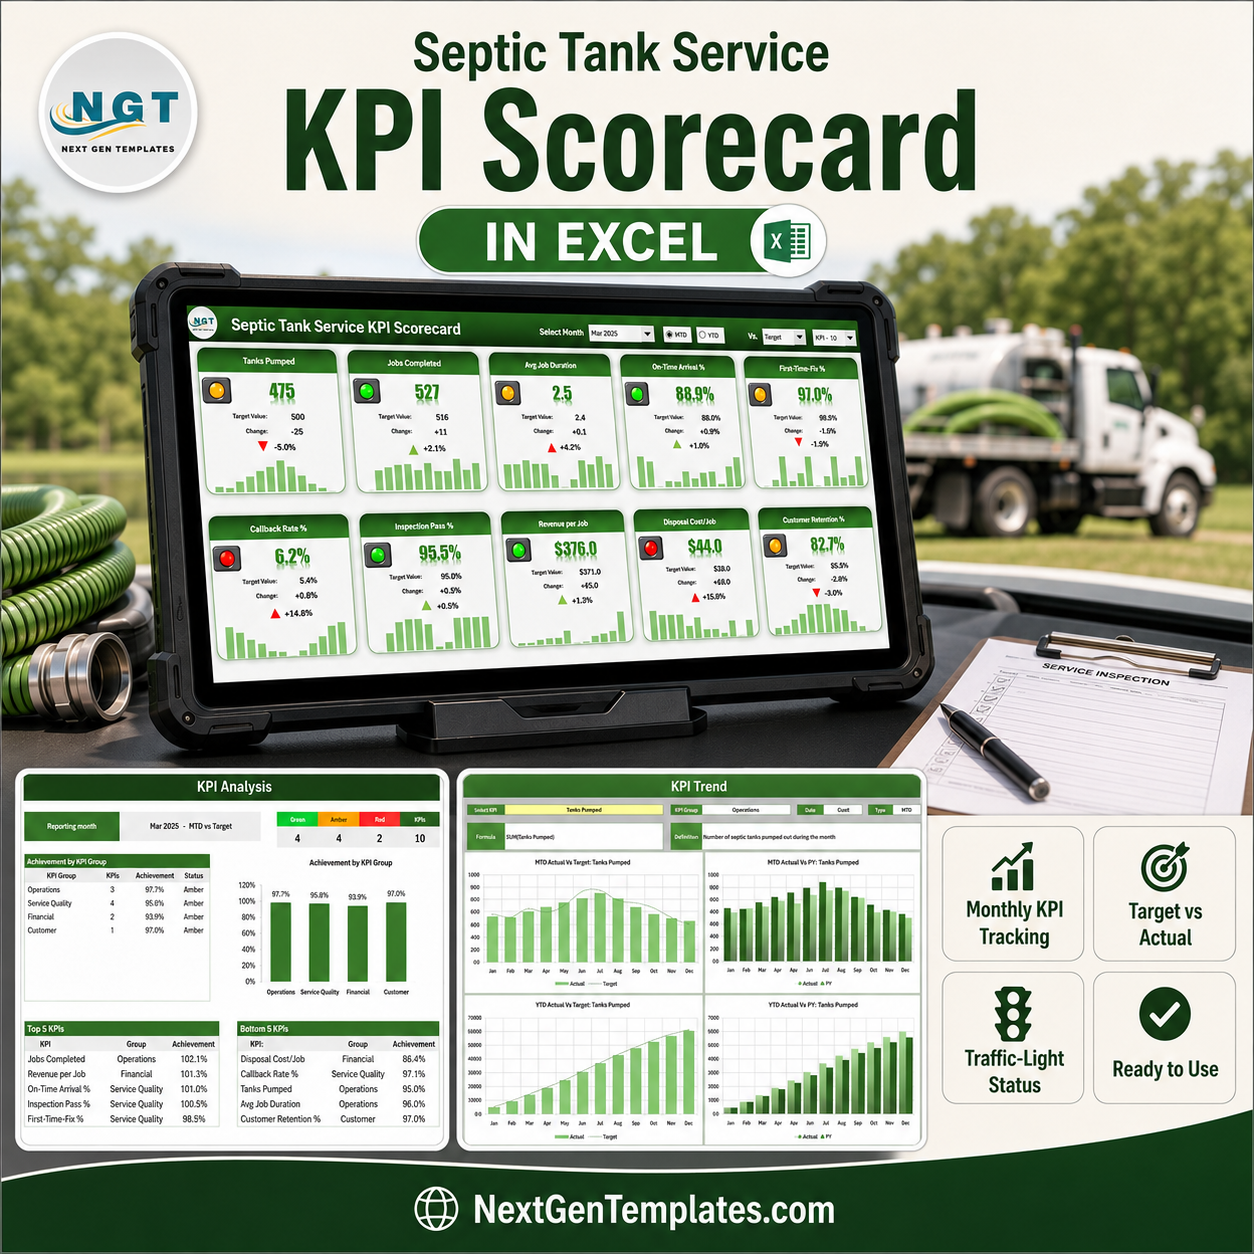


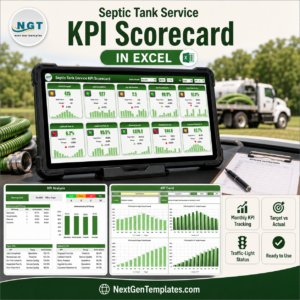
The Septic Tank Service KPI Scorecard in Excel puts 10 septic-service KPIs across 4 groups on one traffic-light page, for a single month you pick from a dropdown. It ships as a plain .xlsx with 9 working sheets, 100% formulas and zero macros – nothing to enable, nothing to trust. The sample file is filled with 12 months of 2025 figures (Actual, Target and prior year, for both MTD and YTD), and the Input Data sheet has 20 numbered KPI blocks running to row 319, so you can grow to twenty KPIs without touching a formula. Instant download, and if it is not what you expected, tell us and we will make it right.
Which product is this? This is the KPI Scorecard line: a fixed ten-tile monthly scorecard that reads figures you type. It is not the KPI Dashboard line, and it is not an analytical Excel dashboard built on a transaction table with slicers and pivots. Those are separate templates with similar names – see the comparison further down before you choose.
Key Features of the Septic Tank Service KPI Scorecard in Excel
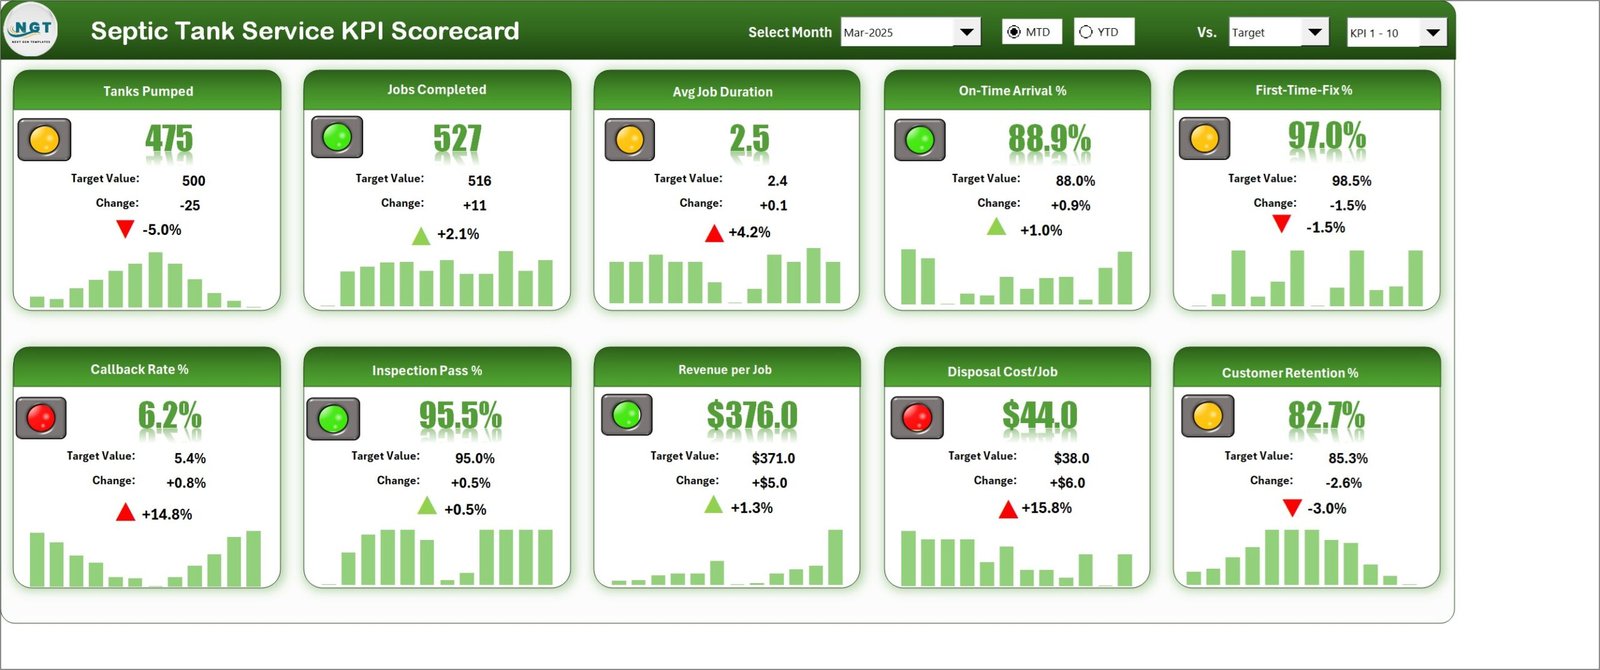
- Ten KPI tiles on one screen – Tanks Pumped, Jobs Completed, Avg Job Duration, On-Time Arrival %, First-Time-Fix %, Callback Rate %, Inspection Pass %, Revenue per Job, Disposal Cost/Job and Customer Retention %.
- A month picker that actually drives the page – the Select Month dropdown offers Jan-2025 through Dec-2025, and every tile, chart and table re-reads from Input Data when you change it.
- MTD / YTD toggle – two option buttons in the header switch the whole scorecard between the month and the year to date.
- Three comparison bases – the Vs. dropdown compares Actual against Target, against the same period last year (PY), or against the Prior Month.
- Direction-aware traffic lights – each KPI is tagged UTB (upper the better) or LTB (lower the better), and the light and the arrow both flip accordingly. Callback Rate % rising from a 5.4% target to a 6.2% actual shows a red up-arrow and a red light; Avg Job Duration is scored the same way.
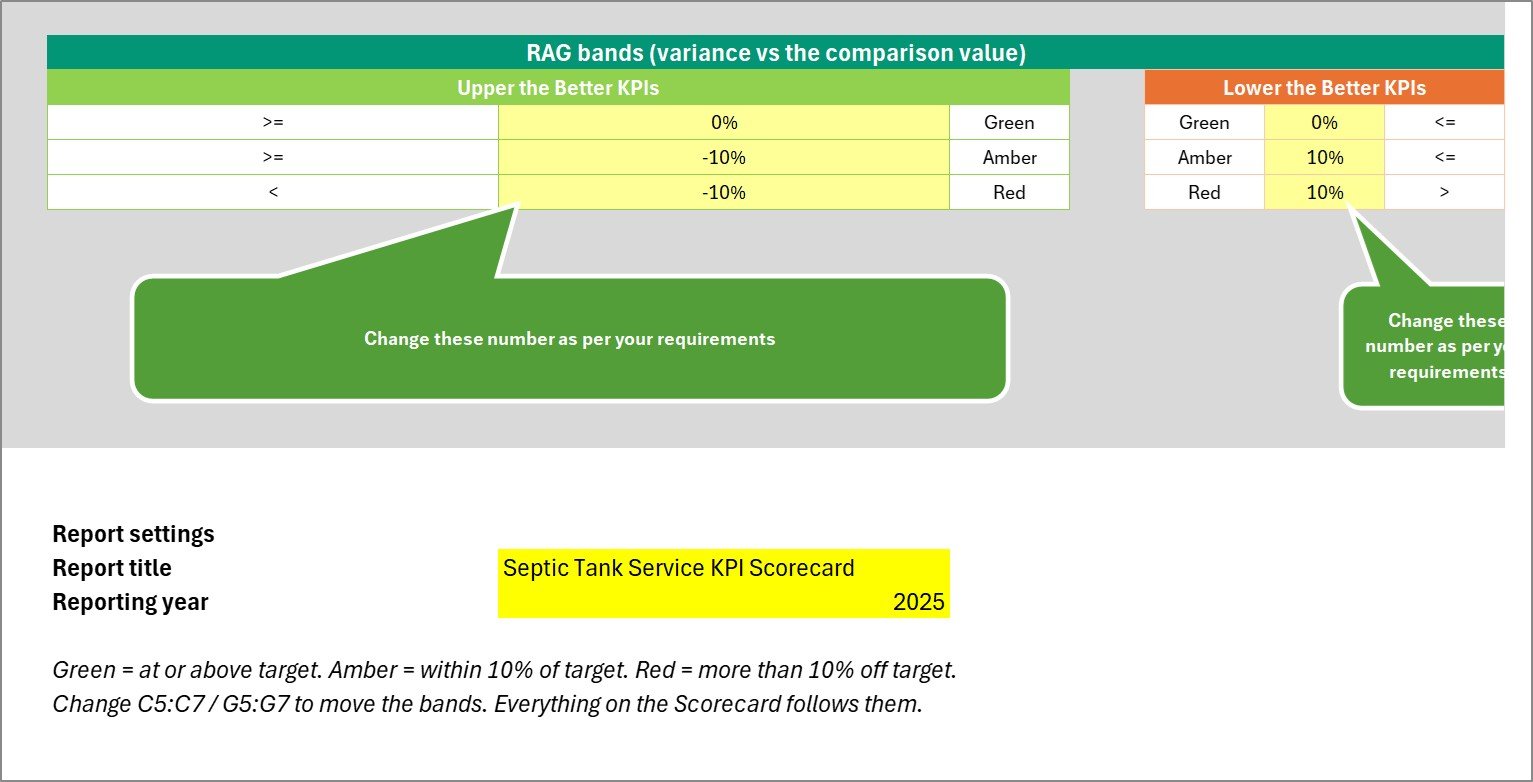
- Editable RAG bands – Green, Amber and Red thresholds live on the Color Settings sheet in cells C5:C7 and G5:G7, and the tile formulas and the KPI Analysis status column both read those cells live. Change the numbers and every page follows.
- A 12-month sparkline in every tile – a real Excel column sparkline over Jan to Dec, not a picture.
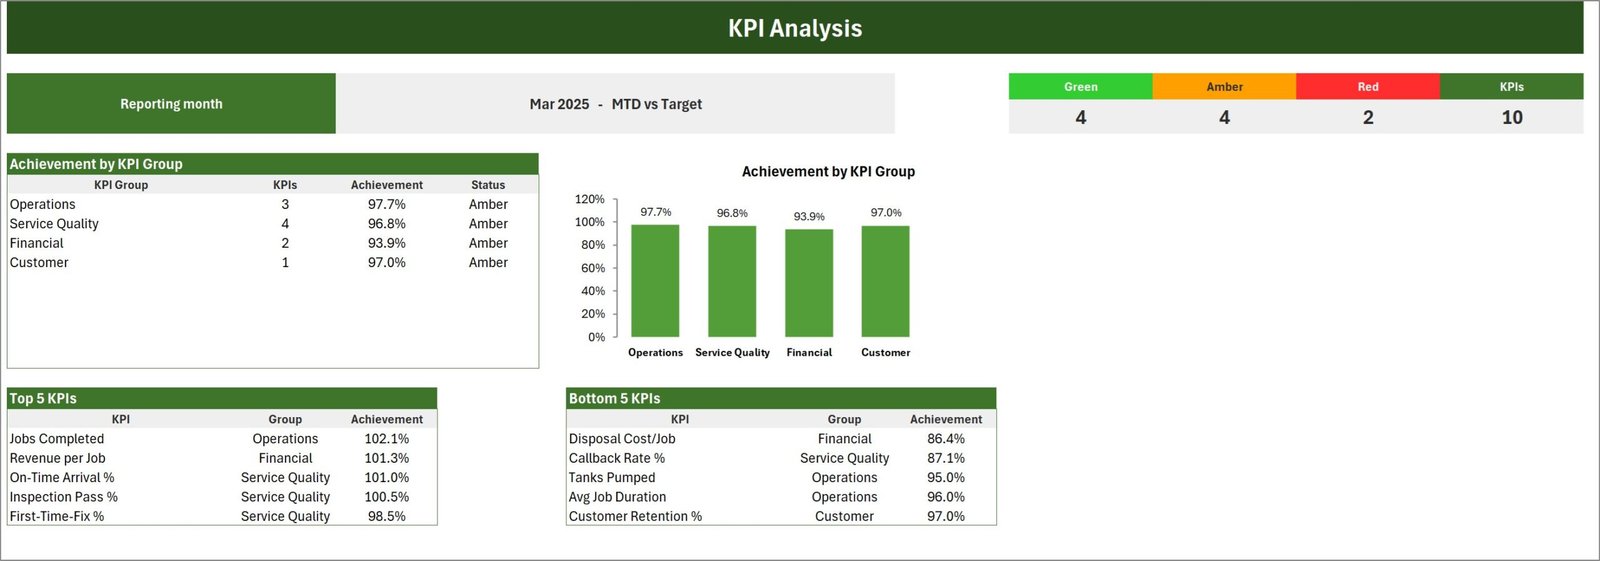
- KPI Analysis page – a Green / Amber / Red / total counter, achievement by KPI group as both a table and a column chart, plus Top 5 and Bottom 5 KPIs ranked by achievement.
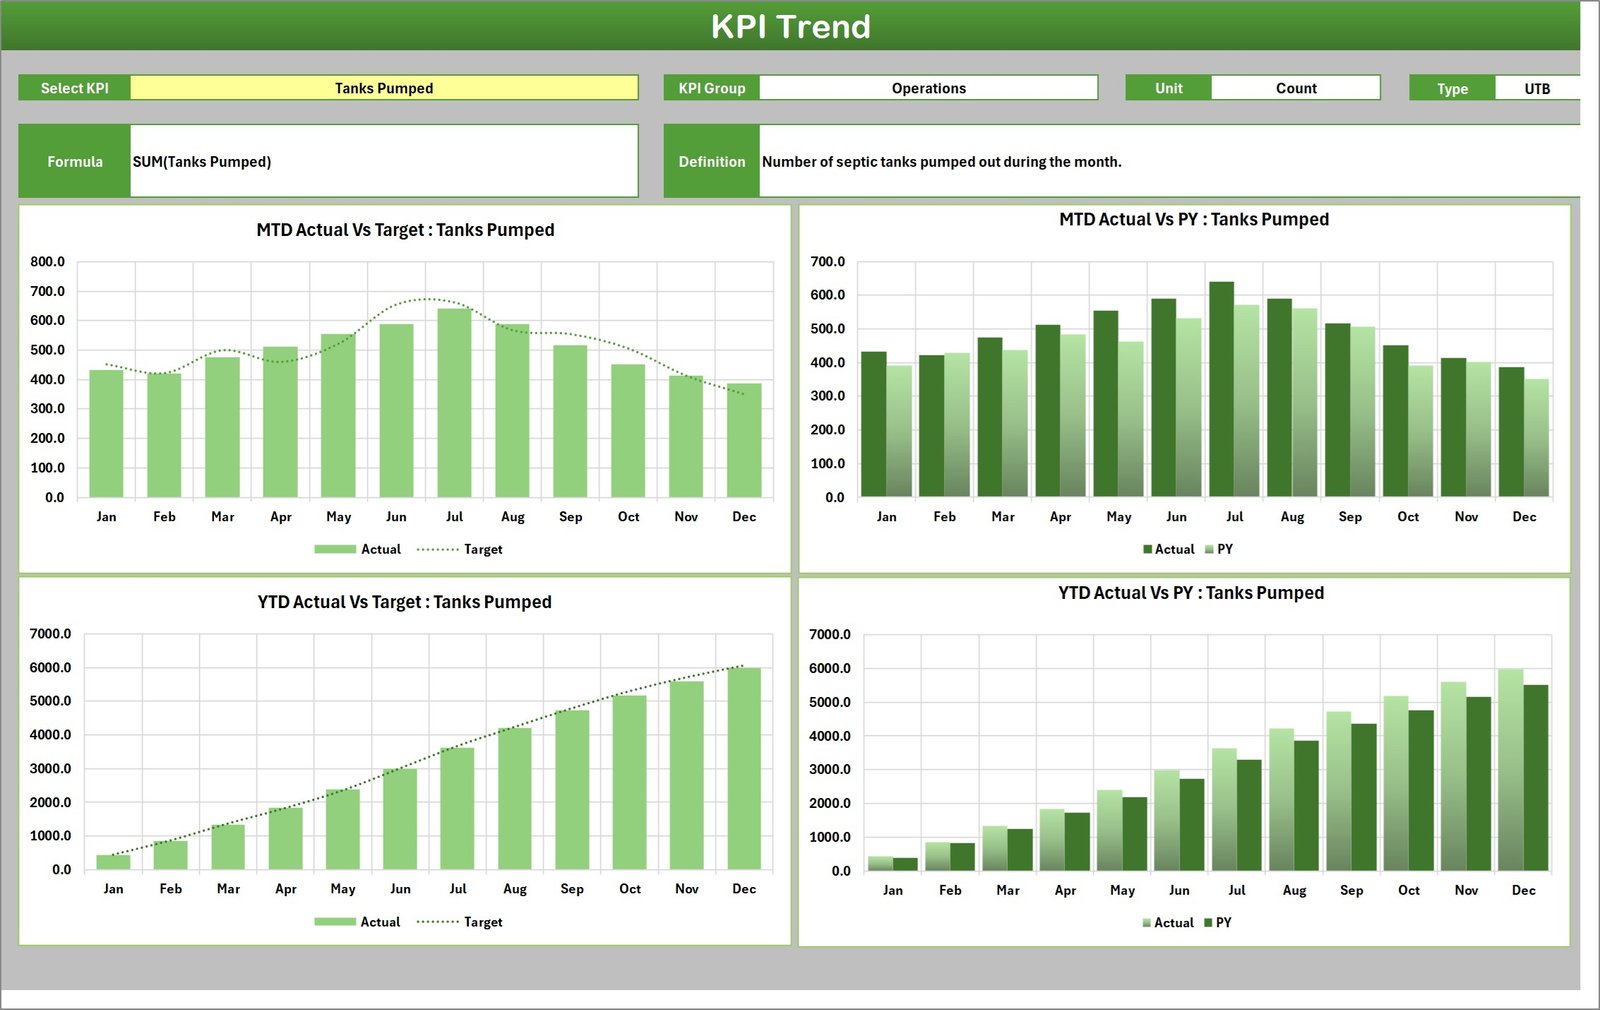
- KPI Trend page – pick any KPI from a dropdown and get four charts: MTD Actual vs Target, MTD Actual vs PY, YTD Actual vs Target and YTD Actual vs PY, with that KPI’s group, unit, direction, formula and definition shown above them.
- Room for twenty KPIs – a KPI set picker in the header switches the tile wall between KPI 1-10 and KPI 11-20.
- No macros, no Power Query, no add-ins – formulas, conditional formatting, camera pictures, sparklines and form controls only. Opens in Excel 2016 and later, including Microsoft 365.
What’s Inside the Septic Tank Service KPI Scorecard in Excel
Nine visible sheets, plus two hidden calculation sheets (Trend_Support and Support) that do the lookups. You never edit the hidden ones.
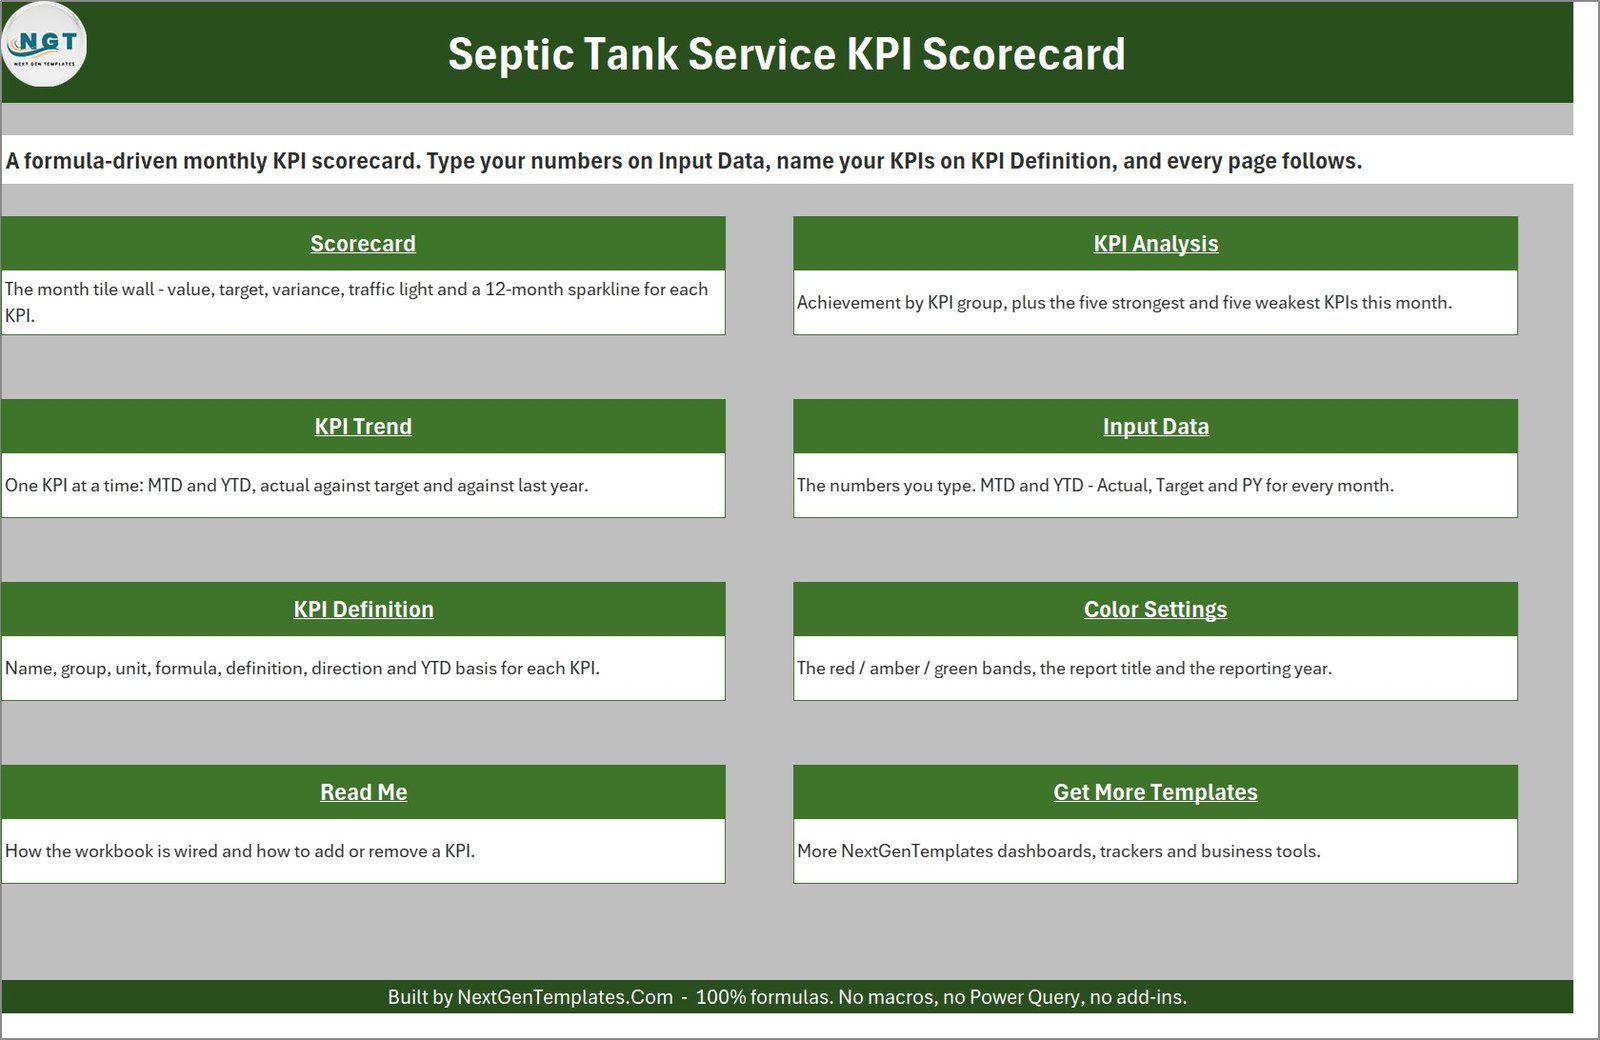
- Home – a linked index of every sheet with a one-line description of each.
- Scorecard – the ten-tile wall, with the Select Month, MTD/YTD, Vs. and KPI-set controls in the header. Each tile shows the value, the comparison value, the absolute change, the percentage change, an arrow, a traffic light and a 12-month sparkline.
- KPI Analysis – the RAG counter, achievement by KPI group, and the Top 5 / Bottom 5 tables. In the shipped March 2025 sample this reads 4 Green, 4 Amber and 2 Red across 10 KPIs, with Operations at 97.7%, Service Quality 96.8%, Financial 93.9% and Customer 97.0%.
- KPI Trend – one KPI at a time, four charts, driven by a dropdown fed from the KPI Definition sheet.
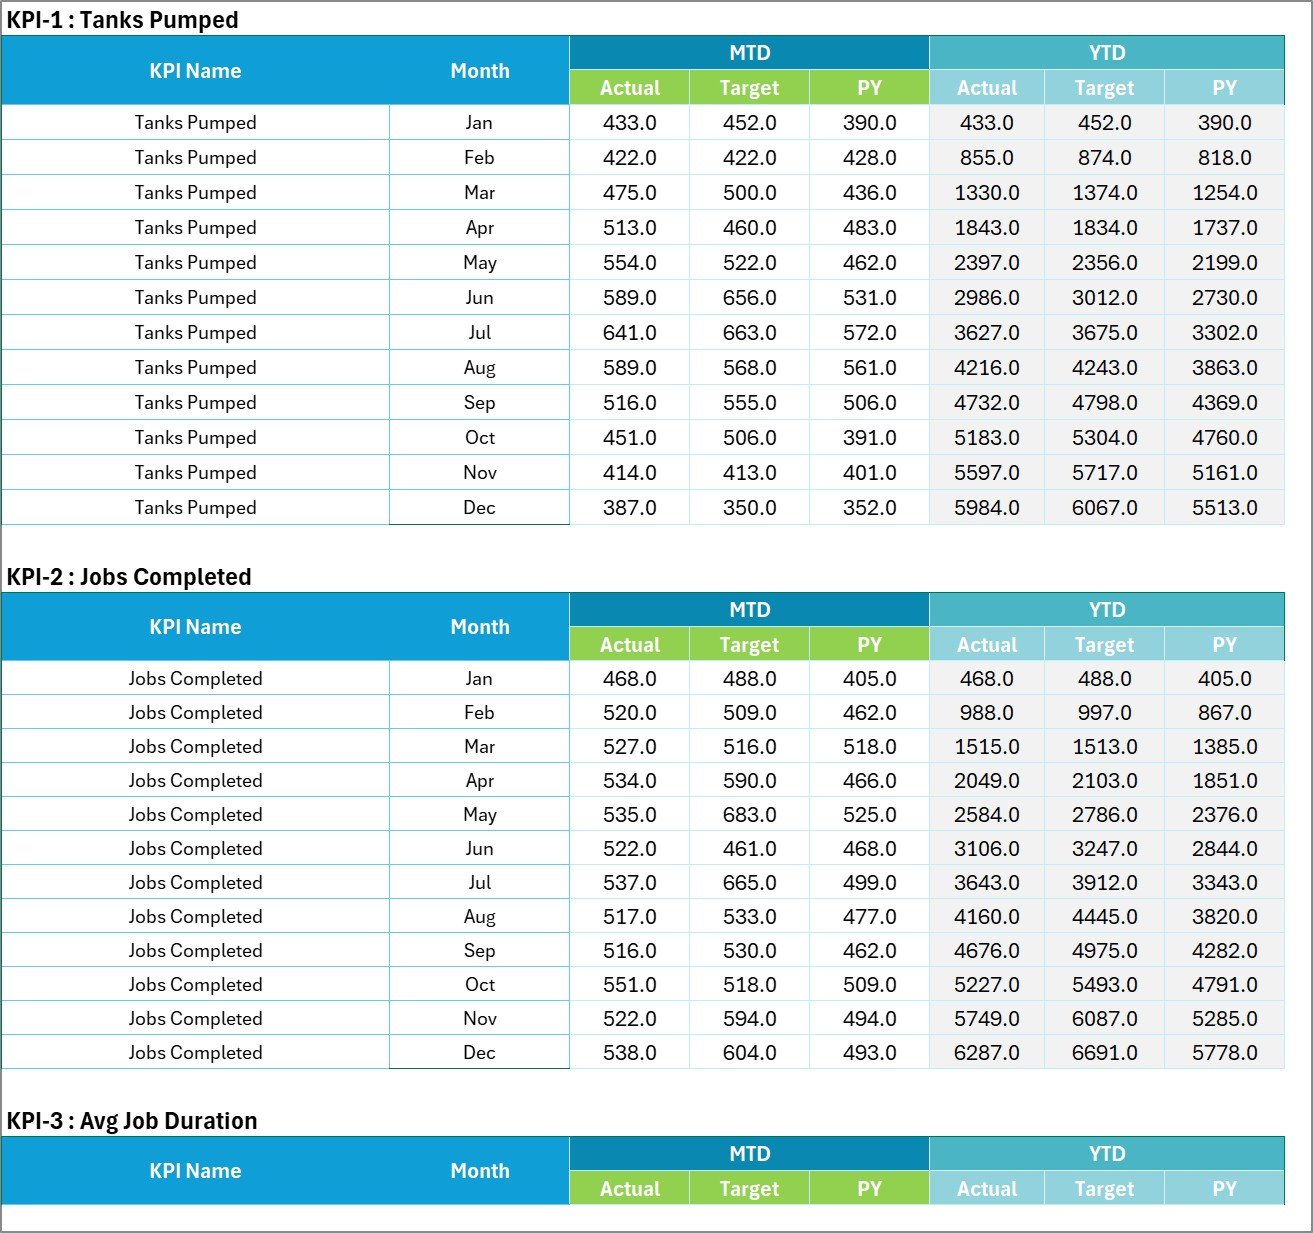
- Input Data – 20 numbered blocks, one per KPI slot, each 12 rows of Jan to Dec with MTD Actual / Target / PY and YTD Actual / Target / PY. This is where you type.
- KPI Definition – name, group, unit, formula text, definition, UTB/LTB direction, YTD basis and a duplicate-name Check column for each KPI.
- Color Settings – the RAG bands for upper-the-better and lower-the-better KPIs, plus the report title and the reporting year that feeds the month picker.
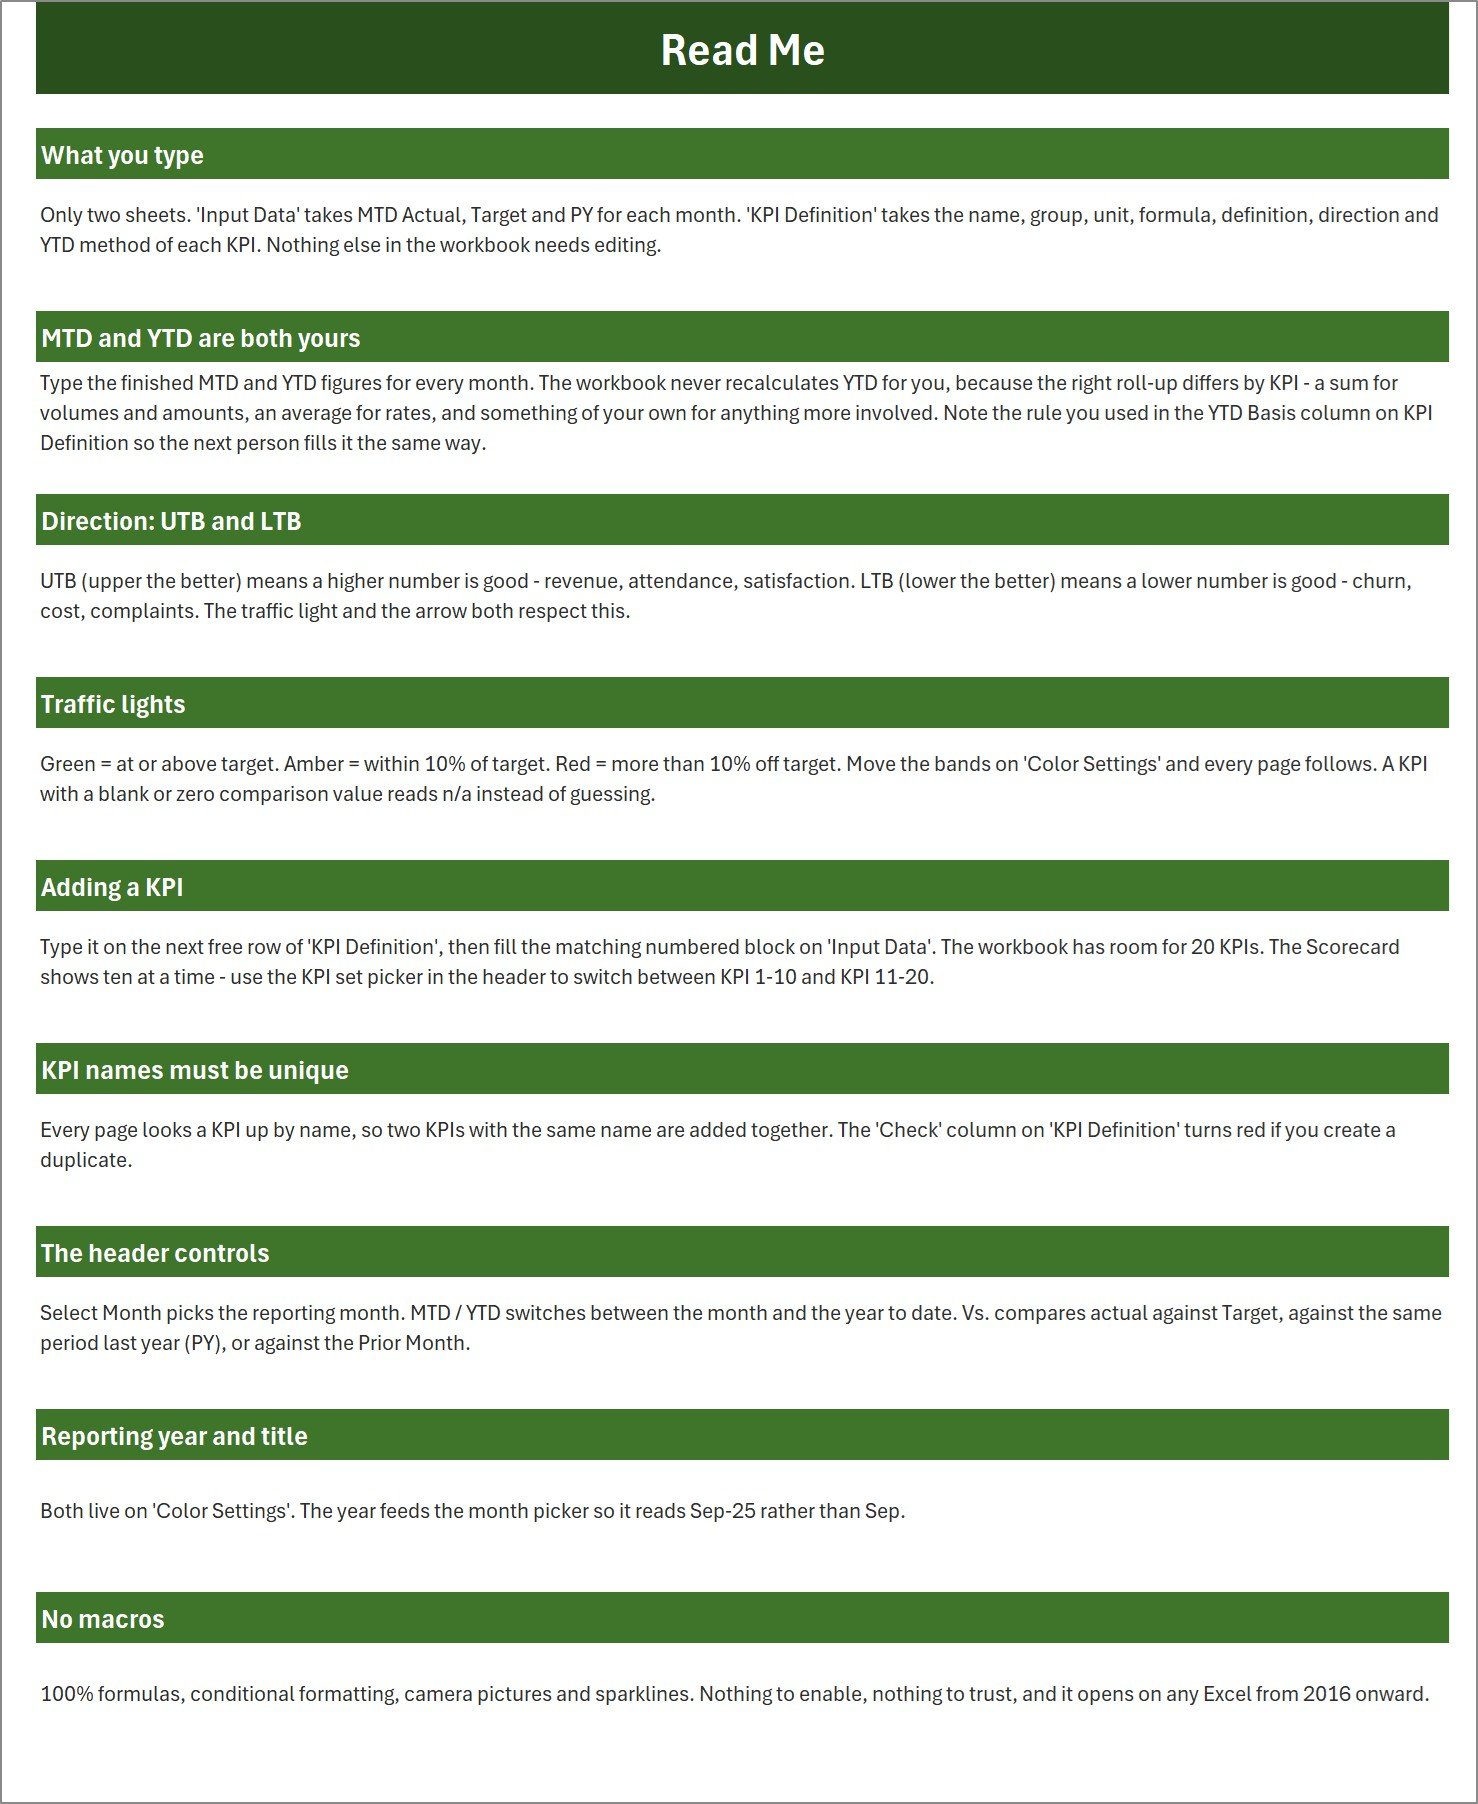
- Read Me – nine short sections covering what to type, how MTD and YTD work, UTB versus LTB, the traffic lights, adding a KPI, unique names, the header controls, the reporting year and the no-macros promise.
- Get More Templates – links to the rest of the NextGenTemplates range.
The Ten KPIs, Exactly As They Ship
| # | KPI | Group | Unit | Direction | YTD basis |
|---|---|---|---|---|---|
| 1 | Tanks Pumped | Operations | Count | Upper the better | Sum |
| 2 | Jobs Completed | Operations | Count | Upper the better | Sum |
| 3 | Avg Job Duration | Operations | Hours | Lower the better | Average |
| 4 | On-Time Arrival % | Service Quality | % | Upper the better | Average |
| 5 | First-Time-Fix % | Service Quality | % | Upper the better | Average |
| 6 | Callback Rate % | Service Quality | % | Lower the better | Average |
| 7 | Inspection Pass % | Service Quality | % | Upper the better | Average |
| 8 | Revenue per Job | Financial | USD | Upper the better | Average |
| 9 | Disposal Cost/Job | Financial | USD | Lower the better | Average |
| 10 | Customer Retention % | Customer | % | Upper the better | Average |
Every one of those names, units and direction flags is editable text on the KPI Definition sheet. Rename them for your yard and the Scorecard, KPI Analysis and KPI Trend pages all follow, because every page looks a KPI up by name.
What This Workbook Does Not Do – Please Read Before Buying
Septic and wastewater work is a regulated trade, and this file is a management scorecard, not a compliance tool. Specifically:
- No environmental compliance of any kind. It does not track, produce, validate or submit discharge permits, waste manifests, effluent or septage testing results, land-application records, EPA or state and local health-department reports, or operator certification and renewal dates.
- No inspection system. “Inspection Pass %” is a single percentage that you calculate outside the file and type into a cell. The workbook performs no inspection, stores no inspection record, and validates nothing against any standard.
- No safety or OSHA recordkeeping. There are no safety KPIs in this KPI set, no incident log, and nothing that could serve as an injury or confined-space record.
- No customer, property or job database. There is no address, tank ID, permit number, hauler number or manifest field anywhere in it. It stores twelve monthly numbers per KPI and nothing else.
- No live data connection. Nothing refreshes on its own. You type the finished MTD and YTD figures each month, exactly as the Read Me says.
Keep your regulatory records in whatever system your regulator requires. Use this to run the monthly management review on top of them.
Septic Tank Service KPI Scorecard in Excel vs. Google Sheets vs. Paid Field-Service SaaS – Where This Fits
| This Excel scorecard | Google Sheets scorecard | Paid field-service SaaS | |
|---|---|---|---|
| Cost | One payment, $9.99 on sale ($15.99 list) | One payment, similar | Typically $100-$400 per user per month |
| Platform | Microsoft Excel 2016+ / Microsoft 365, works offline | Browser, Google account required | Browser and mobile app, vendor cloud |
| Setup time | Rename 10 KPIs and paste 12 months of numbers – under an hour | Similar | Weeks: data migration, crew onboarding, configuration |
| Real-time team collaboration | No – one file, one editor at a time | Yes | Yes |
| Mobile access | Excel mobile, read-only in practice | Yes | Yes, dispatch and field apps included |
| Customisable KPI names and formulas | Yes – all ten are plain text you edit | Yes | Limited to the vendor’s metric library |
| Share with a link | No – you send the file | Yes | Yes |
| Year-1 cost at 5 users | $9.99 | About $9-$14 | $6,000-$24,000 |
| Captures individual jobs, routes and dispatch | No – monthly summary figures only | No | Yes, that is what you are paying for |
| Regulatory, manifest or permit records | No | No | Some platforms, as an add-on module |
If you already run dispatch software and just want a clean one-page monthly review to take into a management meeting, this file is the cheap half of that stack. If you have no job records at all, buy the dispatch software first.
Who This Template Is For – and Who It’s Not For
It is for owner-operators and small septic, portable-sanitation and grease-trap firms running two to fifteen trucks who already have job counts and revenue somewhere – a job book, an accounting package, a dispatch app – and want a monthly management view. It is for the office manager who currently rebuilds the same summary in a fresh spreadsheet every month. It is for a service manager who wants callbacks and on-time arrival in front of the crew leads with a red light on them.
It is not for anyone who needs per-job detail, scheduling, routing, invoicing or customer records – this holds twelve numbers per KPI and nothing else. It is not for anyone who needs a compliance or manifest record, for the reasons listed above. It is not for a team that must edit the same file simultaneously; take the Google Sheets edition of this line for that. And it is not an automatic report – somebody has to type the numbers each month.
How to Use the Septic Tank Service KPI Scorecard in Excel
- Open the .xlsx. No macro prompt appears, because there are no macros. Septic Tank Service KPI Scorecard in Excel
- Set your year and title. On Color Settings, put your reporting year in C19 and your report title in C18. The year feeds the month picker so it reads Mar-2025 rather than just Mar.
- Name your KPIs. On KPI Definition, edit the group, name, unit, formula text, definition, UTB/LTB direction and YTD basis for each of the ten rows. Keep the names unique – the Check column warns you if you duplicate one.
- Type your numbers. On Input Data, each KPI has its own numbered block of twelve month rows. Fill MTD Actual, Target and PY, then YTD Actual, Target and PY. The workbook does not roll YTD up for you on purpose: a sum is right for tank counts, an average is right for rates, and only you know which applies.
- Set your bands. On Color Settings, C5:C7 control the upper-the-better thresholds and G5:G7 the lower-the-better ones. The defaults are Green at or above target, Amber within 10%, Red beyond 10%.
- Read the Scorecard. Pick the month, choose MTD or YTD, choose whether you are comparing against Target, PY or Prior Month, and work down the reds. Septic Tank Service KPI Scorecard in Excel
- Drill in. KPI Analysis tells you which group is dragging and which five KPIs are weakest; KPI Trend shows any single KPI across all twelve months against target and against last year.
- Add KPIs 11-20 when you outgrow ten: add the row on KPI Definition, fill the matching numbered block on Input Data, then flip the KPI-set picker in the Scorecard header.
Real-World Use Cases
Dana, owner of a four-truck septic pumping company. Dana closes the month in her accounting package, then spends twenty minutes putting six numbers per KPI into Input Data. On the first Monday she opens the Scorecard on Mar-2025, MTD, versus Target: Callback Rate % and Disposal Cost/Job are red, everything else is green or amber. That is the whole agenda for the crew meeting. Septic Tank Service KPI Scorecard in Excel
Marcus, service manager at a regional wastewater hauler. Marcus does not care about the single month; he switches the header to YTD and Vs. PY to see whether this year is genuinely better than last. When Tanks Pumped comes out behind, he opens KPI Trend, picks Tanks Pumped, and the YTD Actual vs PY chart shows him the gap opened over the summer, not the winter.
Priya, office manager for a family firm that also runs portable sanitation. Priya renamed four of the ten KPIs on KPI Definition – Tanks Pumped became Units Serviced, Disposal Cost/Job became Dump-Site Fees per Job – typed her own numbers, and had a scorecard reading in her firm’s language in an afternoon. She left the RAG bands at 10% because she has nothing better to base them on yet.
An Honest Note on the Sample File
We open every workbook before listing it, and we tell you what we found. In this one: the two “Change these number as per your requirements” callouts on the Color Settings sheet carry a small grammar slip, and in the seventh preview image the right-hand callout is clipped by the page edge (the sheet itself is fine). In the shipped 2025 sample figures several percentage KPIs top out at exactly 97.0% in more than one month – a quirk of the demo data, not of the formulas. On the Scorecard tiles the large KPI number is always styled green; status is carried by the traffic light and the arrow, not by the colour of the number. And the two Actual-vs-PY charts on KPI Trend shade the Actual and PY series in opposite tones, though both legends are labelled correctly. None of this affects a single calculation, and all of it disappears from view once you replace the sample data with your own. Septic Tank Service KPI Scorecard in Excel
Frequently Asked Questions
Does the month dropdown really work, or is the sample month baked in?
It works. Select Month is a form-control dropdown wired to a linked cell, and every tile, the KPI Analysis page and the group rankings recalculate from Input Data when you change it. Pick any of the twelve months and the page redraws.
Are the traffic-light thresholds actually editable, or hard-coded somewhere else?
Editable. The Scorecard tile formulas and the KPI Analysis status column both reference Color Settings cells C5:C7 and G5:G7 directly. Change those six numbers and every page in the workbook follows immediately.
Does it handle KPIs where a lower number is better?
Yes, and that is what the UTB/LTB column is for. Three of the ten shipped KPIs are lower-the-better – Avg Job Duration, Callback Rate % and Disposal Cost/Job – and rising values on those show as red with a red up-arrow, not green. Septic Tank Service KPI Scorecard in Excel
Will it calculate my year-to-date figures for me?
No, and that is deliberate. You type both MTD and YTD, because the correct roll-up differs per KPI: tanks pumped should be summed, on-time arrival should be averaged. The YTD Basis column on KPI Definition is where you record which rule you used.
Can I use it for more than ten KPIs?
Up to twenty. Input Data ships with twenty numbered blocks running to row 319, and the KPI-set picker in the Scorecard header switches the tile wall between KPI 1-10 and KPI 11-20. Septic Tank Service KPI Scorecard in Excel
Does it help with permits, manifests or health-department reporting?
No. It contains no compliance, permit, manifest, effluent-testing or regulatory-reporting capability of any kind, and it is not a substitute for whatever record-keeping your regulator requires. It is a management scorecard for numbers you have already worked out elsewhere. Septic Tank Service KPI Scorecard in Excel
Do I need macros or an add-in?
Neither. It is a plain .xlsx built from formulas, conditional formatting, camera pictures, sparklines and form controls, and it opens in Excel 2016 and later including Microsoft 365. There is no macro prompt and nothing to enable.
What is the difference between this and your KPI Dashboards?
This is the scorecard line: a fixed ten-tile monthly page reading typed MTD and YTD figures against targets. The KPI Dashboard line is a different template with a different layout and a different page set, and the analytical Excel Dashboards are different again – those are built on a row-level transaction table with pivots and slicers. Same industries, three different products. Septic Tank Service KPI Scorecard in Excel
About the Author
Built by PK – Microsoft Certified Professional with 15+ years of Excel, Google Sheets, and Power BI experience. Founder of NextGenTemplates, reaching 300K+ subscribers across YouTube channels. Every template is hand-built and tested before release. Septic Tank Service KPI Scorecard in Excel
Explore Related Templates
Nearest neighbours in the same scorecard line, all built on the identical engine: Plumbing Business KPI Scorecard in Excel, HVAC Contractor KPI Scorecard in Excel and Insulation Contractor KPI Scorecard in Excel. If your team lives in a browser rather than in Excel, take the Plumbing Business KPI Scorecard in Google Sheets instead. For the larger month-picker dashboard with its own layout and page set, see the Plumbing Business KPI Dashboard in Excel. Everything else lives under KPI Dashboard and MS Excel.
Paving Contractor, Fencing Contractor and Swimming Pool Service editions of this same scorecard are in preparation and will join the list shortly.
Download the Septic Tank Service KPI Scorecard in Excel now – one payment, instant download, yours to edit forever. Rename the ten KPIs, paste twelve months of numbers, and you have a monthly management review that takes ten minutes instead of an afternoon.
Last updated: September 2026.
Watch the demo video:
Compatibility and Requirements
- Works in Microsoft Excel desktop (Excel 2016 or later, or Microsoft 365). The file is a plain .xlsx with no macros.
- The tile wall includes sparklines and charts. Microsoft explains how to build them in Create a chart from start to finish.
More Questions About This Template
Can I use it with my own KPI names?
Yes. Edit the group, name, unit, formula text, definition, direction and YTD basis on the KPI Definition sheet. The Scorecard, KPI Analysis and KPI Trend pages follow the new names.
Is there a Google Sheets version of this scorecard?
Yes. See the Septic Tank Service KPI Scorecard in Google Sheets.
Is there a dashboard version for septic companies?
Yes. The Septic Tank Service KPI Dashboard in Excel is a separate template with its own layout. A Power BI edition is also available.
Related Septic Tank Service Templates
- Septic Tank Service KPI Dashboard in Excel: the dashboard line for the same business
- Septic Tank Service KPI Scorecard in Google Sheets: the same scorecard in a browser
- Septic Tank Service KPI Dashboard in Power BI: the Power BI edition
- Septic Tank Service KPI Dashboard in Google Sheets: the dashboard in Google Sheets
- KPI Dashboard Library (Excel): 15 KPI templates in one download
Browse all Excel KPI dashboards.
































Reviews
There are no reviews yet.