

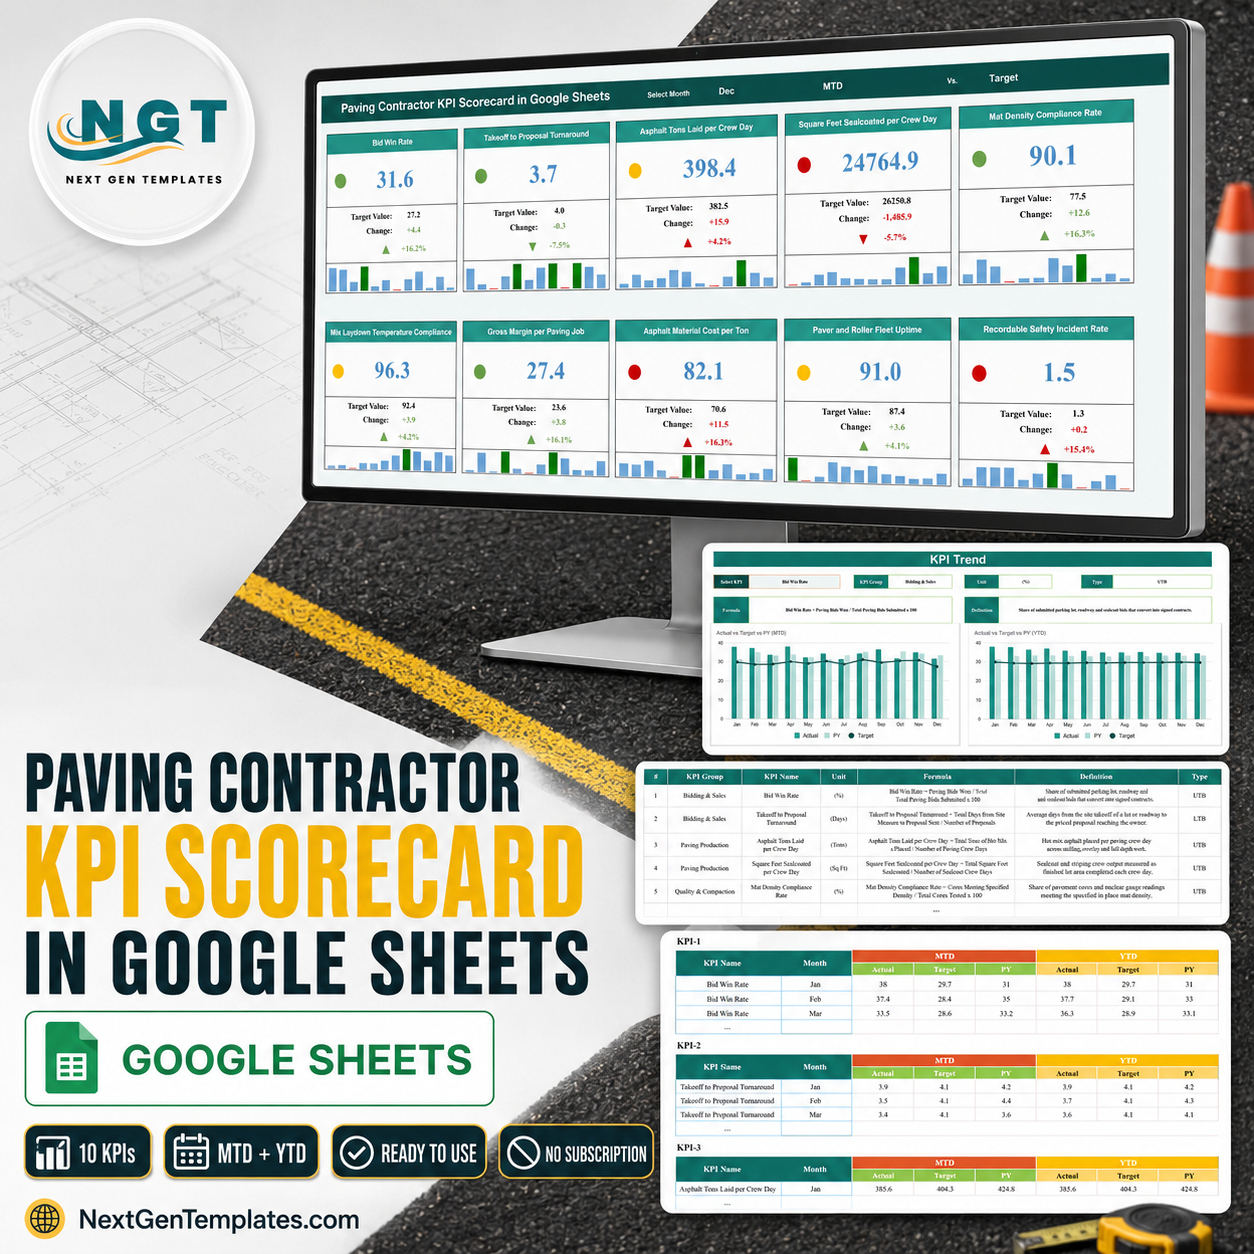

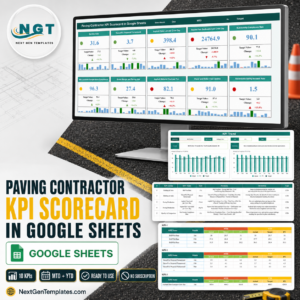
The Paving Contractor KPI Scorecard in Google Sheets puts ten paving-specific numbers on one screen: pick a month, and every KPI shows its actual, its target, the gap in units and in percent, a red / amber / green light and a twelve-month mini bar strip. In the December sample loaded in the file, four KPIs sit green, three amber and three red – the split a real asphalt season produces. It is a month-picker scorecard, not an analytics dashboard, and every figure on the board is formula-driven from one editable data page, so replacing the sample numbers is the only setup step. One-time price, instant download, no subscription and no add-on to authorise.Paving Contractor KPI Scorecard in Google Sheets
Key Features of the Paving Contractor KPI Scorecard in Google Sheets
- Ten paving KPIs in five groups – Bidding & Sales (2), Paving Production (2), Quality & Compaction (2), Financial (2) and Fleet & Safety (2).
- Three dropdowns drive the whole board – a month picker, an Actual Type switch for MTD or YTD, and a Vs. switch for Target or PY (prior year). Change any one and all ten cards, lights and change figures recalculate.
- Red / amber / green traffic lights – a coloured dot per card, scored against that KPI’s own target rather than one global rule.
- Direction-aware scoring – seven KPIs are typed UTB (upper is better) and three are LTB (lower is better), so Takeoff to Proposal Turnaround, Asphalt Material Cost per Ton and Recordable Safety Incident Rate score correctly when they fall.
- Editable RAG bands – a Color Settings tab holds the thresholds as plain cells: for upper-is-better KPIs, variance at or below 0% is red, at or below 10% amber and above 10% green, with the mirror image applied to lower-is-better KPIs. Tighten or loosen them without touching a formula.
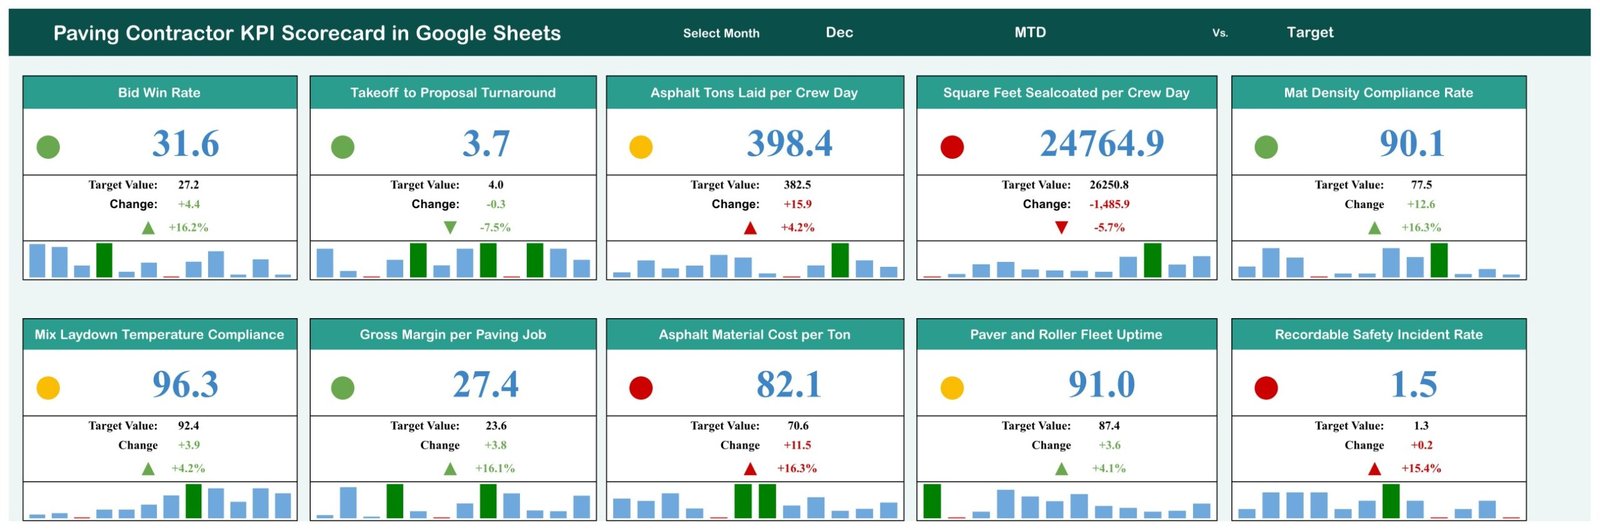
- Change in units and in percent – each card shows the raw gap to target (for example +12.6) and the same gap as a percentage (+16.3%), with an up or down arrow.
- Twelve-month spark strip on every card – one small bar per month with the selected month highlighted, so a card shows position as well as level.
- A KPI Trend page with its own picker – choose any of the ten KPIs and the page fills in its group, unit, UTB/LTB type, formula and written definition, then draws two charts: Actual vs Target vs PY (MTD) and Actual vs Target vs PY (YTD).
- A written formula and definition for all ten KPIs – every metric ships with its exact calculation and a one-line plain-English definition, so an estimator and a foreman read the same number the same way.
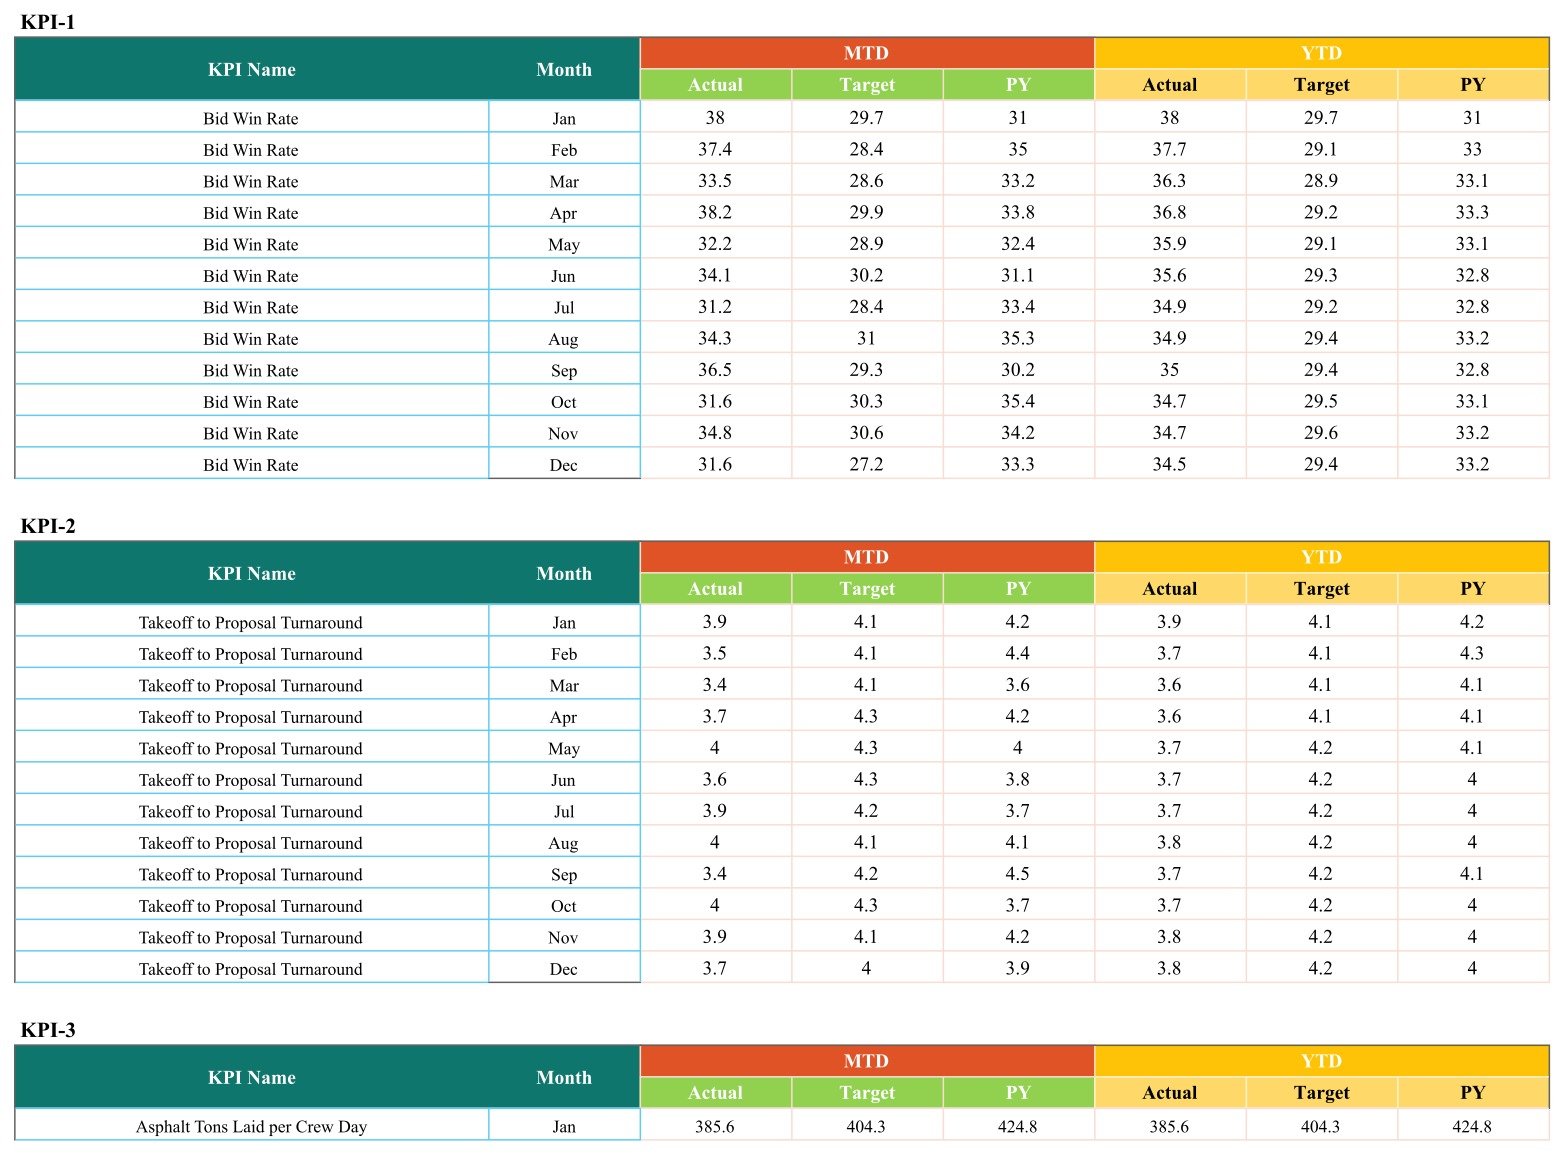
- Open monthly data table – 10 KPI blocks of 12 months each, carrying MTD actual, target and prior-year plus YTD actual, target and prior-year. 120 rows, six value columns, all typed by you.
What’s Inside the Paving Contractor KPI Scorecard in Google Sheets
The download is a PDF that carries a “Make a copy” link. Click it and Google Drive creates your own editable copy of the sheet – there is nothing to install and no add-on to authorise.
Page 1 – KPI Scorecard. The header row holds the month picker (Dec in the sample), the MTD / YTD switch and the Target / PY switch. Below it, ten cards in two rows of five. The December sample reads: Bid Win Rate 31.6 against a 27.2 target, Takeoff to Proposal Turnaround 3.7 against 4.0, Asphalt Tons Laid per Crew Day 398.4 against 382.5, Square Feet Sealcoated per Crew Day 24,764.9 against 26,250.8, Mat Density Compliance Rate 90.1 against 77.5, Mix Laydown Temperature Compliance 96.3 against 92.4, Gross Margin per Paving Job 27.4 against 23.6, Asphalt Material Cost per Ton 82.1 against 70.6, Paver and Roller Fleet Uptime 91.0 against 87.4, and Recordable Safety Incident Rate 1.5 against 1.3.
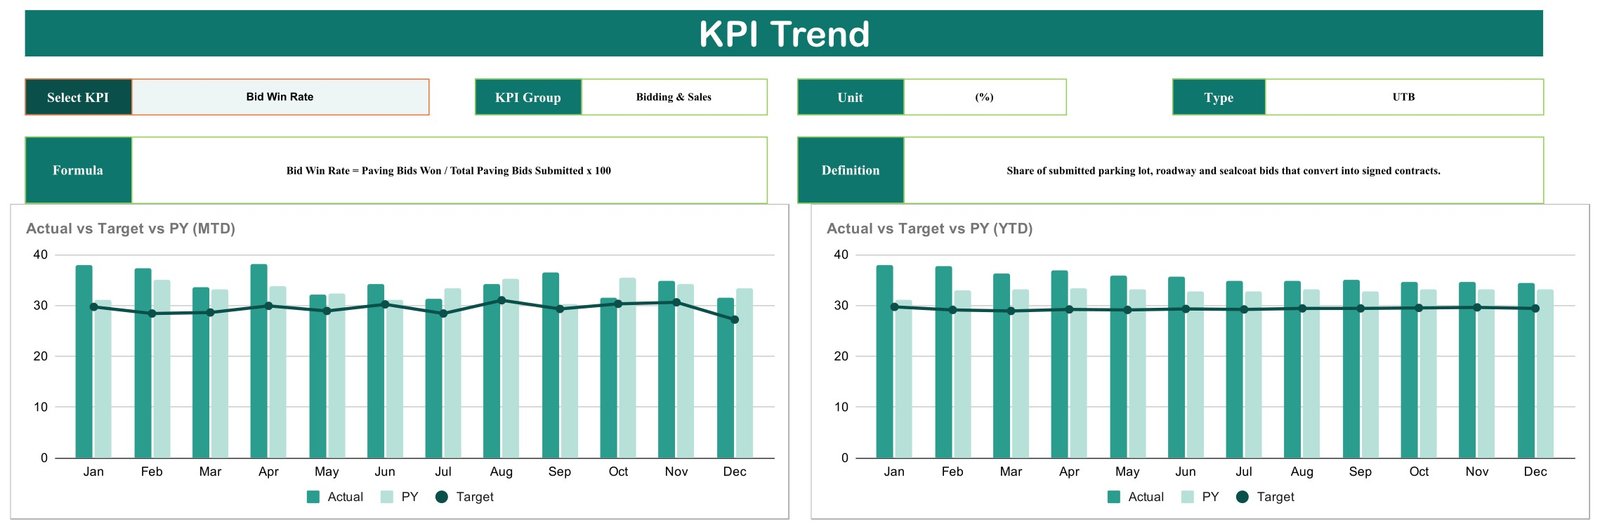
Page 2 – KPI Trend. A Select KPI picker at the top left, then read-only fields for KPI Group, Unit and Type, and full-width Formula and Definition boxes. With Bid Win Rate selected the page reports the Bidding & Sales group, a (%) unit, UTB type and the formula Bid Win Rate = Paving Bids Won / Total Paving Bids Submitted x 100. Two combination charts sit underneath – Actual vs Target vs PY (MTD) and Actual vs Target vs PY (YTD) – each with twelve months on the axis, Actual and PY columns and a Target line.

Page 3 – KPI definitions. One table, ten rows, columns for #, KPI Group, KPI Name, Unit, Formula, Definition and Type. Units run (%), (Days), (Tons), (Sq Ft), ($) and (TRIR), so rate metrics, money metrics and safety metrics stay visibly separate. This is also where you retype a KPI and, importantly, its UTB / LTB type.
Page 4 – monthly data. One block per KPI labelled KPI-1 to KPI-10, twelve rows each, with MTD Actual / Target / PY and YTD Actual / Target / PY in colour-coded column groups. This is the only sheet you type in.
Behind those four pages the file also carries a Color Settings tab holding the RAG thresholds, two calculation tabs that do the SUMIFS lookups against named ranges, and an empty Read Me tab. Everything a buyer touches is on the four pages above.
Paving Contractor KPI Scorecard vs. Excel vs. Paid Construction SaaS – Where This Fits
| This Google Sheets scorecard | An Excel KPI workbook | Paid construction SaaS (Procore, B2W, HCSS) | |
|---|---|---|---|
| Cost | One-time 13.99 (8.99 on sale) | One-time purchase | Roughly 300-1,500 per month, often with an onboarding fee |
| Platform | Google Sheets in any browser | Microsoft Excel desktop | Vendor-hosted web and mobile app |
| Setup time | Minutes – copy the sheet, replace 120 rows of sample data | Minutes, once Excel is installed | Weeks of configuration and data migration |
| Real-time team collaboration | Yes, native Google Sheets sharing | Only through OneDrive co-authoring | Yes |
| Mobile access | Yes, via the Google Sheets app | Limited | Yes, purpose-built apps |
| Customisable KPIs | Yes – every KPI name, formula, unit, target and UTB/LTB type is an editable cell | Yes | Only within the vendor’s data model |
| MTD and YTD on the same board | Yes – one dropdown switches the basis | Depends on the workbook | Yes |
| Compare against prior year | Yes – a Vs. dropdown swaps Target for PY | Depends on the workbook | Usually yes |
| Share with a link | Yes | No | Per-seat login required |
| Year-1 cost at 5 users | 13.99 total | One-time template cost plus Office licences | 3,600-18,000 |
| Connects to your accounting, estimating or dispatch system | No – values are typed in | No | Yes |
The honest summary: if you need estimating, dispatch, daily crew logs and invoicing tied together, buy the SaaS. If what you actually want is ten paving numbers reviewed once a month against target and last year, this sheet does that for less than the price of a tack coat drum.
Who This Template Is For – and Who It’s Not For
A good fit for: owner-operators and small-to-mid asphalt and sealcoat contractors running parking lots, driveways, overlays and municipal roadway work; estimators who want bid conversion and takeoff turnaround sitting next to production output; superintendents who hold a monthly numbers meeting; and anyone currently rebuilding the same one-page summary by hand in a fresh spreadsheet every month.
Not a good fit if: you need live data pulled from your accounting, estimating or dispatch software – this sheet does not connect to anything and does not import; you want alerts, reminders or emails when a KPI turns red – it has none; you need per-job, per-crew or per-lot drilldown – it reports at company level by month; you need a safety or quality compliance record – the Recordable Safety Incident Rate, mat density and laydown temperature KPIs here are summary percentages you type in yourself, and this is not an OSHA recordkeeping system, not a substitute for the OSHA 300 log, and not a substitute for core reports, nuclear gauge records or any certified test documentation; or you track more than ten KPIs and are unwilling to edit the sheet to add rows.
How to Use the Paving Contractor KPI Scorecard in Google Sheets
- Open the PDF in your download and click the “Make a copy” link. Google Drive creates your own editable copy in your own Drive.
- Go to the Input Data page and replace the sample MTD and YTD figures with your own – one block per KPI, twelve months each.
- Set your targets in the Target columns. These drive both the change figures and the traffic lights, so a soft target produces a green board that means nothing.
- Rename any KPI you do not use on the KPI Definition page – change the name, group, unit, formula text, definition and, most importantly, the UTB / LTB type so the scoring direction follows the metric.
- Tune the RAG bands on the Color Settings tab if 0% / 10% is not how your business defines amber.
- Set the month picker on the scorecard page to the month you are reviewing, and use the MTD / YTD and Target / PY switches to change the question the board answers.
- Use the KPI Trend page in the meeting – pick the one metric that turned red and show its twelve-month MTD and YTD charts against target and last year.
- Share the sheet with your estimator and operations lead using Google Sheets’ own sharing, view-only if you only want them reading it.
Real-World Use Cases
Ellis runs a six-truck sealcoat and striping outfit. His paving crew was fine; the sealcoat side was quietly losing days. On the December board, Square Feet Sealcoated per Crew Day was the deepest red on the page – 24,764.9 against a 26,250.8 target, down 5.7% – while Asphalt Tons Laid per Crew Day was still above target. Two adjacent cards told him the problem was one crew and one product line, not the season.
Priya estimates for a mid-size paving contractor. She watches Bid Win Rate and Takeoff to Proposal Turnaround together. In the sample month conversion is 31.6% against a 27.2% target while turnaround has come down to 3.7 days against a 4.0-day target – the pairing is the argument that faster proposals, not cheaper prices, won the work.
Dale carries the plant and safety numbers. Asphalt Material Cost per Ton at 82.1 against a 70.6 target and Recordable Safety Incident Rate at 1.5 against 1.3 both score red on the same board – and because both are typed lower-is-better, the sheet marks them red for being above target rather than rewarding the increase. Seeing liquid AC cost and crew incidents on one screen is what turns a monthly meeting into two decisions instead of twenty slides.
Frequently Asked Questions
Is this the KPI Scorecard, the KPI Dashboard, or the analytical paving dashboard?
This is the KPI Scorecard line – a month-picker board with ten KPI cards, traffic lights, a KPI Trend page and a KPI definitions page, built in Google Sheets. It is not the KPI Dashboard family, and it is not the analytical dashboard family with slicers and pivot pages. Near-identical names exist across all three lines, so check the line before you buy. The companion Paving Contractor KPI Dashboard in Excel is a different product with a different layout, not another copy of this one.
Does it connect to my accounting, estimating or dispatch software?
No. There are no integrations, no imports and no API. You type or paste the monthly values into the Input Data page. That is the deliberate trade-off that keeps it a 13.99 sheet rather than a subscription.
Will it email or alert me when a KPI goes red?
No. There are no alerts, notifications or scheduled reminders. The traffic lights are visual only, on the sheet.
Can I change the ten KPIs to my own?
Yes. Every KPI name, group, unit, formula text, definition and UTB / LTB type is an editable cell on the KPI Definition page, and the Input Data page has a matching block per KPI. Keep the row structure and the scorecard, the trend page and the traffic lights all follow.
Is the safety KPI an OSHA record?
No. Recordable Safety Incident Rate is a TRIR figure you calculate and type in yourself. It is a management number for a monthly review – not an OSHA 300 log, not an incident report, and not anything an inspector or an insurer would accept as a record.
Do the density and temperature KPIs count as quality documentation?
No. Mat Density Compliance Rate and Mix Laydown Temperature Compliance are summary percentages you enter. They are not core reports, nuclear gauge printouts or a substitute for the QC documentation an owner or DOT will ask for.
Do I need a paid Google Workspace account?
No. A free Google account is enough. The PDF’s copy link creates the sheet in your own Drive, and it stays yours.
Is there an Excel version?
There is a companion Paving Contractor KPI Scorecard in Excel, but it is a separate build rather than a file-for-file port: it ships its own ten paving KPIs, adds a KPI Analysis page and blank slots for a second set of ten, and its Vs. control also offers Prior Month. Only Bid Win Rate appears in both. Pick the platform your team already lives in – this Google Sheets edition is the one that shares by link and opens on a phone.
About the Author
Built by PK – Microsoft Certified Professional with 15+ years of Excel, Google Sheets, and Power BI experience. Founder of NextGenTemplates, reaching 300K+ subscribers across YouTube channels. Every template is hand-built and tested before release.Paving Contractor KPI Scorecard in Google Sheets
Explore Related Templates
- Paving Contractor KPI Scorecard in Excel – the Excel companion, with its own ten paving KPIs and an extra KPI Analysis page.
- Concrete Contractor KPI Scorecard in Google Sheets and Masonry Contractor KPI Scorecard in Google Sheets – the same board built for flatwork and for block, brick and stone.
- Roofing Contractor KPI Scorecard in Google Sheets, Drywall Contractor KPI Scorecard in Google Sheets and Flooring Installation KPI Scorecard in Google Sheets – useful if you run more than one trade under one roof.
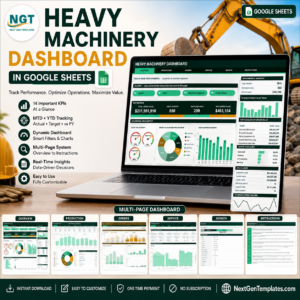
- Heavy Machinery Dashboard in Google Sheets – the analytical view of the plant and fleet behind the paving crew.
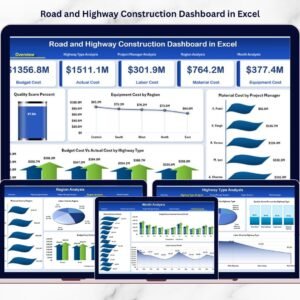
- Road and Highway Construction Dashboard in Excel – project-level analysis when a monthly scorecard is no longer enough.
- Civil Contractor Job Management System Web App – a full job, crew and billing system, if you have outgrown a spreadsheet.
- Browse the whole Google Sheets catalogue or the KPI Dashboard category for more scorecards.Paving Contractor KPI Scorecard in Google Sheets
Get the Paving Contractor KPI Scorecard in Google Sheets today – one-time payment, instant download, no subscription. Open the PDF, click the copy link, and you have ten paving KPIs on one screen in under five minutes. A full walkthrough is on the NeoTechNavigators blog.Paving Contractor KPI Scorecard in Google Sheets
Watch the step-by-step video Demo:
Last updated: 1 September 2026.
Compatibility and Requirements
- Works in Google Sheets. You need a free Google account and a web browser.
- Three dropdowns (month, MTD or YTD, Target or PY) drive the scorecard. Google explains dropdowns in Create an in-cell dropdown list.





























Reviews
There are no reviews yet.