

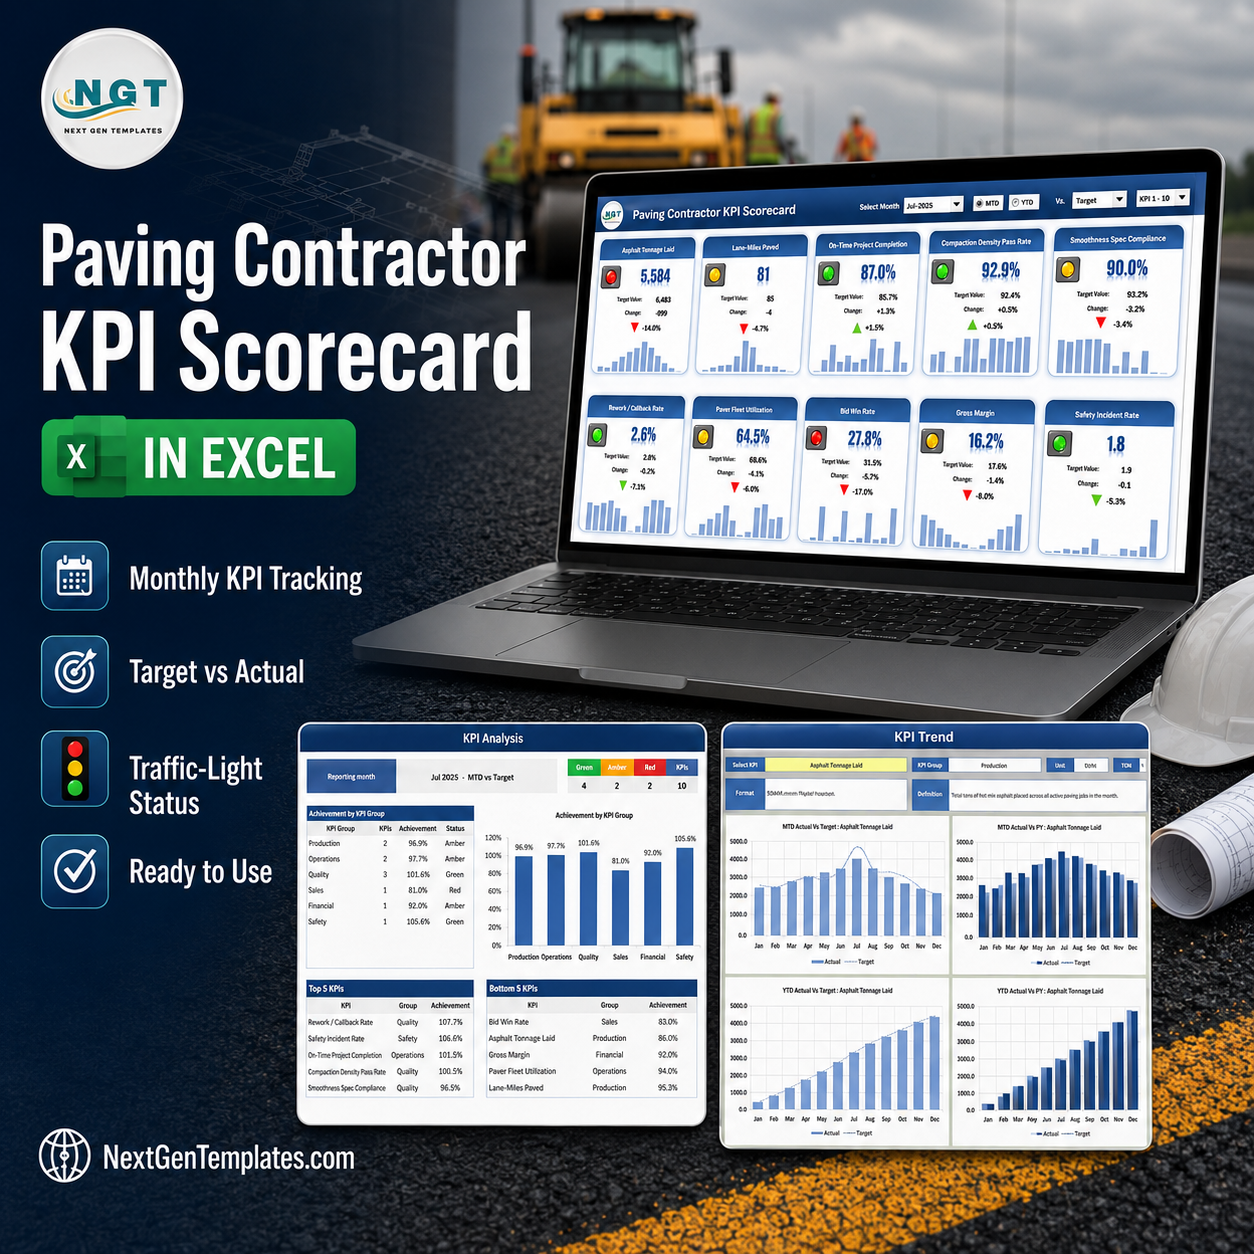


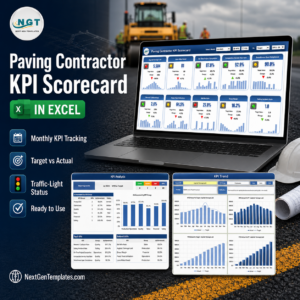
The Paving Contractor KPI Scorecard in Excel reports ten paving KPIs on one page for any month of the year: asphalt tonnage, lane-miles, on-time completion, compaction density, IRI smoothness, rework, paver utilisation, bid win rate, gross margin and TRIR. Ten KPIs across six groups, twelve months of MTD and YTD figures, nine worksheets, room for twenty KPIs and zero macros. It runs on the same scorecard engine already selling as our Drywall, Masonry, Carpentry, Concrete and Insulation scorecards. Instant download: one ZIP holding the .xlsx and a six-page user manual PDF. Opens in Excel 2016 or later – no add-ins, no subscription, nothing to enable. If it will not open for you, email us and we will make it right.
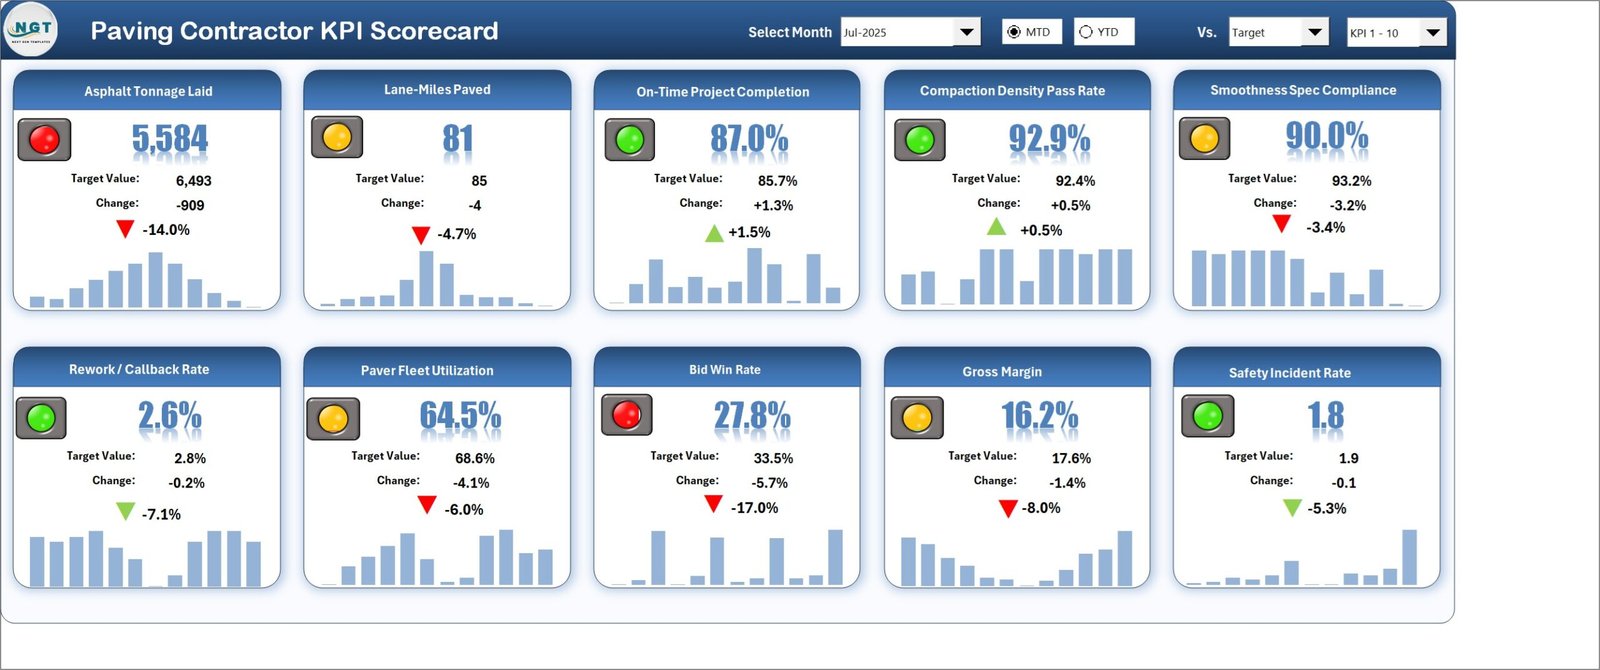
Which product is this? This is the KPI Scorecard line – a typed-figure monthly scorecard. It is not the Paving Contractor KPI Dashboard in Excel, which is a separate and larger template, and it is not one of our slicer-driven analytical Excel dashboards. The three families share a naming pattern but not a structure. This one is the tile wall, plus an analysis page and a trend page.
Key Features of the Paving Contractor KPI Scorecard in Excel
- Ten paving KPIs, already written in. Asphalt Tonnage Laid and Lane-Miles Paved (Production), On-Time Project Completion and Paver Fleet Utilization (Operations), Compaction Density Pass Rate, Smoothness Spec Compliance and Rework / Callback Rate (Quality), Bid Win Rate (Sales), Gross Margin (Financial) and Safety Incident Rate (Safety).
- Direction-aware traffic lights. Eight KPIs are marked UTB (upper the better) and two are marked LTB (lower the better) – Rework / Callback Rate and Safety Incident Rate. A falling rework rate shows a green down-arrow, not a red one.
- Four header controls on the Scorecard. Select Month picks any month of the reporting year; an MTD / YTD pair of option buttons switches the whole page; a Vs. dropdown compares against Target, Prior Year or Prior Month; a KPI set picker flips between KPI 1-10 and KPI 11-20.
- A 12-month sparkline on every tile, sitting under the value, the target, the change and the change percentage.
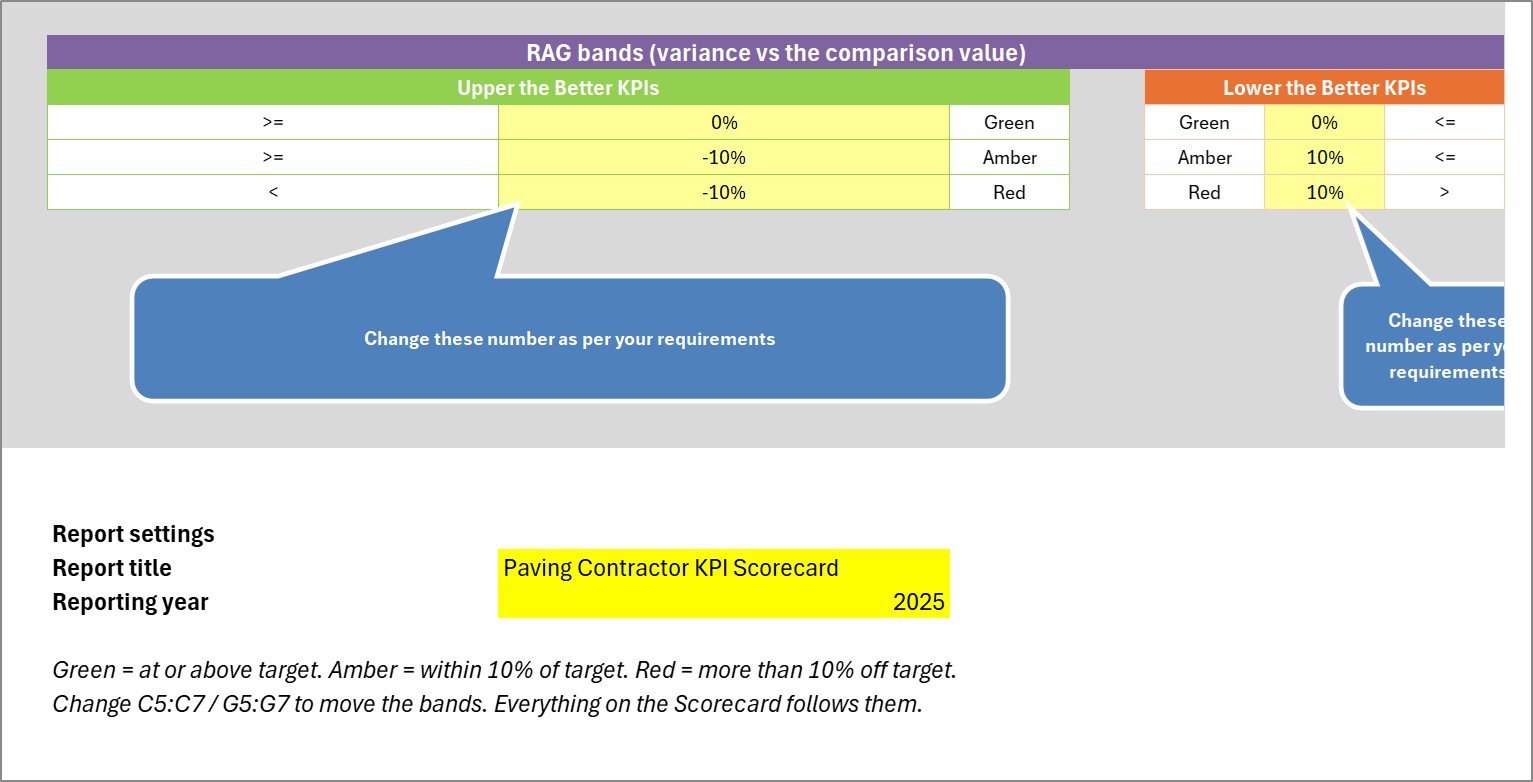
- Editable RAG bands. Green at or above target, Amber within 10% of target, Red beyond that. The thresholds sit in six cells on Color Settings and every page follows them.
- Room for twenty KPIs. Ten are filled with paving metrics; the remaining ten blocks sit empty and are ignored until you use them.
- 100% formulas. No macros, no Power Query, no pivot tables, no add-ins and no internet connection.
What’s Inside the Paving Contractor KPI Scorecard in Excel
Nine visible worksheets in four layers, plus a hidden calculation sheet you never touch.
- Home – a linked index to all eight other pages, each with a one-line description.
- Scorecard – the tile wall. Ten cards, each with a traffic light, the value, Target Value, Change, Change % with an up or down arrow, and the sparkline.
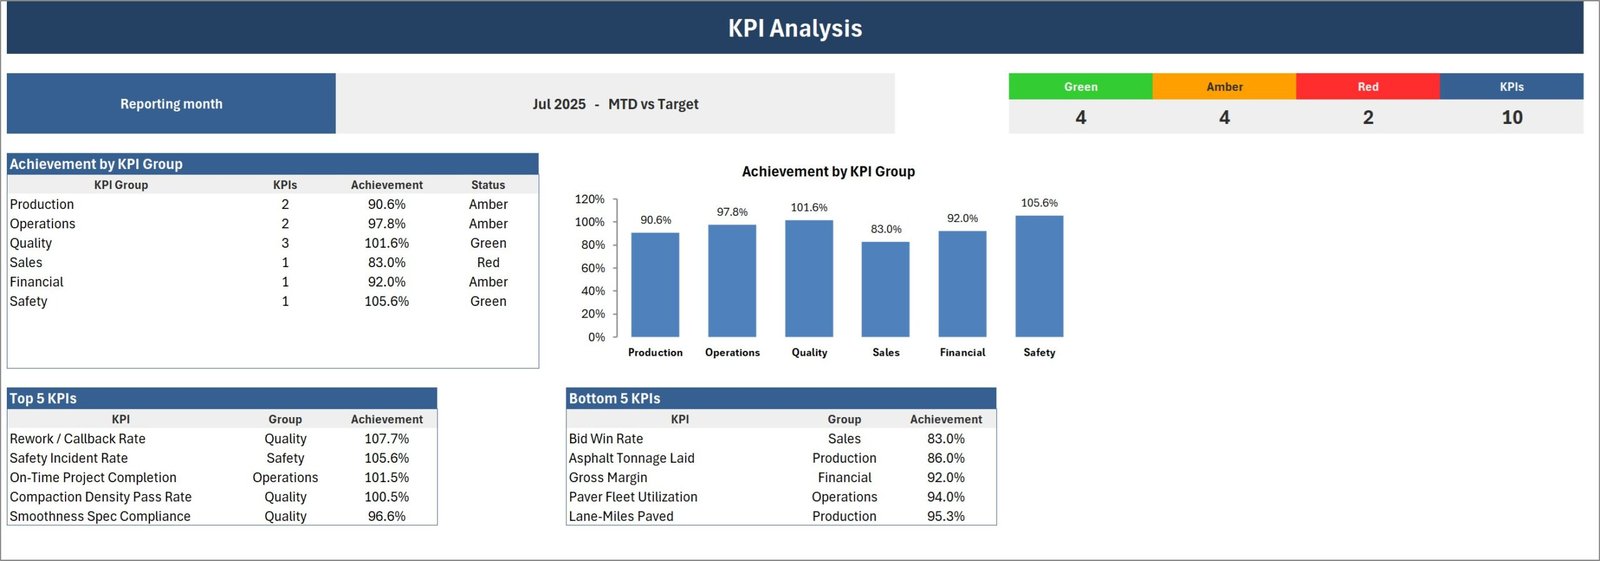
- KPI Analysis – the reporting month and basis, a Green / Amber / Red / KPIs count strip, an Achievement by KPI Group table with a matching column chart, and Top 5 KPIs and Bottom 5 KPIs tables showing group and achievement.
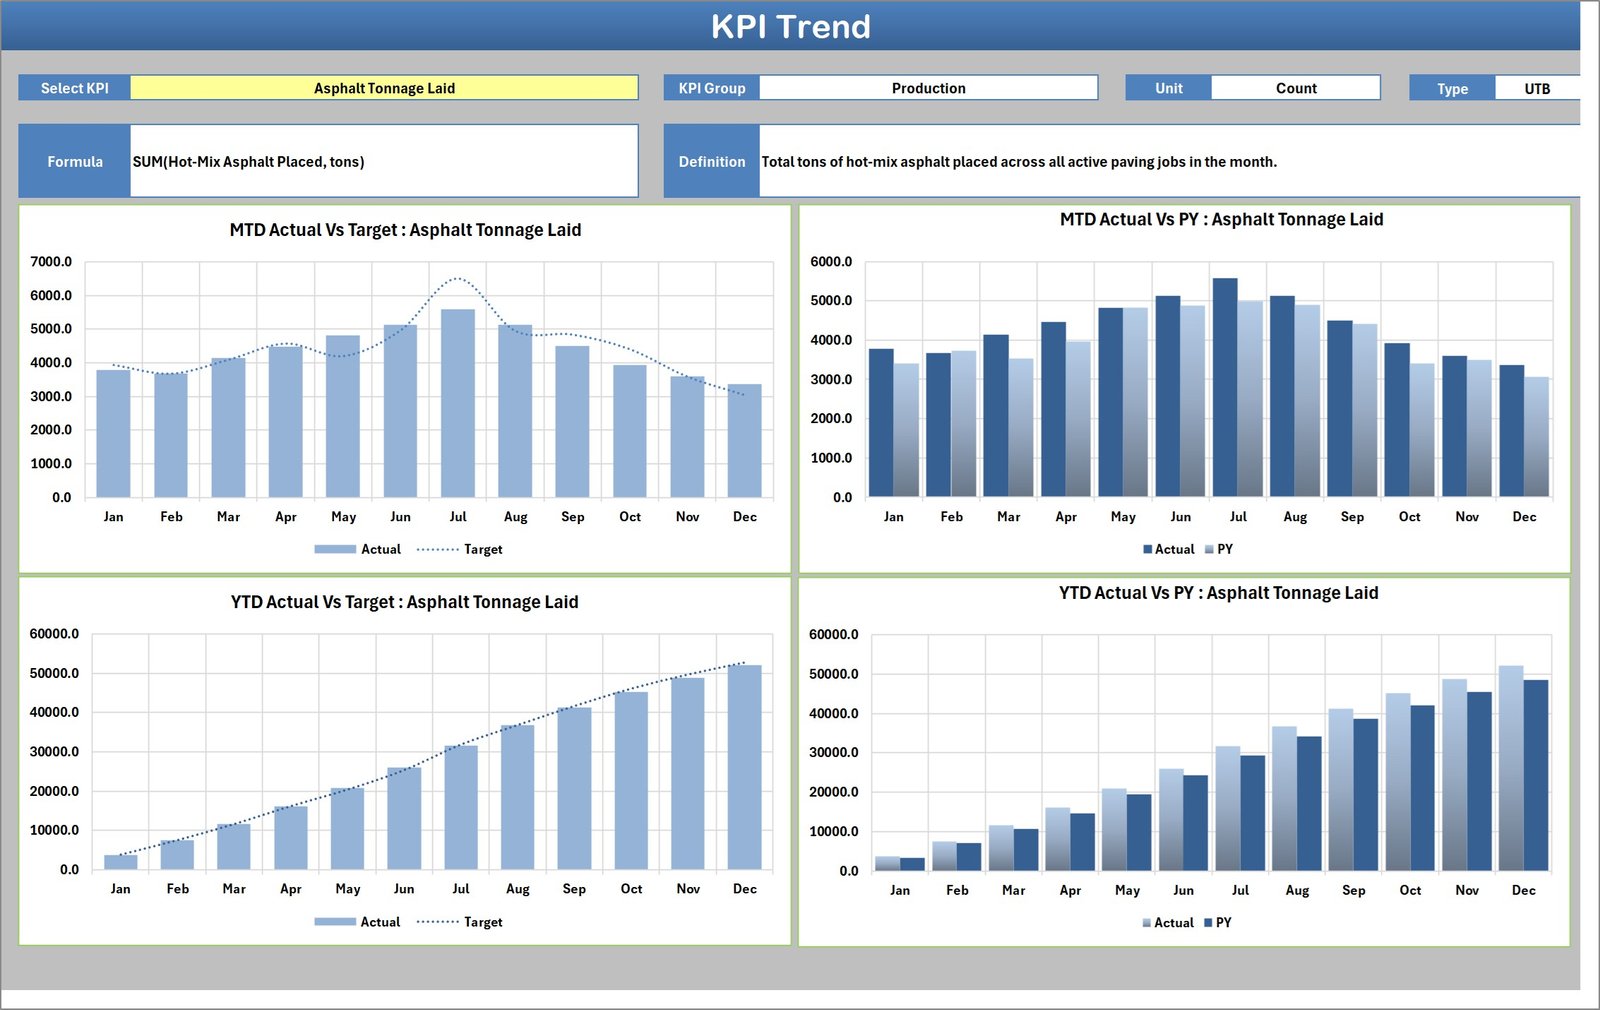
- KPI Trend – pick one KPI from a dropdown and read its group, unit, type, formula and definition, then four charts: MTD Actual Vs Target, MTD Actual Vs PY, YTD Actual Vs Target and YTD Actual Vs PY.
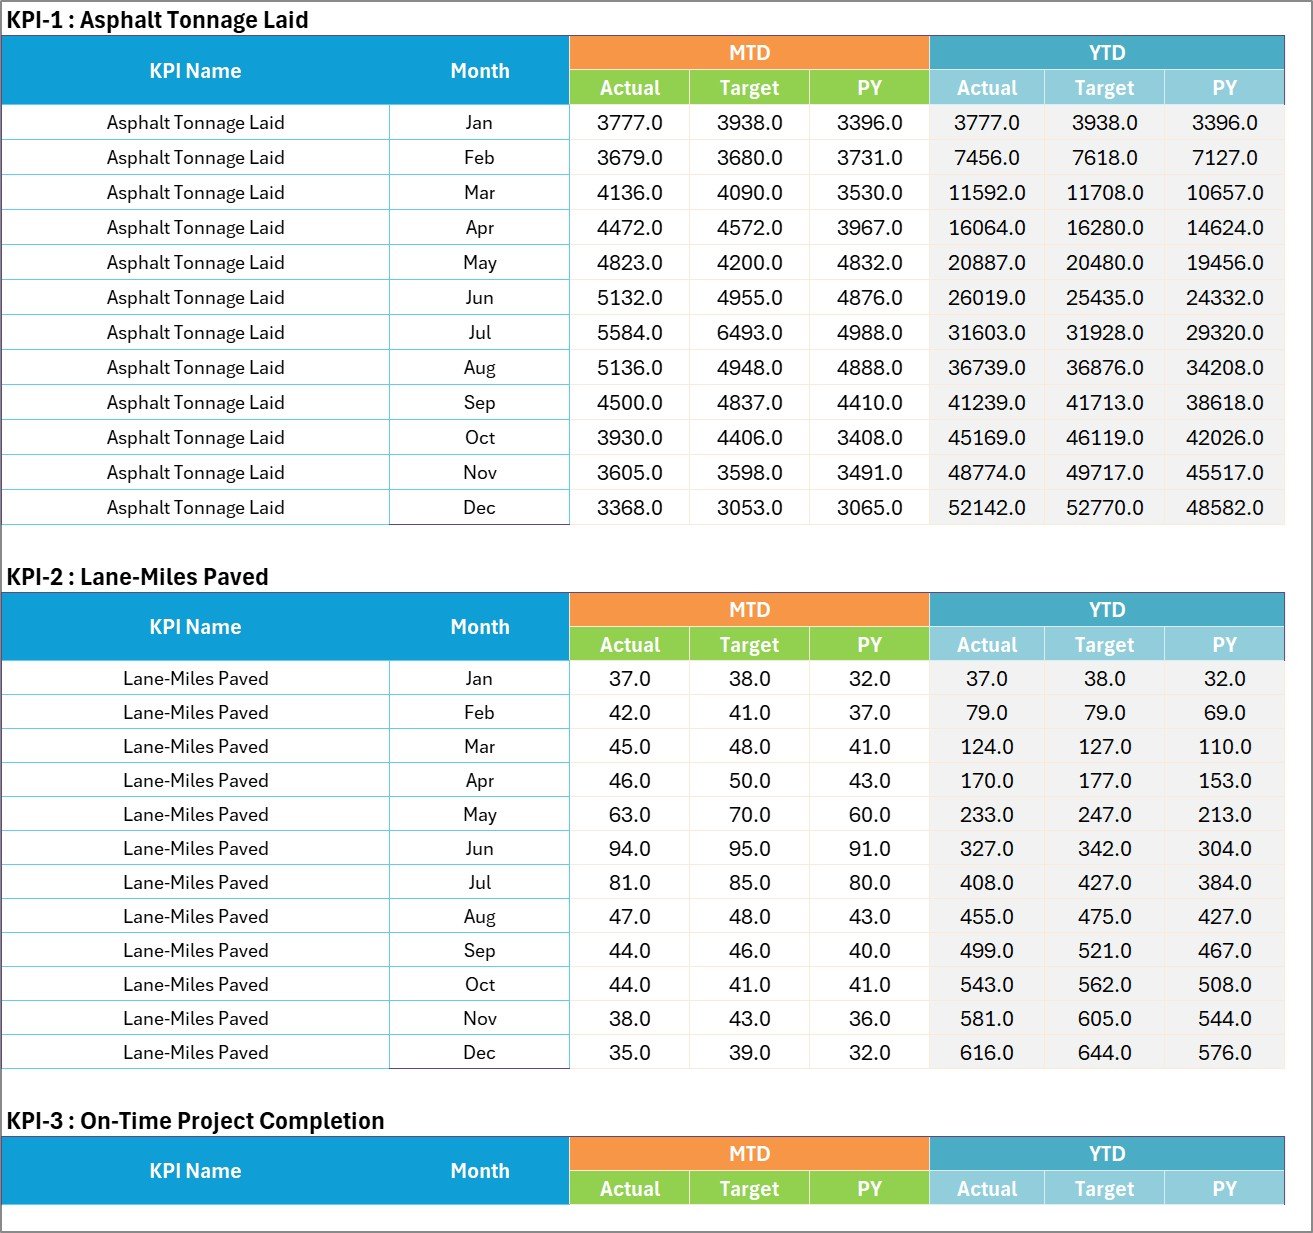
- Input Data – twenty numbered blocks, twelve months each, six figures per month: MTD Actual, Target and PY, then YTD Actual, Target and PY.
- KPI Definition – the master list: number, group, name, unit, formula, definition, type and YTD basis, with a Check column that flags duplicate names.
- Color Settings – the RAG bands, the report title and the reporting year.
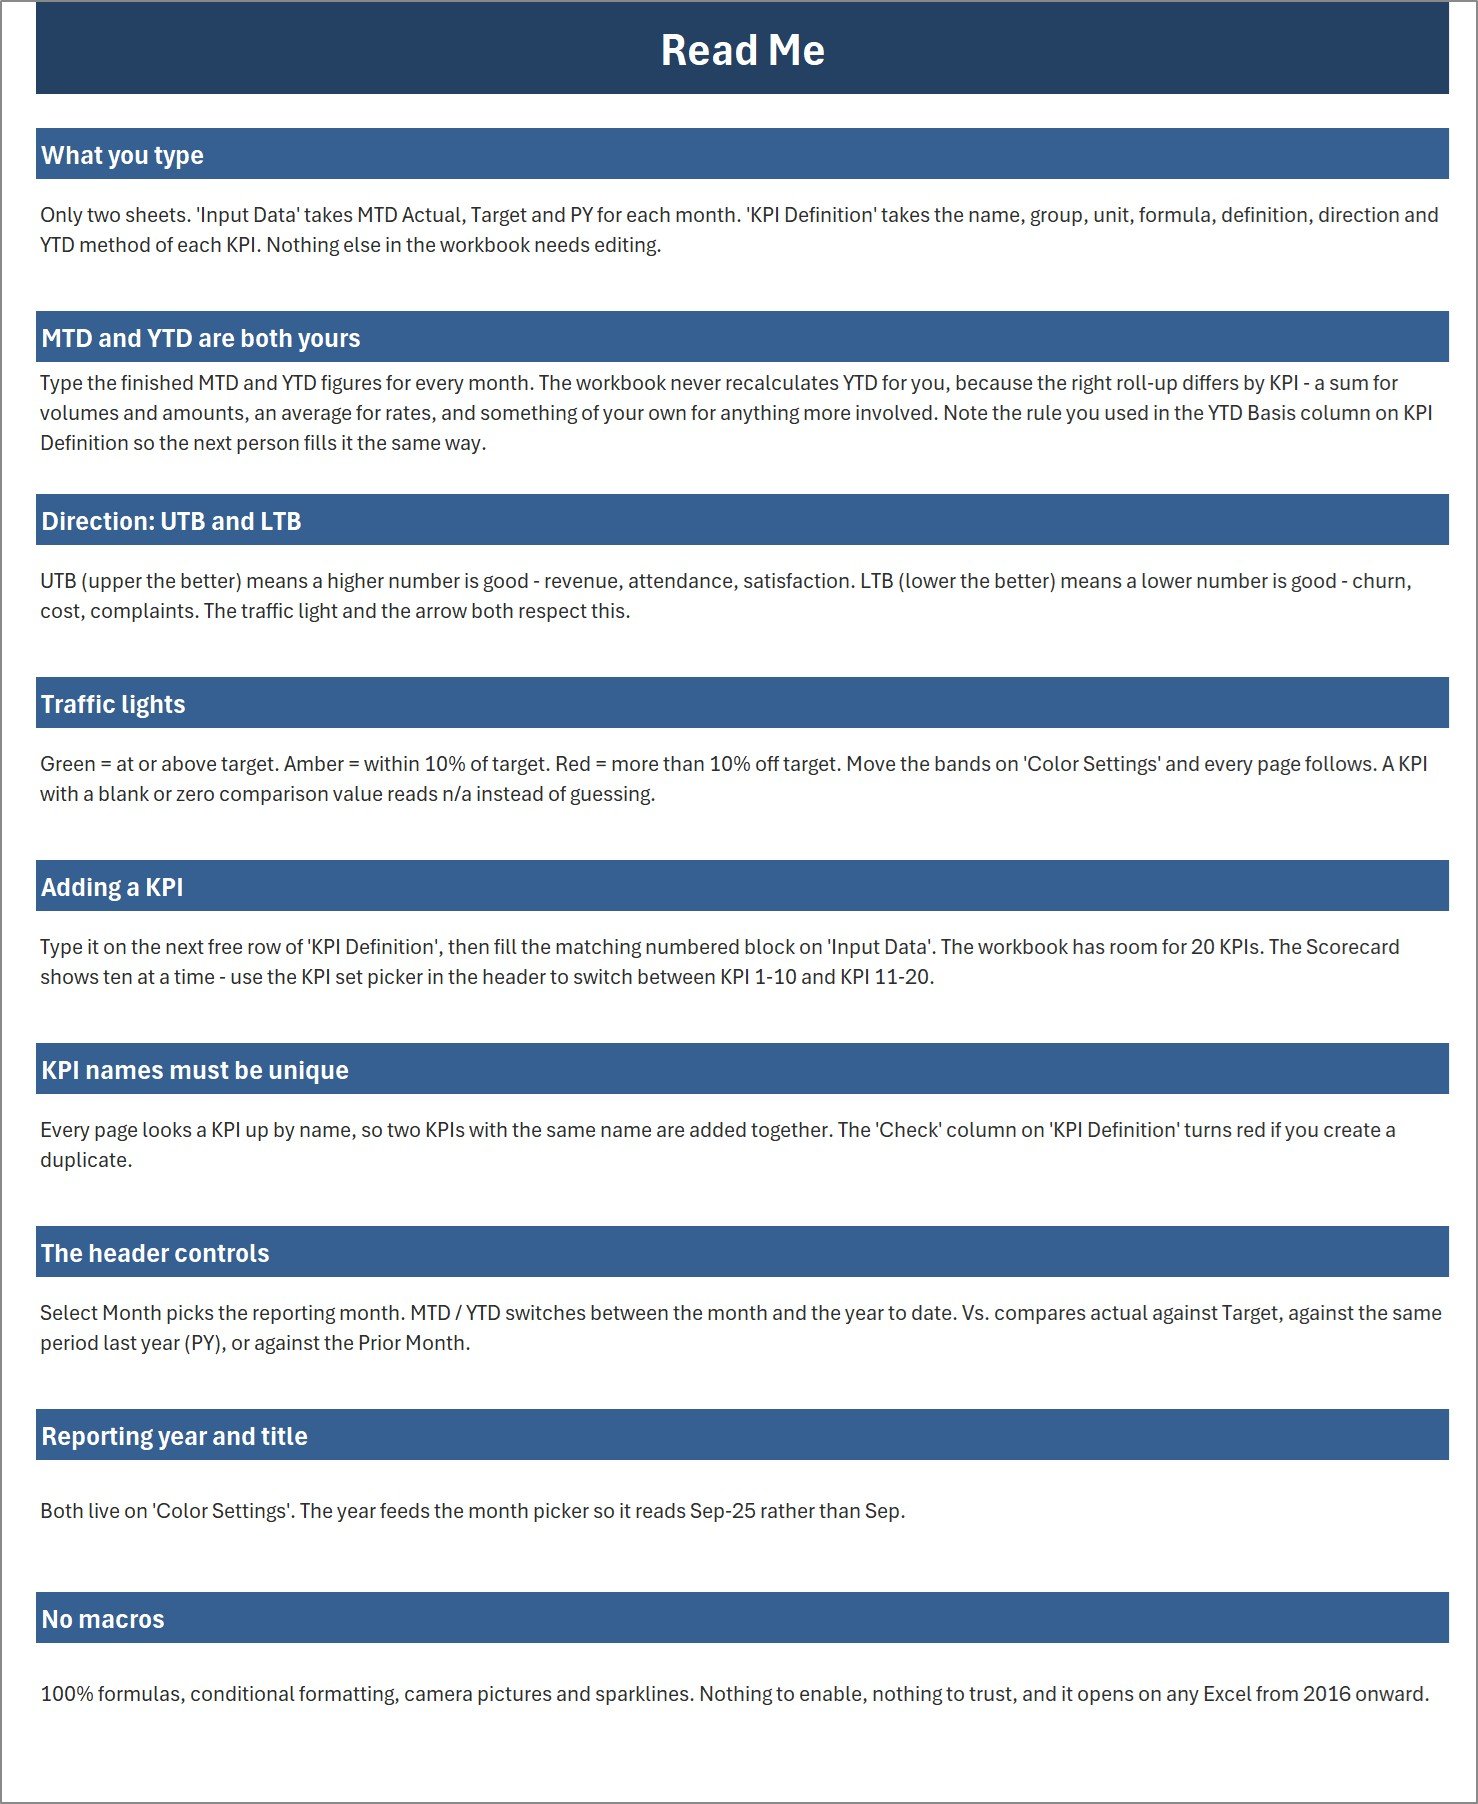
- Read Me and Get More Templates – how the workbook is wired, and where the rest of the catalogue lives.
Paving Contractor KPI Scorecard in Excel vs. Google Sheets vs. Paid Construction SaaS – Where This Fits
| This Excel scorecard | Google Sheets twin | Paid construction analytics (Procore Analytics, HCSS, Buildertrend reporting) | |
|---|---|---|---|
| Cost | One payment of $15.99, on offer at $9.99 | One payment | Commonly $200-$1,000+ per month, often with an implementation fee |
| Platform | Microsoft Excel 2016 or later, desktop | Google Sheets, browser | Vendor cloud, browser and app |
| Setup time | Under an hour: rename the KPIs, type twelve months of figures | Similar | Weeks – data mapping, project import, user onboarding |
| Real-time team collaboration | No – one file, shared the way you share any workbook | Yes | Yes |
| Mobile access | Excel mobile, read-only in practice | Yes | Yes |
| Customisable KPIs | Rename all twenty freely; nothing is hard-coded | Same | Limited to the vendor’s metric library |
| Share with a link | No – you send the file | Yes | Yes |
| Year-1 cost at 5 users | $15.99 total | One payment total | $2,400-$12,000+ |
| Pulls figures from your job-cost system | No – you type or paste the finished monthly figures | No | Yes, that is what you are paying for |
| Direction-aware traffic lights on rework and TRIR | Yes, UTB / LTB set per KPI | Yes | Varies by vendor |
The honest summary: if your KPIs already live inside a job-cost system and you want them refreshed automatically, buy the SaaS. If a person already assembles these numbers every month and the real problem is presenting them, this workbook solves that for the price of lunch. Prefer the browser? The Paving Contractor KPI Scorecard in Google Sheets is the same scorecard rebuilt for Google Sheets.
Who This Template Is For – and Who It’s Not For
It is for asphalt and concrete paving contractors, municipal road crews, parking-lot and driveway specialists, and the estimators or operations managers who already produce monthly numbers and need a board-ready page. It suits a company small enough that one person owns the reporting pack.
It is not for you if you want the workbook to calculate KPIs from raw job tickets – it holds no transaction records and no pivot tables. It is not a live integration with Procore, HCSS, Buildertrend or your accounting system. It is not a safety or OSHA recordkeeping system: Safety Incident Rate is a TRIR figure you calculate and type in, and this workbook is no substitute for an OSHA 300 log. And it does not roll year-to-date up for you – see the steps below.
How to Use the Paving Contractor KPI Scorecard in Excel
- Set the report title and reporting year on Color Settings. The year feeds the month picker, so it reads Jul-2025 rather than Jul.
- Edit KPI Definition. Rename any of the ten KPIs and change its group, unit, formula text, definition, type (UTB or LTB) and YTD basis. Renaming cascades through every page. Keep names unique – the Check column turns red if you duplicate one.
- Type your numbers on Input Data. For each numbered block, enter MTD Actual, Target and PY, then YTD Actual, Target and PY, for all twelve months. Paste as values, not formulas.
- Calculate YTD yourself. The workbook deliberately does not roll it up, because the right method differs per KPI – a sum for tonnage and lane-miles, an average for pass rates and margins. Record the rule you used in the YTD Basis column.
- Read the Scorecard. Pick the month, switch between MTD and YTD, and choose what you compare against. Everything recalculates instantly.
- Move the RAG bands on Color Settings if 10% is the wrong Amber width for your business.
Real-World Use Cases
Dave, owner of a 22-crew asphalt contractor. Tonnage and lane-miles already sit in his weekly production sheet, and margin comes from the accountant. He types twelve months in once, then updates one column each month and prints the Scorecard for the Monday partners’ meeting. In the sample month, four KPIs read green, four amber and two red – Asphalt Tonnage Laid at 86.0% of target and Bid Win Rate at 83.0%, which is exactly the conversation he wanted to force.
Priya, QC manager on a municipal paving programme. She watches three quality KPIs: compaction density pass rate, IRI smoothness compliance and rework rate. Rework is set to LTB, so a fall shows green, and the KPI Trend page puts twelve months of it against target and against last year on one screen.
Marcus, estimator at a parking-lot specialist. He renames four of the ten KPIs to the bidding metrics his firm actually tracks, leaves the rest, and opens the quarterly review with the Top 5 and Bottom 5 tables on KPI Analysis.
Frequently Asked Questions
Does this workbook calculate my KPIs from job data?
No. You calculate each KPI in your own working file and type or paste the finished monthly MTD and YTD figures into Input Data. The workbook holds no transaction records, no pivot tables and no Power Query.
Can I change the KPIs to my own?
Yes – all twenty slots. Type a new name on KPI Definition and it updates everywhere. Ten slots ship filled with paving metrics; the other ten sit empty and are ignored until you fill them.
Are there macros?
None. It is a .xlsx built from formulas, conditional formatting, camera pictures and sparklines. Nothing to enable and nothing to trust.
Which Excel versions does it open in?
Microsoft Excel 2016 or later, on Windows or Mac. It uses no add-ins and needs no internet connection.
Why doesn’t it work out year-to-date for me?
Because the correct roll-up differs by KPI. Tonnage and lane-miles are summed; pass rates, margins and TRIR are averaged or weighted. Rather than guess, the workbook asks you for the finished YTD figure and gives you a YTD Basis column to document the rule you used.
Is this an OSHA or safety compliance tool?
No. Safety Incident Rate is a reporting KPI – the recordable incident rate you already calculate. This is not an OSHA 300 log, an incident register or a safety management system.
What exactly do I download?
One ZIP containing the .xlsx workbook and a six-page Excel KPI Scorecard user manual PDF. Nothing else to install.
About the Author
Built by PK – Microsoft Certified Professional with 15+ years of Excel, Google Sheets, and Power BI experience. Founder of NextGenTemplates, reaching 300K+ subscribers across YouTube channels. Every template is hand-built and tested before release.
Explore Related Templates
- Paving Contractor KPI Scorecard in Google Sheets – the same scorecard for teams that live in the browser.
- Paving Contractor KPI Dashboard in Excel – the larger KPI Dashboard companion, a different template with a different page set.
- Masonry Contractor KPI Scorecard in Excel and Concrete Contractor KPI Scorecard in Excel – the same engine for neighbouring trades.
- Drywall Contractor KPI Scorecard in Excel – for subcontractor-heavy fit-out work.
- Browse every Excel KPI Dashboard and Scorecard, or the whole MS Excel catalogue.
Download the Paving Contractor KPI Scorecard in Excel today and have next month’s KPI page ready before the meeting starts. One payment, instant download, yours to edit forever.
Last updated: 1 September 2026.
Watch the demo video:
Compatibility and Requirements
- Works in Microsoft Excel desktop (Excel 2016 or later, or Microsoft 365), on Windows or Mac.
- The workbook is a .xlsx file with no macros, so there is nothing to enable. It needs no add-ins and no internet connection.
- The scorecard shows twelve-month sparklines and traffic-light colors from your RAG bands. Microsoft explains how this works in Use conditional formatting to highlight information in Excel.



































Reviews
There are no reviews yet.