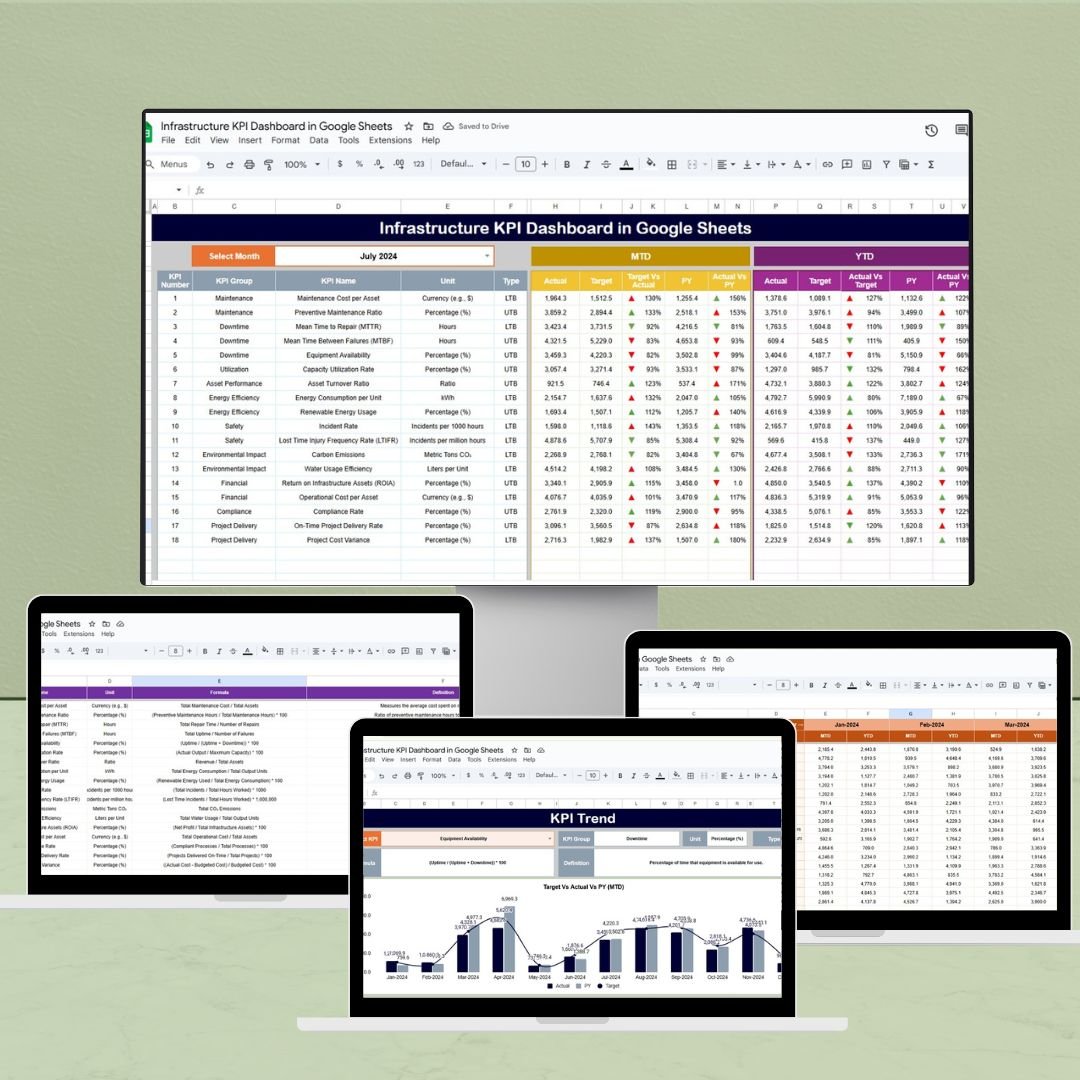
The Infrastructure KPI Dashboard in Google Sheets is a comprehensive and intuitive tool designed to help organizations monitor and optimize their infrastructure performance. Whether you’re managing IT systems, data centers, or network operations, this dashboard provides a centralized platform to track key performance indicators (KPIs) and make data-driven decisions.
Built within the versatile Google Sheets environment, this dashboard offers real-time data visualization, automated calculations, and customizable templates to suit your specific infrastructure needs.
Key Features:
-
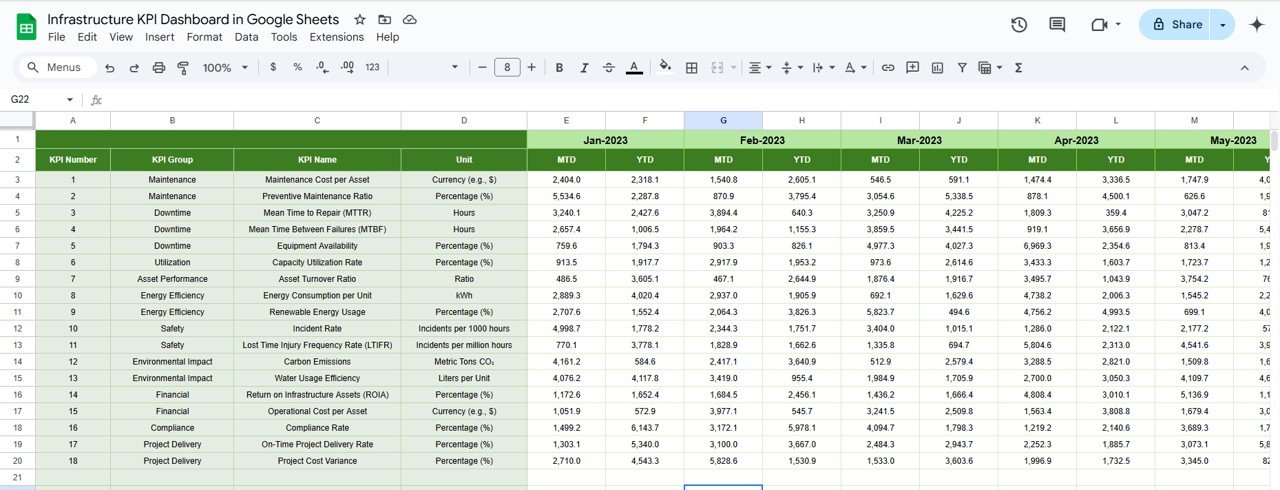
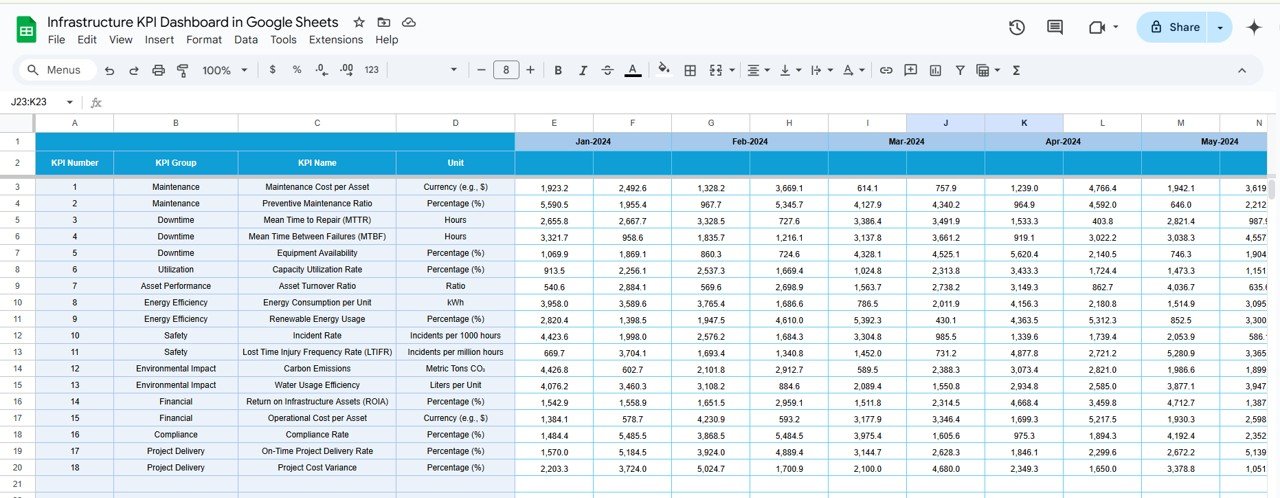
Real-Time Data Integration: Seamlessly integrate data from various sources to ensure up-to-date information at your fingertips.
-
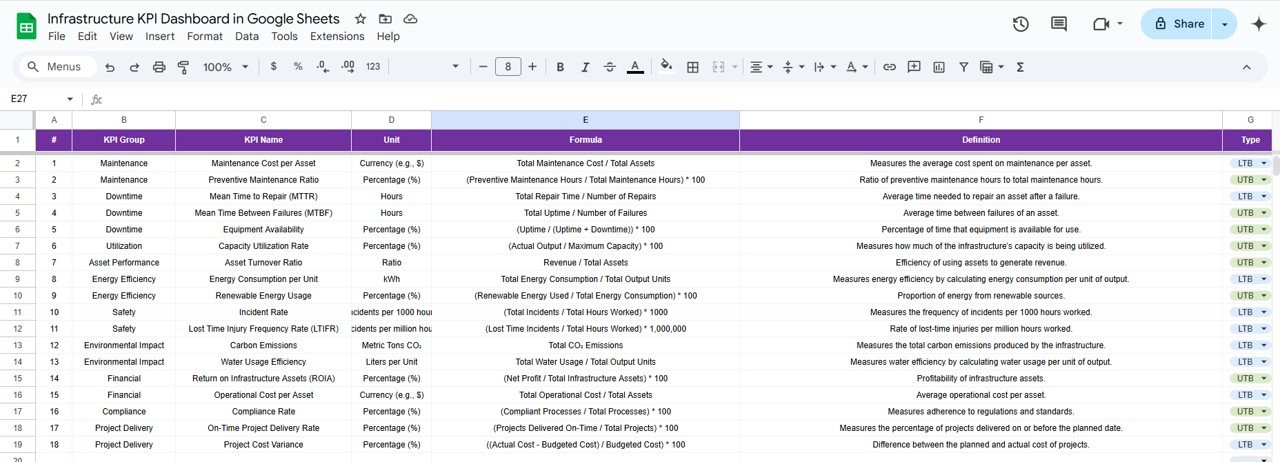
Customizable KPIs: Tailor the dashboard to track the metrics that matter most to your organization, such as uptime, latency, and throughput.
-
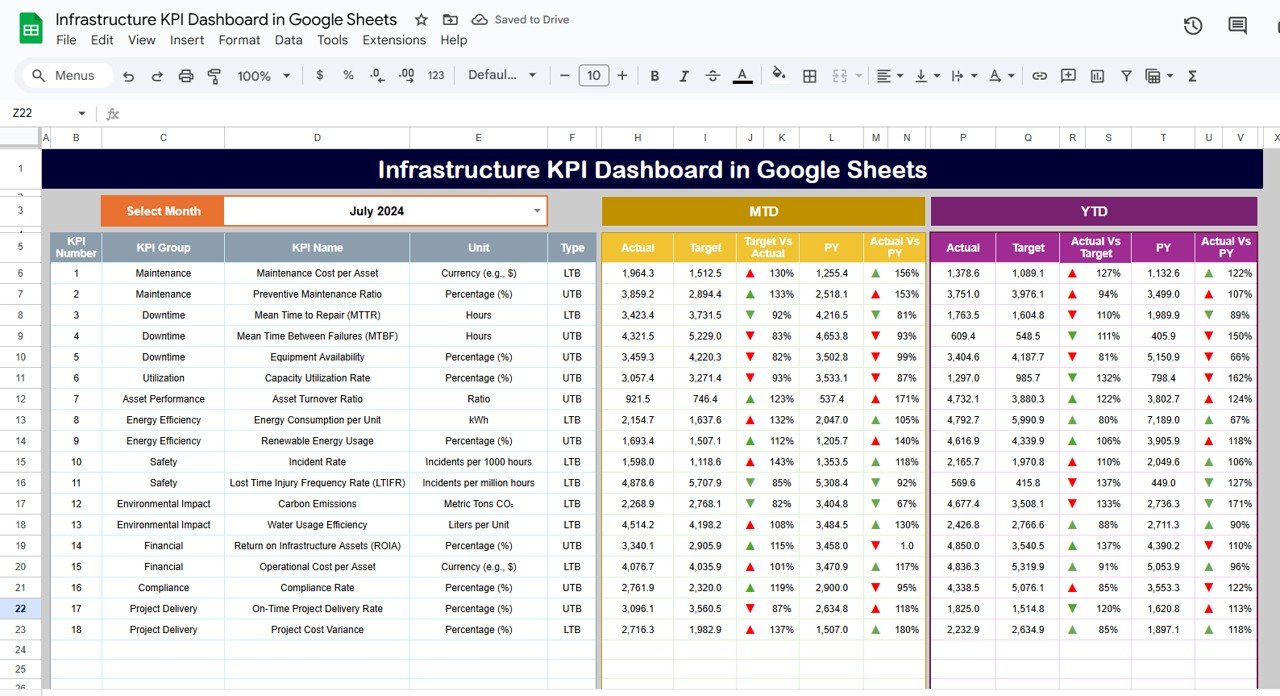
Automated Calculations: Utilize built-in formulas to automatically calculate averages, percentages, and trends, reducing manual effort and minimizing errors.
-
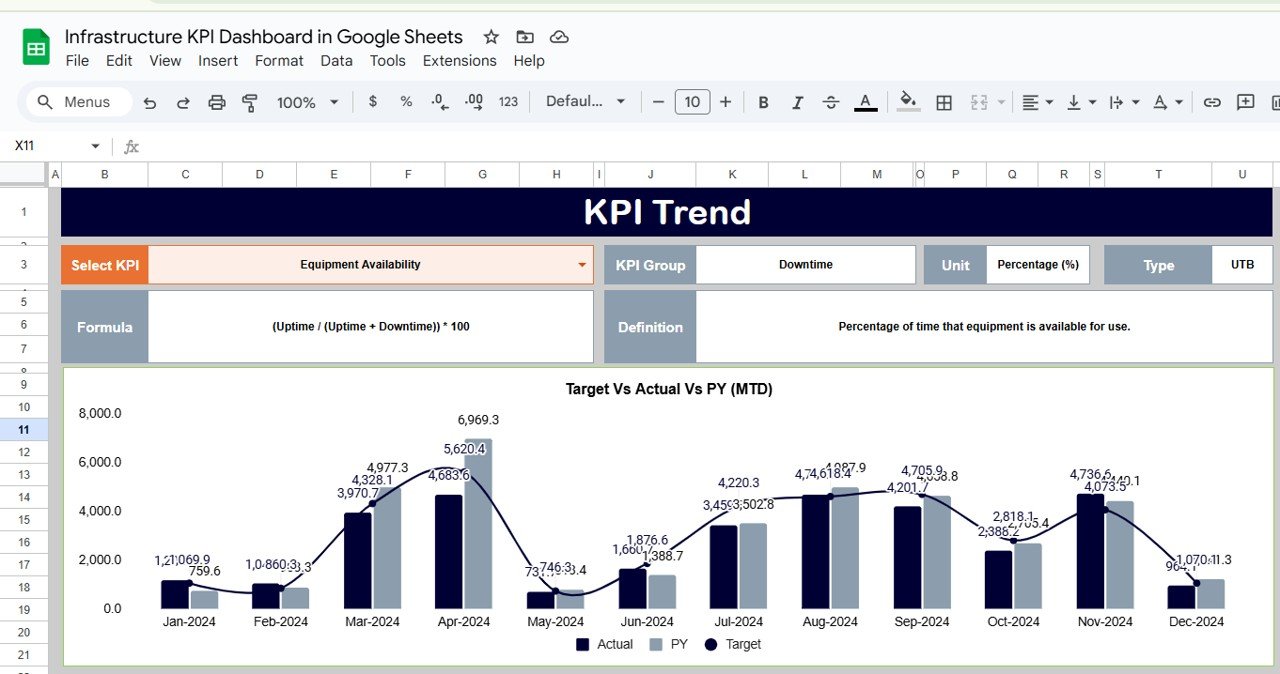
Visual Dashboards: Leverage charts and graphs to visualize performance trends, making it easier to identify areas for improvement.
-
User-Friendly Interface: Navigate through the dashboard with ease, thanks to its intuitive design and clear layout.
Benefits:
-
Enhanced Decision-Making: Access to real-time data and visual insights empowers stakeholders to make informed decisions promptly.
-
Improved Efficiency: Automated processes and centralized data reduce the time spent on manual reporting and analysis.
-
Scalability: As your infrastructure grows, the dashboard can be easily updated to accommodate new KPIs and data sources.
-
Cost-Effective: Utilize the free and widely accessible Google Sheets platform, eliminating the need for expensive software solutions.
How to Use:
-
Download the Template: Access the Google Sheets template provided.
-
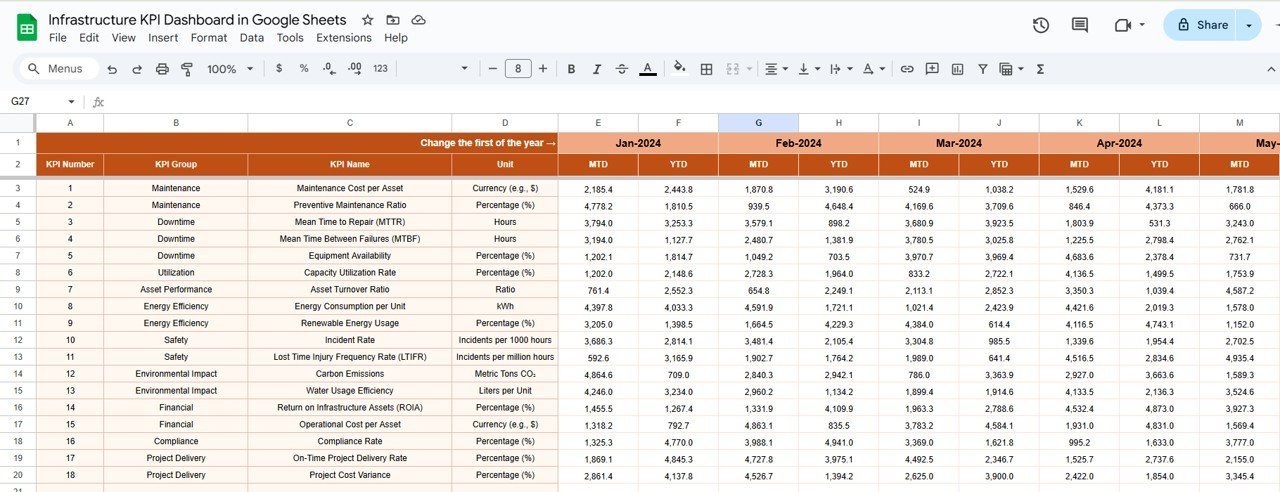
Input Data: Enter your infrastructure data into the designated fields.
-
Customize KPIs: Adjust the dashboard to reflect the KPIs relevant to your operations.
-
Analyze Trends: Use the visual tools to identify performance trends and areas needing attention.
-
Make Informed Decisions: Leverage the insights gained to optimize your infrastructure performance.
Who Can Benefit:
-
IT Managers: Oversee and optimize IT infrastructure performance.
-
Network Administrators: Monitor and manage network operations effectively.
-
Data Center Operators: Ensure data center efficiency and uptime.
-
Business Analysts: Analyze infrastructure data to support strategic decision-making.
By implementing the Infrastructure KPI Dashboard in Google Sheets, organizations can gain a comprehensive view of their infrastructure performance, leading to more informed decisions and improved operational efficiency.
Click here to read the Detailed blog post
Visit our YouTube channel to learn step-by-step video tutorials
Youtube.com/@PKAnExcelExpert


Reviews
There are no reviews yet.