

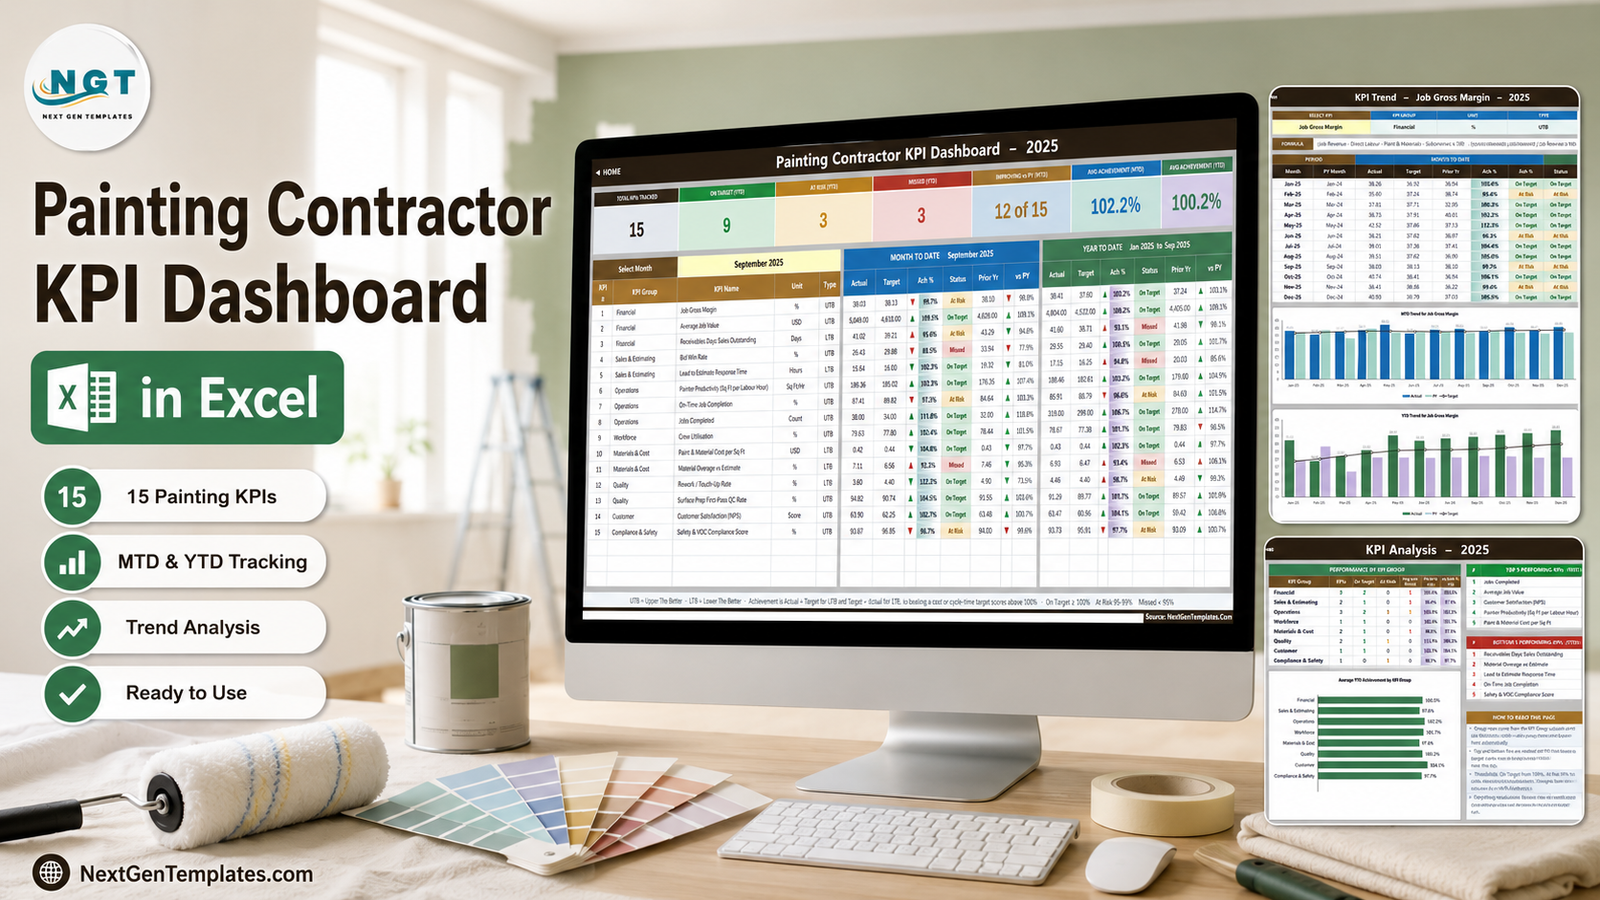


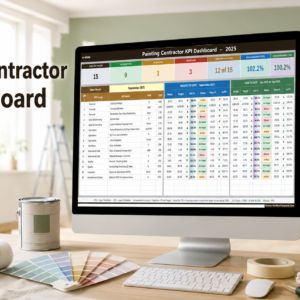
The Painting Contractor KPI Dashboard in Excel puts 15 painting KPIs, grouped into eight areas, on one scorecard that answers a single question every month: are we making money on the work we just finished? Pick a month from one dropdown and the whole file re-reads — month-to-date and year-to-date actual, target, achievement percentage, traffic-light status and last year’s number for every KPI, from Job Gross Margin down to Safety & VOC Compliance Score. It is a plain .xlsx with no macros, no Power Query, no data model and no add-ins, it opens in Excel 2013 and later and in Excel for the web, and it arrives fully populated with a twelve-month 2025 sample so you can see it working before you type anything. Nothing is locked, nothing is hidden, and every number on every page is an ordinary worksheet formula you can click into and trace. Instant download, lifetime access to the file you buy.
Key Features of the Painting Contractor KPI Dashboard in Excel
- 15 painting KPIs in 8 groups — Financial, Sales & Estimating, Operations, Workforce, Materials & Cost, Quality, Customer, and Compliance & Safety.
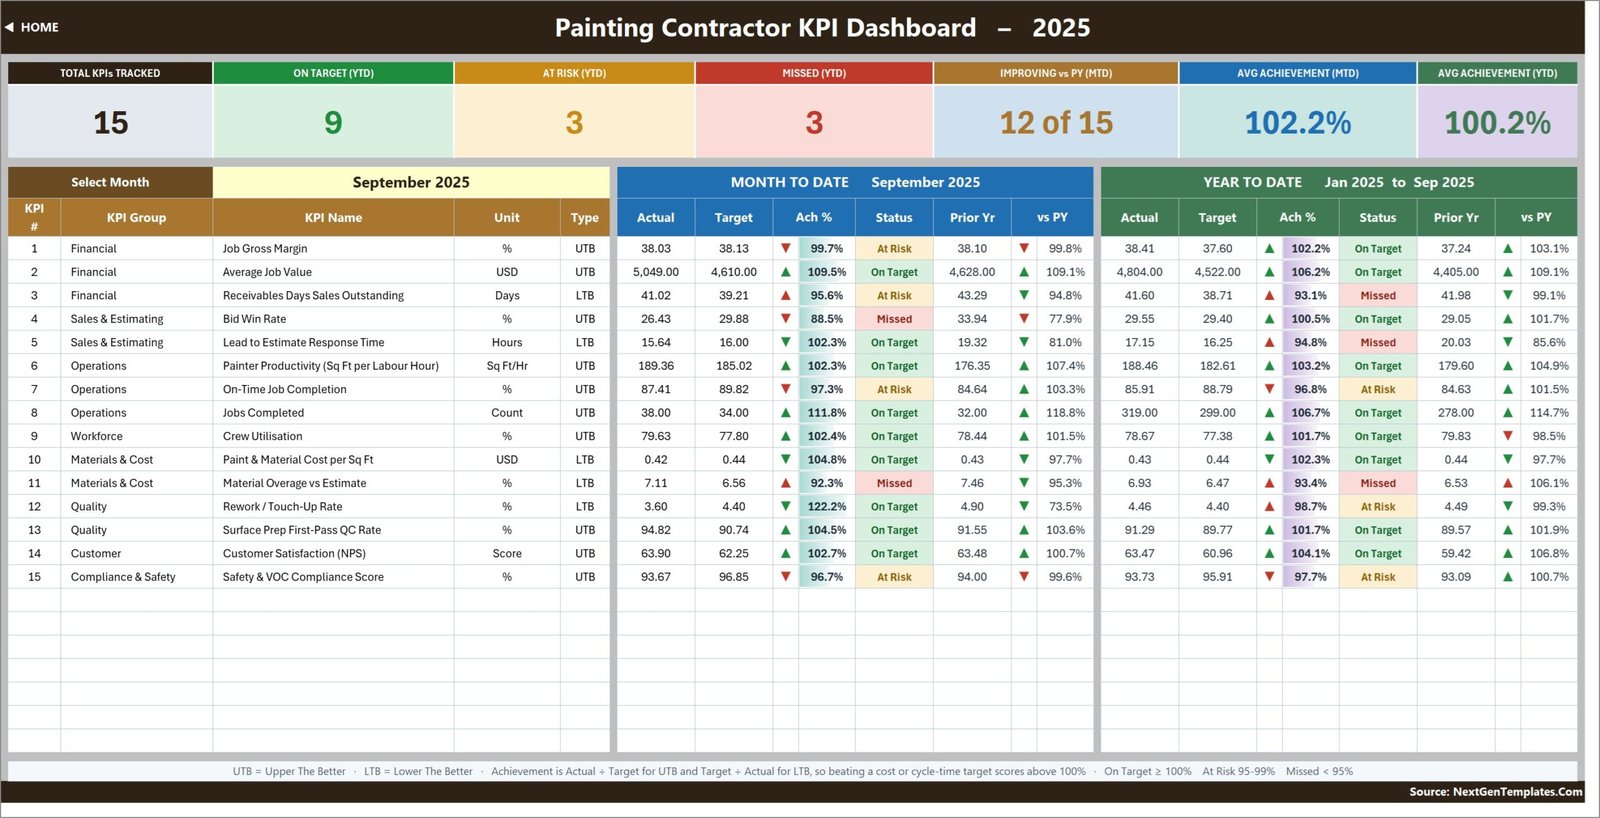
- One month dropdown drives everything — cell D6 on KPI Dashboard sets the month, and the scorecard, the seven summary cards and the whole KPI Analysis page follow it. There is no refresh step and no query to run.
- MTD and YTD side by side — each KPI row carries actual, target, achievement, status, prior year and a year-on-year percentage for both periods, so a good month inside a bad year has nowhere to hide.
- Direction-aware scoring — every KPI is flagged UTB (upper the better) or LTB (lower the better). Achievement is Actual ÷ Target for UTB and Target ÷ Actual for LTB, so cutting Receivables Days Sales Outstanding or Paint & Material Cost per Sq Ft scores above 100% instead of looking like a miss.
- Editable traffic lights — On Target from 100%, At Risk 95–99%, Missed below 95%. The cut-offs live in the formulas in columns L and U on KPI Dashboard, so you can move them to match your own governance.
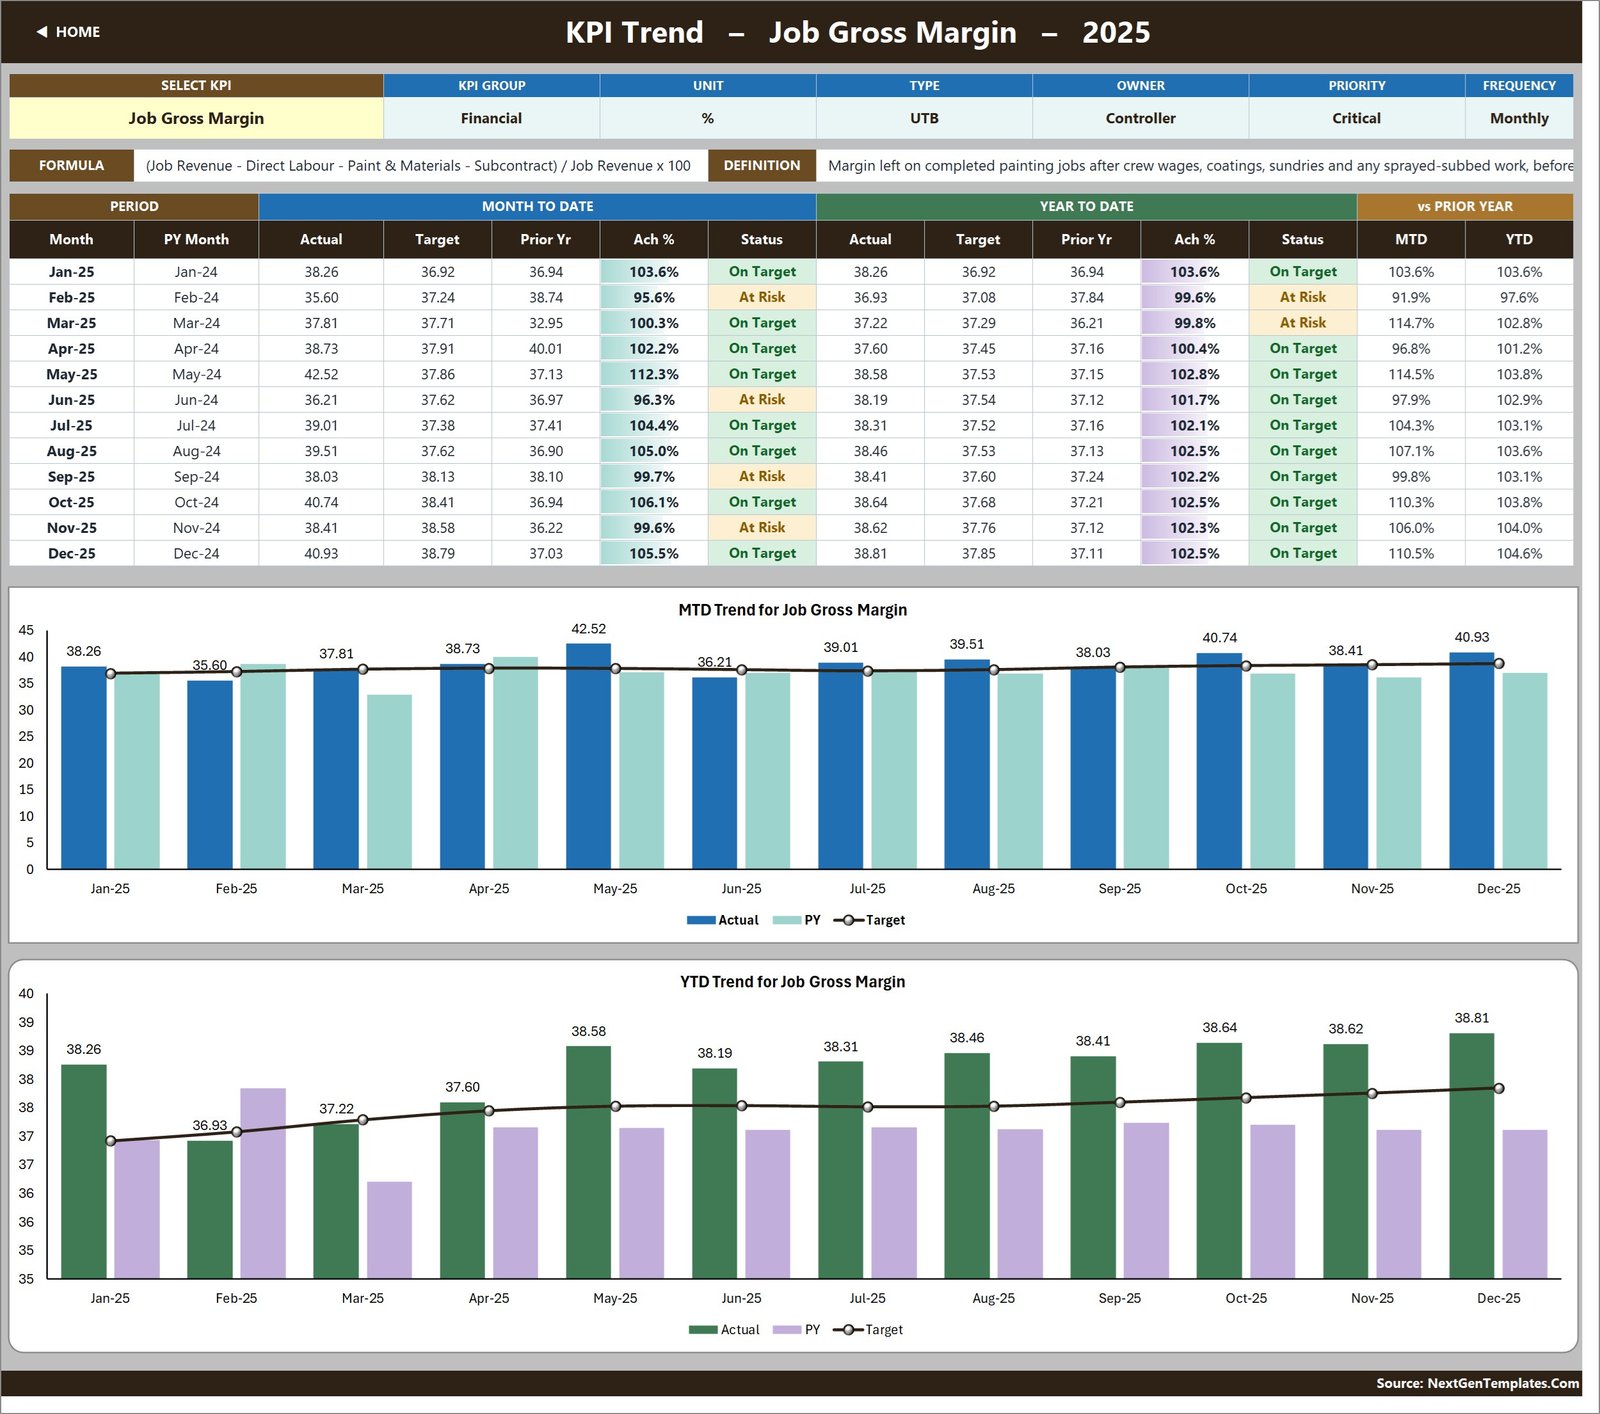
- KPI Trend page — choose any KPI and its attribute strip, formula, definition, twelve-month table and two combo charts redraw around it.
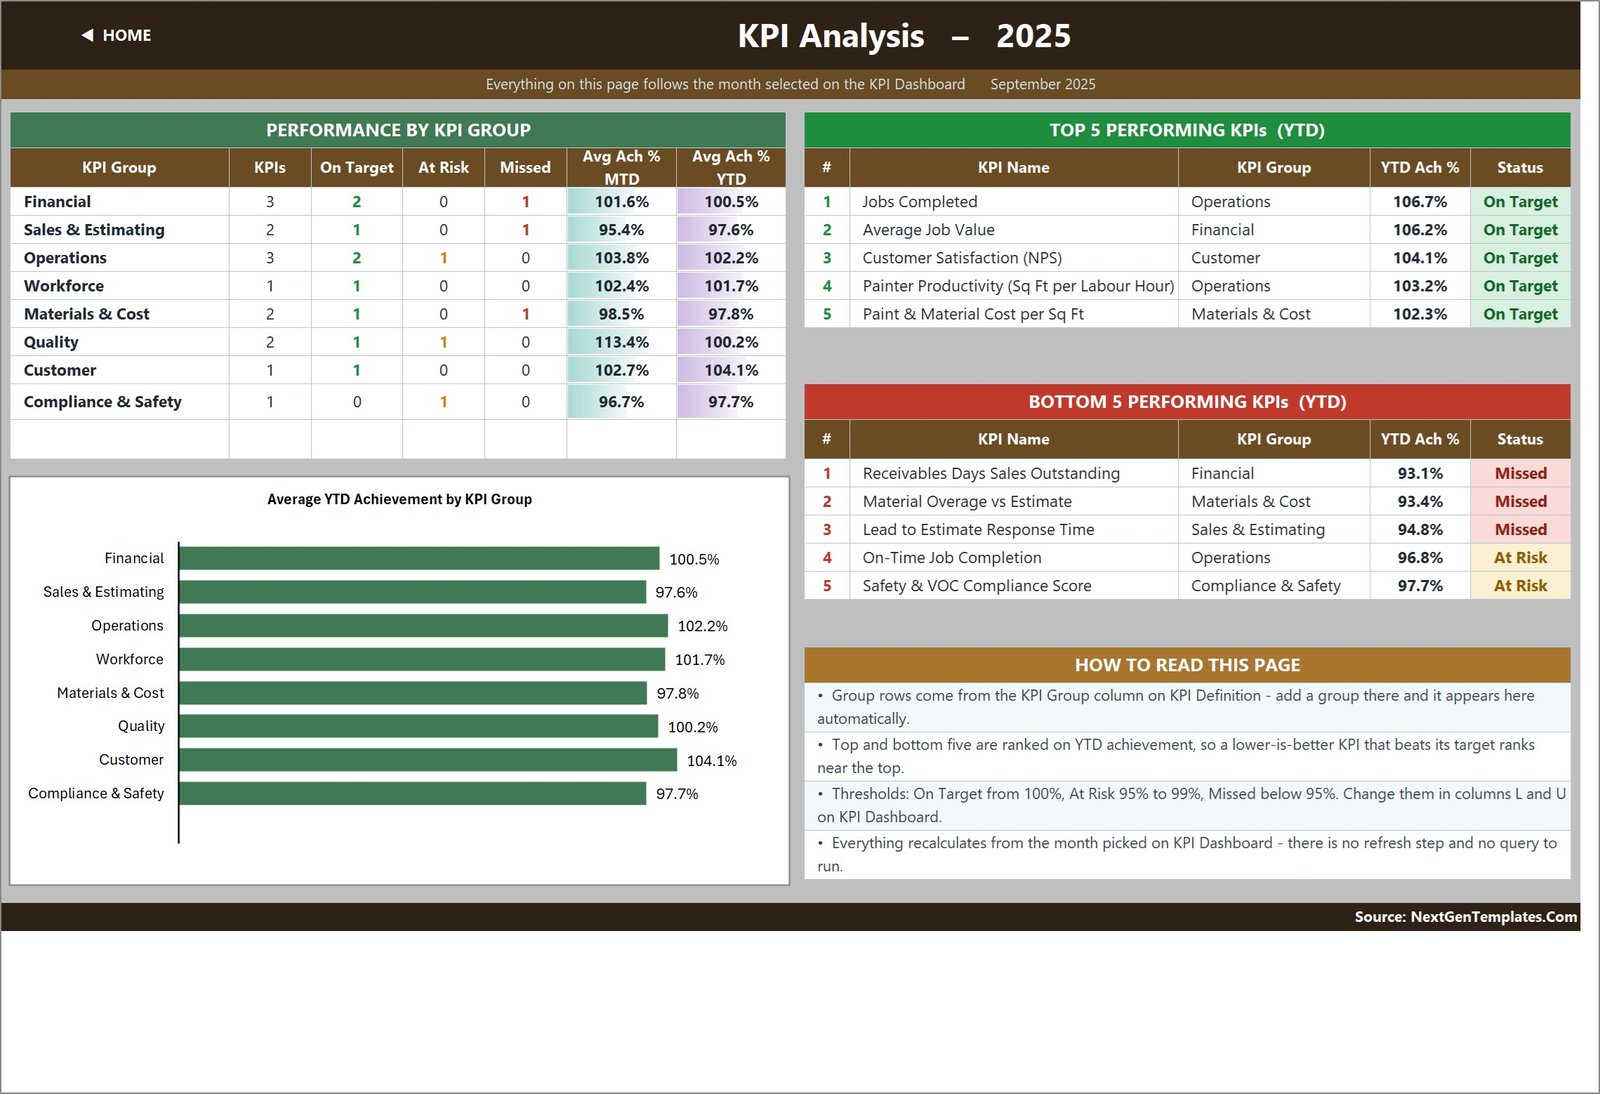
- KPI Analysis page — achievement rolled up by KPI group with a bar chart, plus the top five and bottom five KPIs for the year to date.
- Add or rename KPIs by typing — the sheets are wired for 22 KPI rows, so a new KPI is one line on KPI Definition and no formula work at all.
- Re-base the whole year in one cell — cell E3 on KPI Input – Actual is the first month of the reporting year; change it and the target sheet, the prior-year sheet, the month dropdown and every sheet title follow.
- Sample 2025 data included — twelve months of actuals, targets and prior-year figures across all 15 KPIs.
What’s Inside the Painting Contractor KPI Dashboard in Excel
Ten sheets, in the order the Home page lists them.
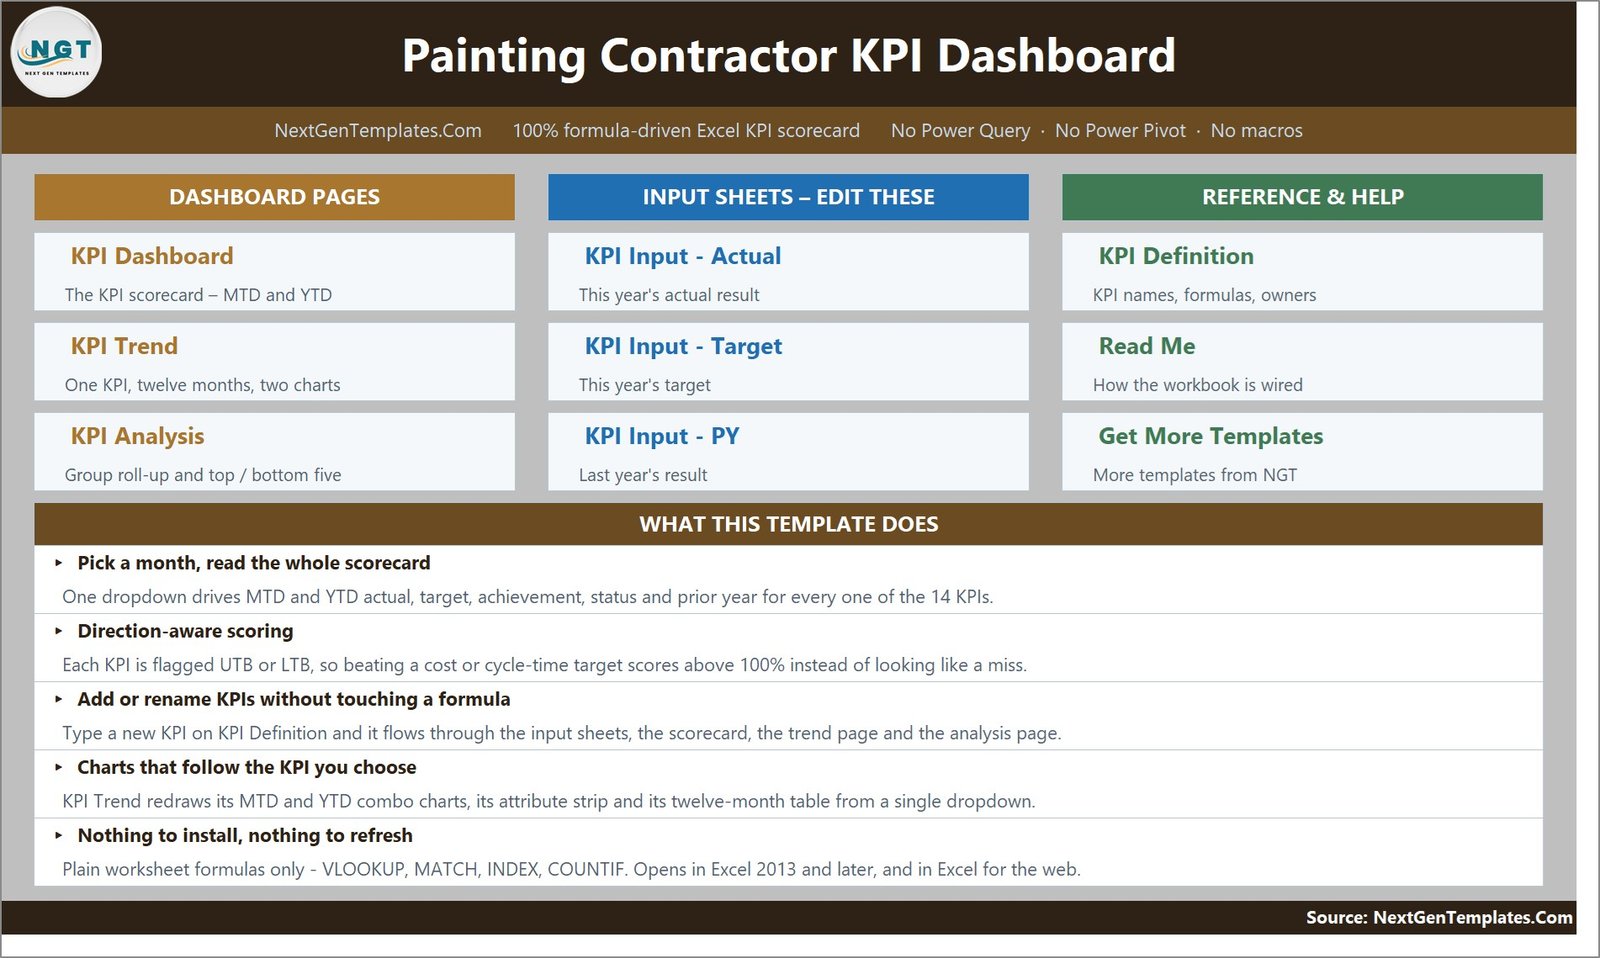
- Home — a navigation page split into Dashboard Pages, Input Sheets and Reference & Help, with a short summary of what the workbook does.
- KPI Dashboard — the scorecard. Seven summary cards across the top (Total KPIs Tracked, On Target YTD, At Risk YTD, Missed YTD, Improving vs PY MTD, Avg Achievement MTD, Avg Achievement YTD), then one row per KPI with the full MTD and YTD blocks.
- KPI Trend — one KPI at a time. In the shipped sample it opens on Job Gross Margin, owned by the Controller, priority Critical, reported monthly, with the formula and definition printed above a twelve-month table and MTD and YTD combo charts that carry actual and prior-year columns against a target line.
- KPI Analysis — Performance by KPI Group with KPI counts and status counts per group, an Average YTD Achievement by KPI Group bar chart, Top 5 and Bottom 5 Performing KPIs, and a How To Read This Page panel.
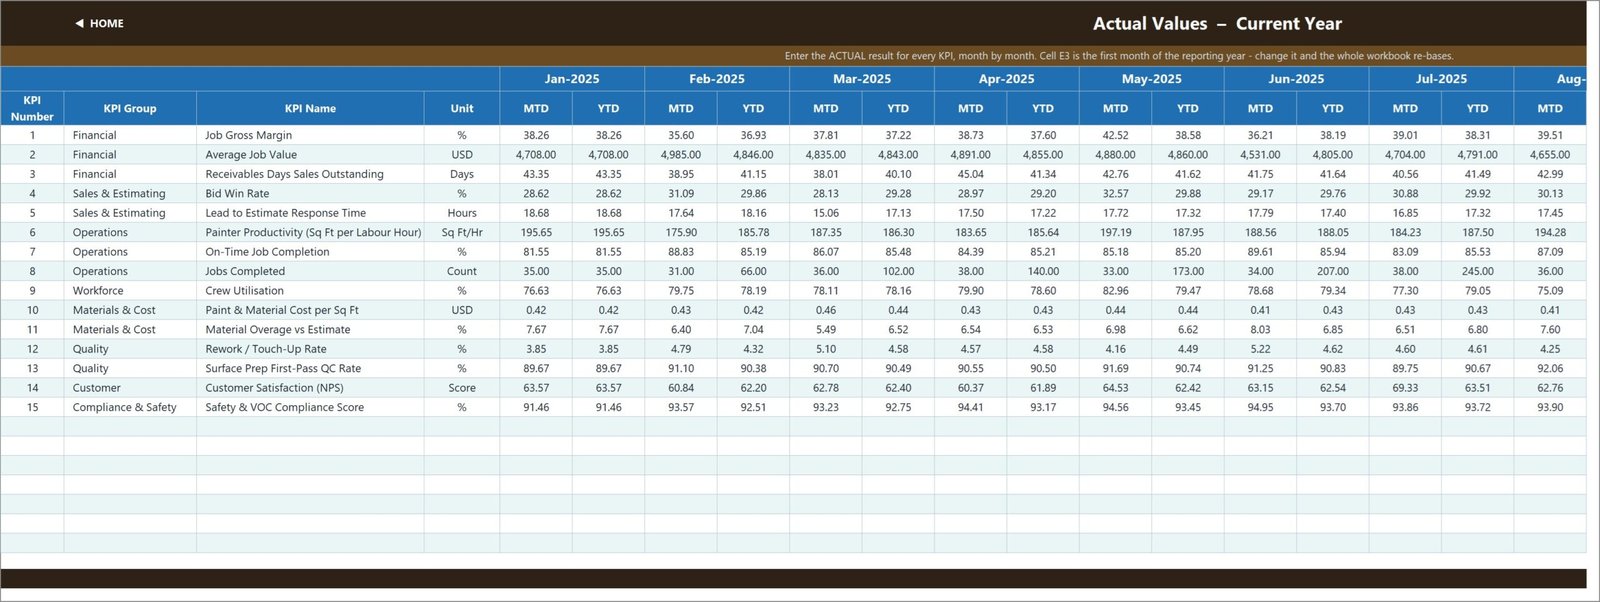
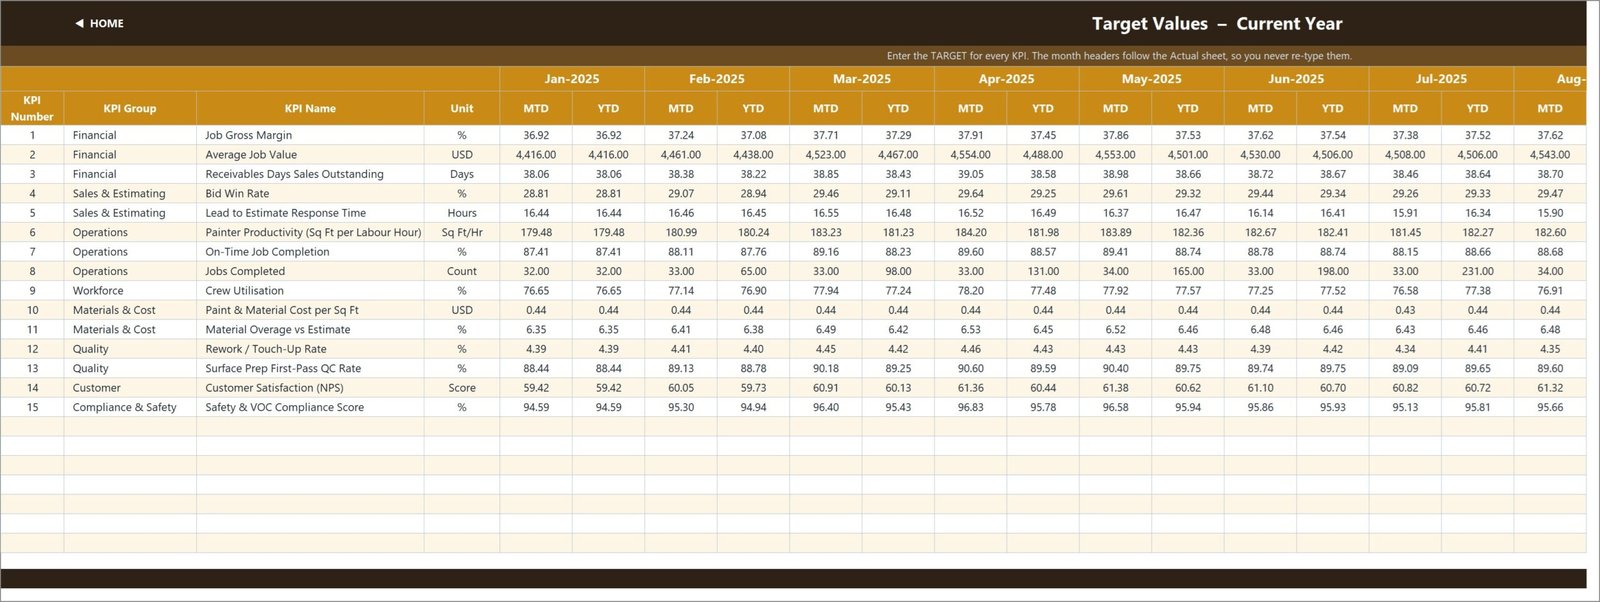
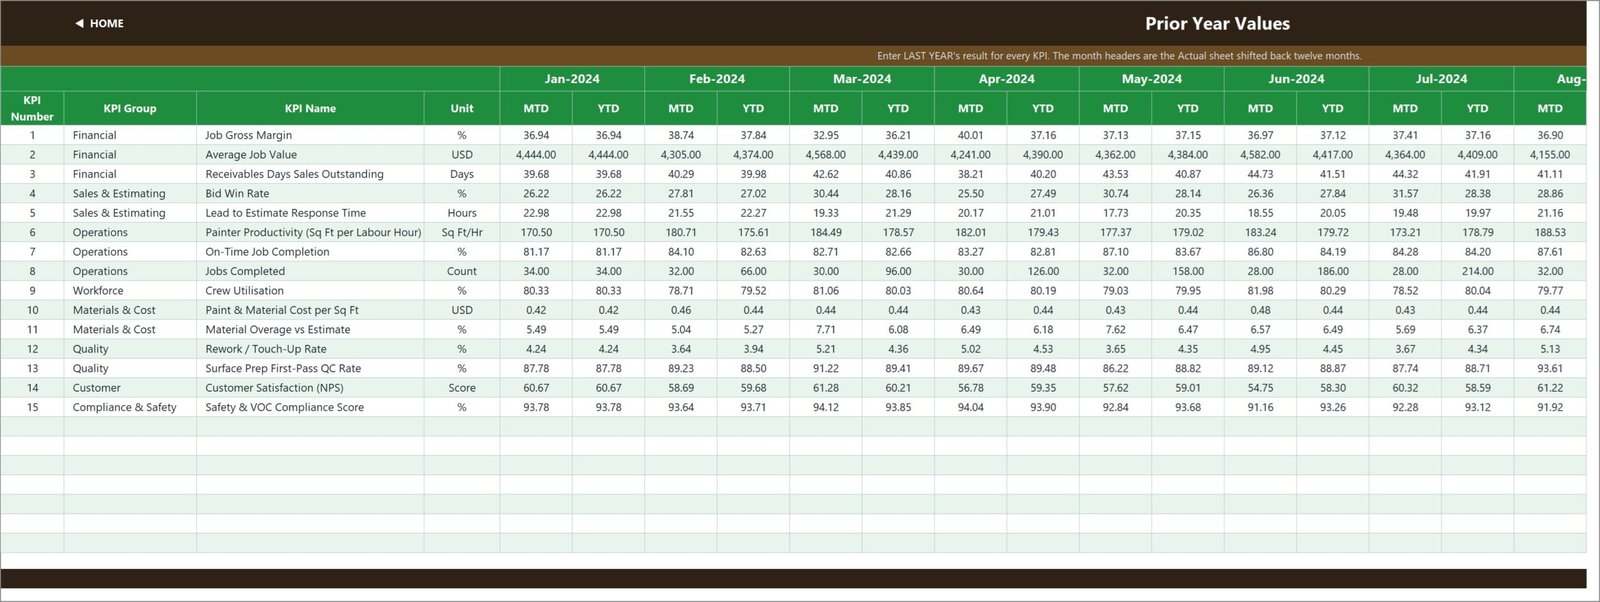
- KPI Input – Actual, KPI Input – Target, KPI Input – PY — the three sheets you type in. Each holds an MTD and a YTD column for every month, and all three read their KPI rows from KPI Definition so they always line up.
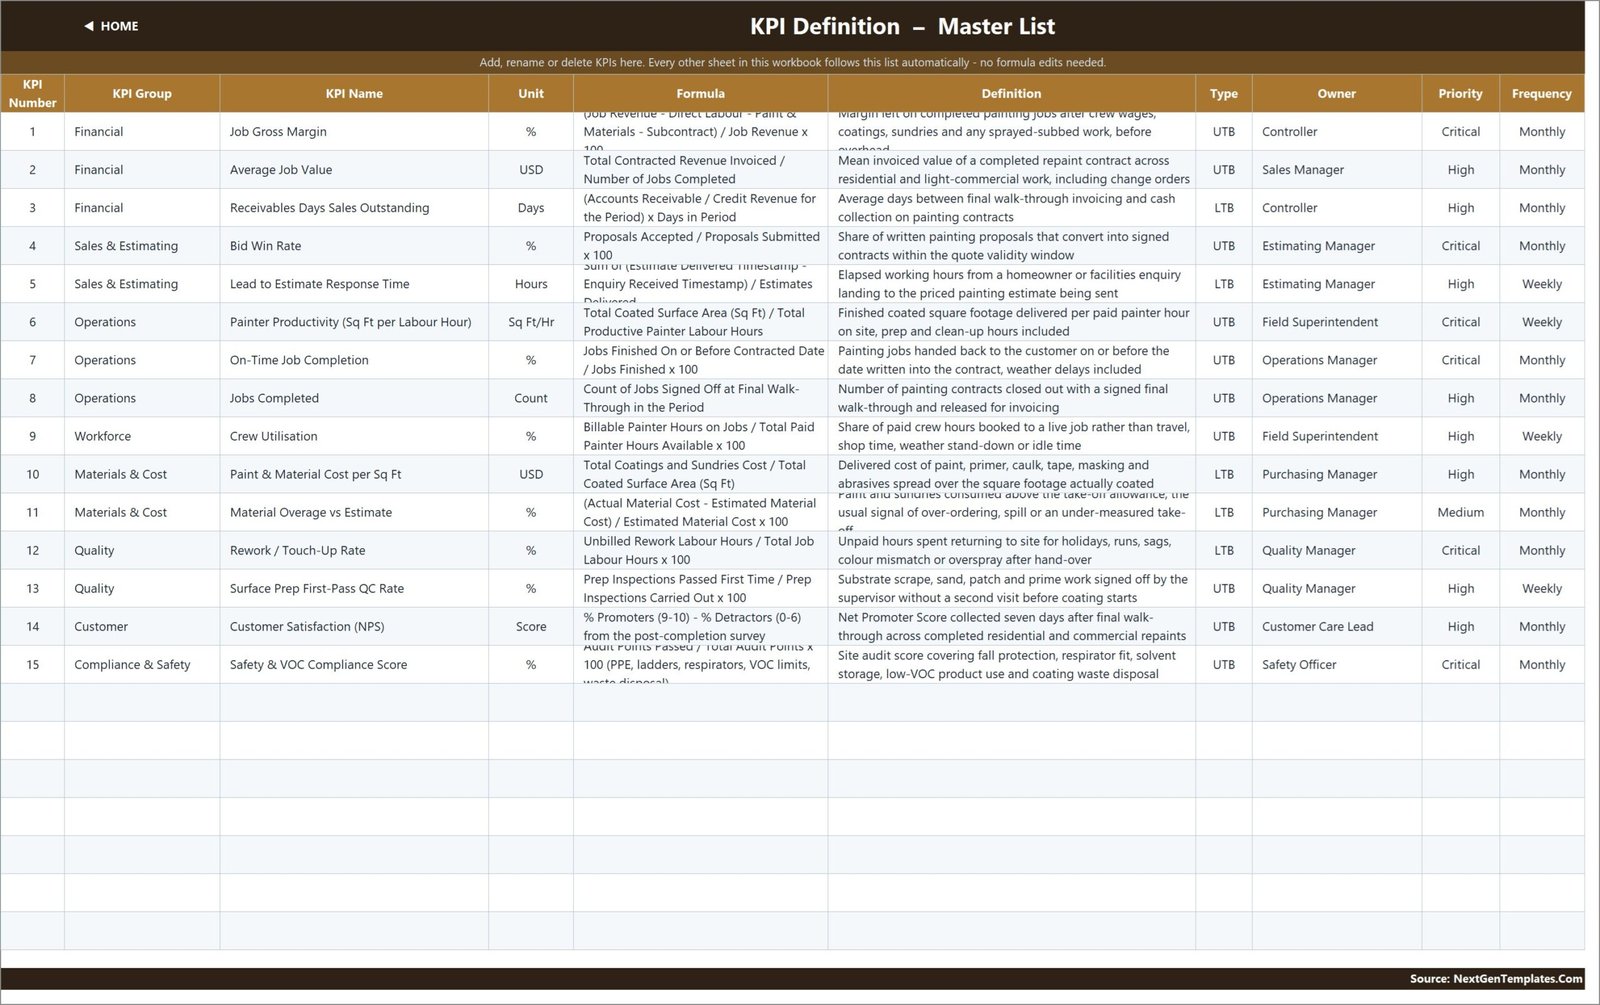
- KPI Definition — the master list: number, group, name, unit, formula, definition, type, owner, priority and frequency for all 15 KPIs.
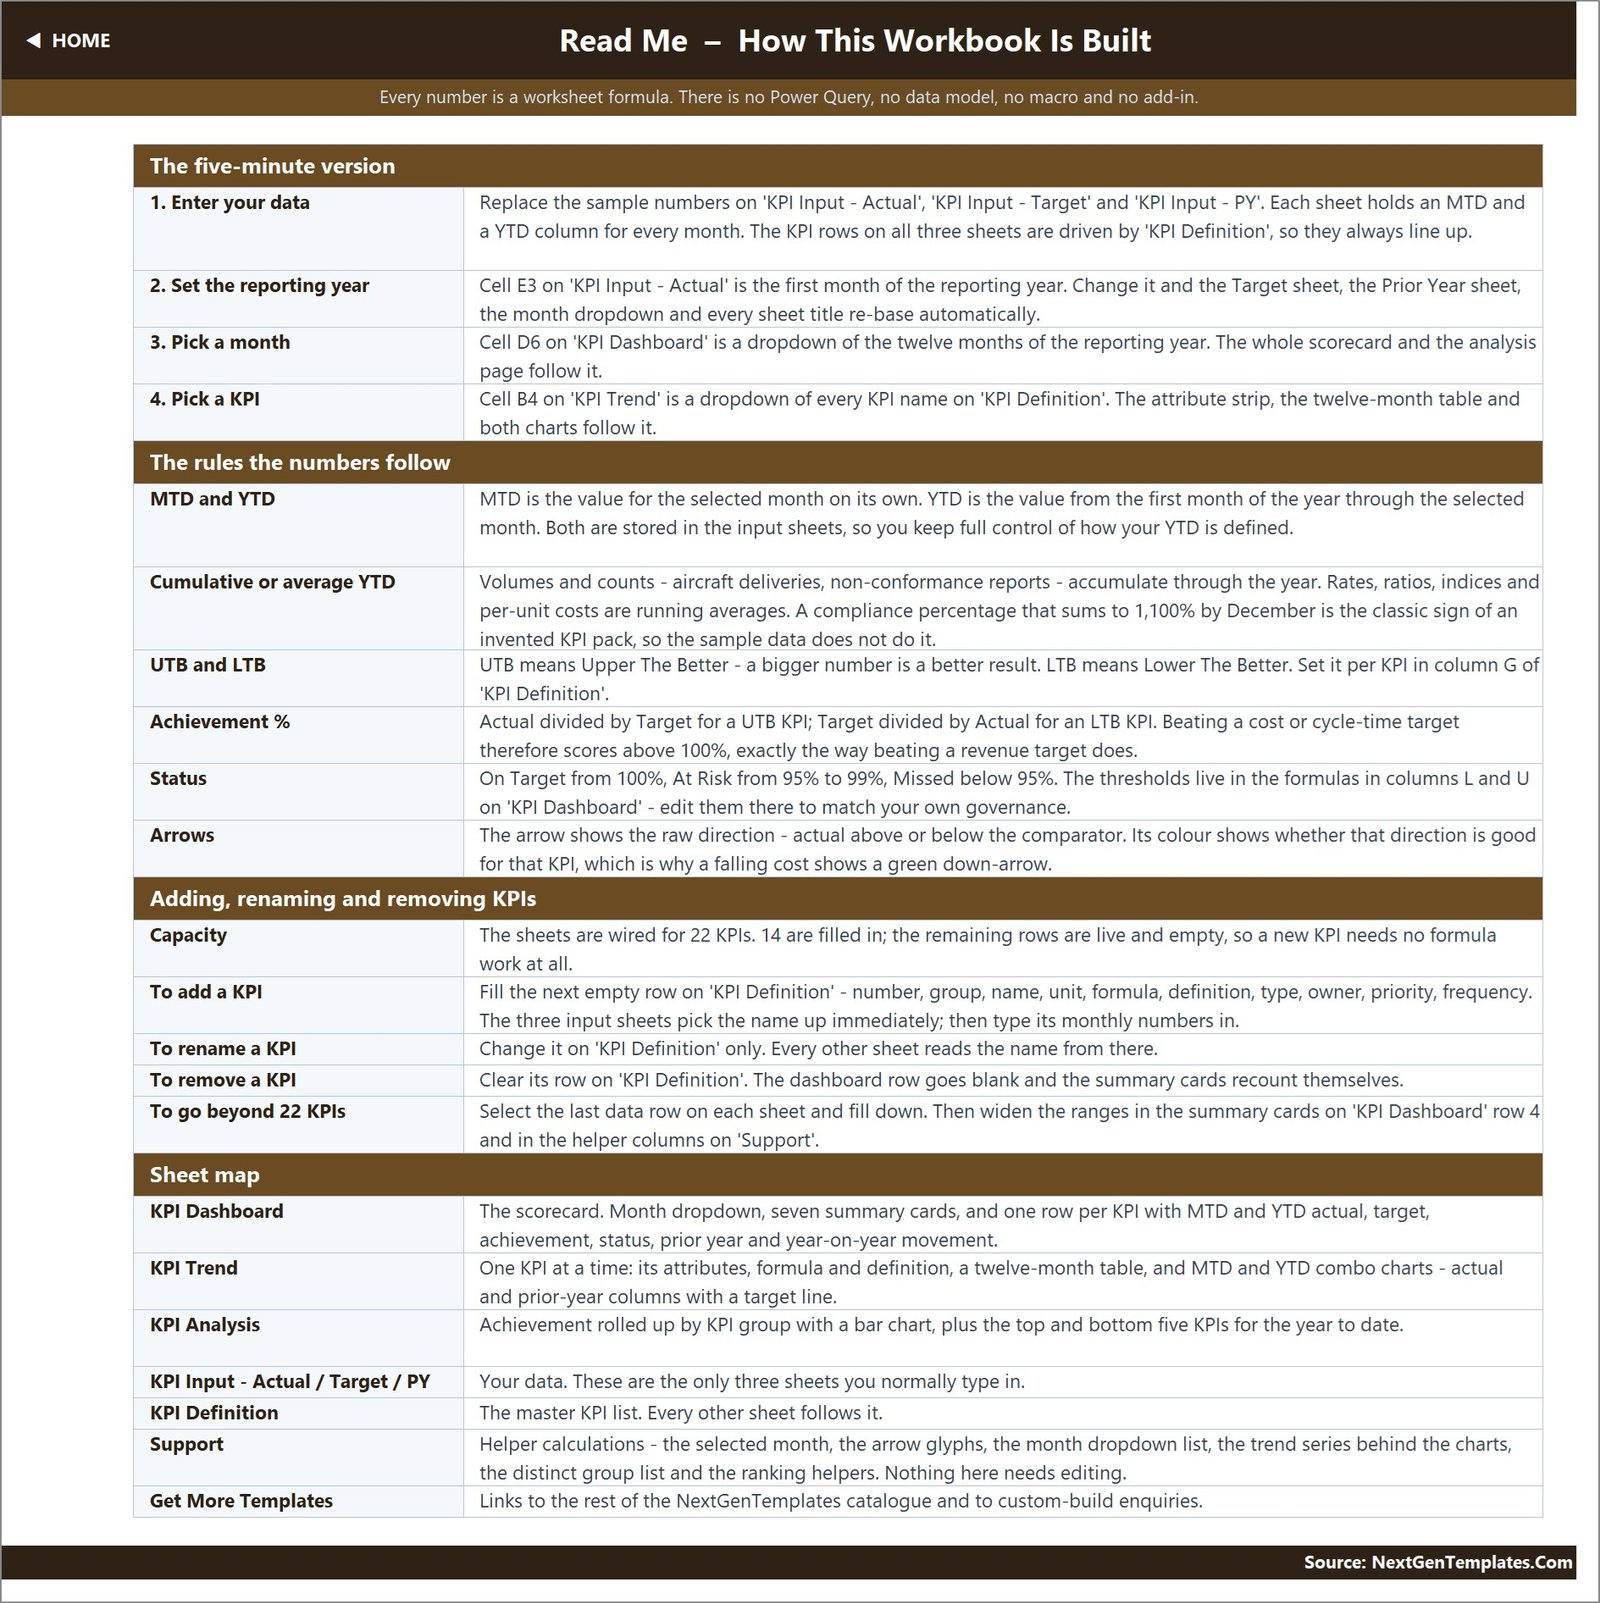
- Read Me — how the workbook is wired, in one page.
- Get More Templates — links back to the rest of the catalogue.
The 15 Painting KPIs You Get
Financial: Job Gross Margin, Average Job Value, Receivables Days Sales Outstanding. Sales & Estimating: Bid Win Rate, Lead to Estimate Response Time. Operations: Painter Productivity (Sq Ft per Labour Hour), On-Time Job Completion, Jobs Completed. Workforce: Crew Utilisation. Materials & Cost: Paint & Material Cost per Sq Ft, Material Overage vs Estimate. Quality: Rework / Touch-Up Rate, Surface Prep First-Pass QC Rate. Customer: Customer Satisfaction (NPS). Compliance & Safety: Safety & VOC Compliance Score. Each one ships with its own formula, a plain-English definition and a named owner — Controller, Sales Manager, Estimating Manager, Field Superintendent, Operations Manager, Purchasing Manager, Quality Manager, Customer Care Lead or Safety Officer — so the monthly review has a name against every red cell.
Excel vs. Google Sheets vs. Paid Field-Service SaaS — Where This Fits
| This template (Excel) | Google Sheets KPI scorecard | Jobber / ServiceTitan-class SaaS | |
|---|---|---|---|
| Cost | One payment, no renewal | One payment, no renewal | Roughly $50 to $300 per user per month |
| Platform | Excel 2013+, Excel for the web | Browser, any device | Web plus mobile app |
| Setup time | Minutes — type over the sample | Minutes — copy the sheet | Weeks, usually with onboarding |
| Real-time team collaboration | Via OneDrive or SharePoint | Yes, natively | Yes |
| Mobile access | Excel mobile app | Yes | Yes, built for the field |
| Customisable KPIs | Type a new row, no formula edits | Type a new row | Only what the vendor exposes |
| Share with a link | Via OneDrive | Yes | Yes |
| Year-1 cost at 5 users | The purchase price | The purchase price | $3,000 to $18,000 |
| Job scheduling and dispatch | No — this is reporting | No | Yes |
| Direction-aware scoring (UTB/LTB) | Yes, set per KPI | Yes, set per KPI | Rarely exposed |
Who This Template Is For — and Who It’s Not For
It fits residential and light-commercial painting contractors running two to twenty crews who already have the numbers in an estimating system or an accounting package and need a monthly board pack; owners who want margin, overage and rework on one page; and estimators and field superintendents who own two or three KPIs each and want to read their own rows. Painting Contractor KPI Dashboard in Excel
It does not fit anyone who wants live job data. This workbook does not connect to Jobber, ServiceTitan, QuickBooks or a takeoff tool — you type the monthly figures in, or paste them from a report, on both the MTD and the YTD columns. It is not a scheduler, an estimator or an invoicing tool, and it does not price a job. If you need daily crew dispatch, buy field-service software and use this alongside it for the monthly review.
How to Use the Painting Contractor KPI Dashboard in Excel
- Open the workbook and read the Read Me sheet — it is a single page and it explains every rule the numbers follow.
- Set your reporting year in cell E3 on KPI Input – Actual. Everything else re-bases from it.
- Review KPI Definition. Rename anything that does not match your language, set UTB or LTB per KPI in column G, and fill the next empty row to add a KPI of your own.
- Replace the sample numbers on KPI Input – Actual, KPI Input – Target and KPI Input – PY. Each sheet has an MTD and a YTD column per month, so you keep control of how your own year-to-date is defined.
- Go to KPI Dashboard, pick your month in D6, and read the seven cards and the fifteen KPI rows.
- Open KPI Trend for anything flagged At Risk or Missed and look at the twelve-month shape before you act on one bad month.
- Finish on KPI Analysis for the group roll-up and the top and bottom five, and take that page into the monthly meeting. Painting Contractor KPI Dashboard in Excel
Real-World Use Cases
Marcus runs an eight-crew residential repaint business. His September scorecard shows Job Gross Margin at 99.7% of target while Material Overage vs Estimate misses at 92.3% — so the margin problem is a take-off problem, not a labour problem, and it goes to the Purchasing Manager rather than the field.
Dana is an estimating manager at a commercial painting firm. She owns Bid Win Rate and Lead to Estimate Response Time. On KPI Trend she can read both KPIs month by month against last year, which is the argument she takes to the owner when she asks for a second estimator.
A field superintendent lives on Painter Productivity (Sq Ft per Labour Hour) and Crew Utilisation, and watches Surface Prep First-Pass QC Rate as the leading indicator of next quarter’s touch-up hours.
Frequently Asked Questions
Do I need macros, Power Query or a Microsoft 365 subscription?
No. It is a plain .xlsx built on VLOOKUP, MATCH, INDEX and COUNTIF. It opens in Excel 2013 and later, and in Excel for the web. There is nothing to enable and nothing to install. Painting Contractor KPI Dashboard in Excel
Can I change the KPIs to my own?
Yes, and that is what the KPI Definition sheet is for. Rename a KPI there and every other sheet follows it. Clear a row and the dashboard row goes blank and the summary cards recount themselves. The sheets are wired for 22 KPI rows, and the Read Me explains how to go beyond that.
Does it pull my numbers in automatically?
No. The three input sheets are typed or pasted, both the MTD and the YTD columns. That is deliberate: it keeps you in control of how your year-to-date is defined, and it means the file works without any connection to your accounting or job-management system.
Why do some KPIs score above 100% when the number went down?
Because they are marked LTB, lower the better. Achievement for an LTB KPI is Target ÷ Actual, so beating a cost, days or cycle-time target scores above 100%, exactly the way beating a revenue target does.
Can I change the On Target and At Risk thresholds?
Yes. They sit in the formulas in columns L and U on KPI Dashboard. Edit them there and both the row statuses and the summary card counts follow. Painting Contractor KPI Dashboard in Excel
What exactly do I download?
A zip holding Painting Contractor KPI Dashboard.xlsx and the Excel KPI Dashboard User Manual PDF.
Is this the same as your Painting Contractor KPI Scorecard?
No. This is the month-picker KPI dashboard with the KPI Trend and KPI Analysis pages described above. The Painting Contractor KPI Scorecard in Excel is a separate build with its own KPI list, and the two are often bought together.
About the Author
Built by PK – Microsoft Certified Professional with 15+ years of Excel, Google Sheets, and Power BI experience. Founder of NextGenTemplates, reaching 300K+ subscribers across YouTube channels. Every template is hand-built and tested before release. Painting Contractor KPI Dashboard in Excel
Explore Related Templates
- Painting Contractor KPI Scorecard in Excel — the same trade, a different scorecard build.
- Painting Contractor KPI Scorecard in Google Sheets — for teams that live in a browser.
- Plumbing Business KPI Dashboard in Excel — the same dashboard build for a plumbing business.
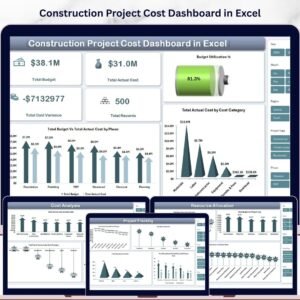
- Construction Project Cost Dashboard in Excel — project-level cost analysis rather than monthly KPIs.
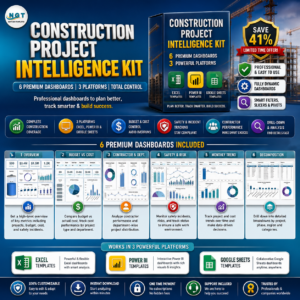
- Construction Project Intelligence Kit — six premium templates across Excel, Power BI and Google Sheets.
- Browse every KPI Dashboard template in the catalogue.
Download the Painting Contractor KPI Dashboard in Excel today, replace the sample year with your own numbers, and walk into next month’s review with margin, overage, rework and safety on one page. Instant download, lifetime access, and every formula open to read.
Last updated: 27 August 2026































Reviews
There are no reviews yet.