

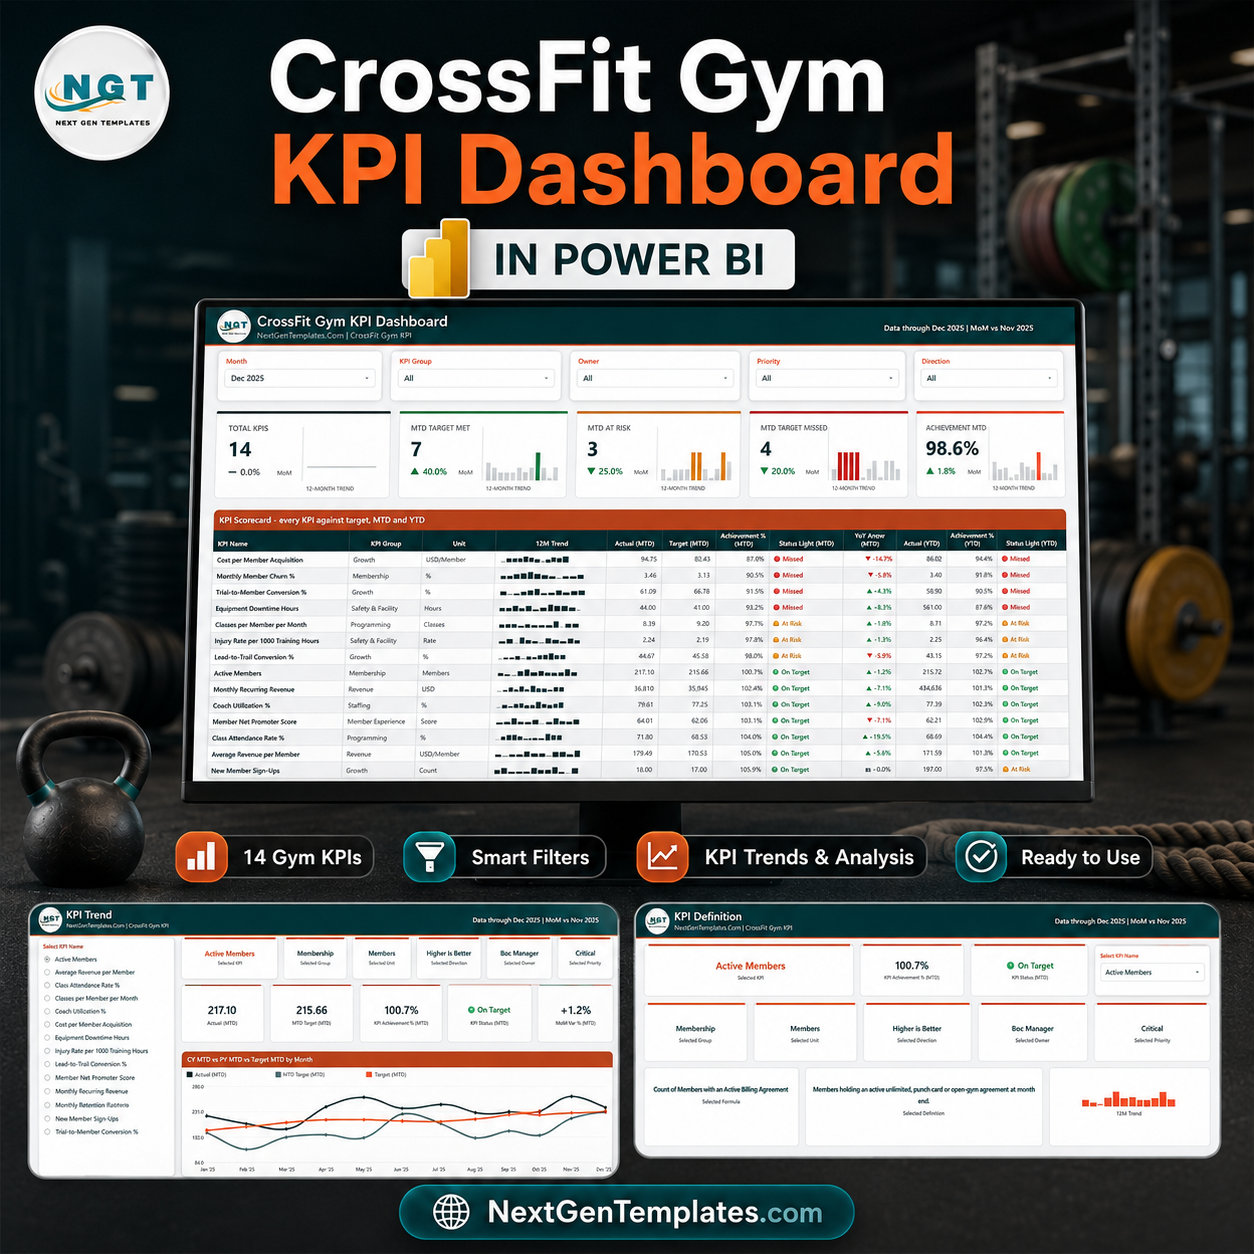

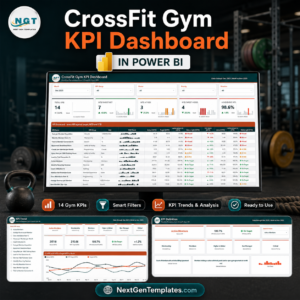
The CrossFit Gym KPI Dashboard in Power BI puts 14 box KPIs on one scorecard and scores every one of them against its own MTD and YTD target. The sample month shipped in the file – December 2025 – reads 7 KPIs on target, 3 at risk and 4 missed, at 98.6% overall MTD achievement, so you can see exactly how the traffic lights behave before you touch a number. Built as a .pbix that opens in the free Power BI Desktop, with 6 report pages, 38 DAX measures behind the visuals, and a 3-sheet Excel data pack you edit and refresh. Native visuals only, nothing locked, nothing to install – and our cancellation and refund policy covers the purchase.
Which product is this? This is the KPI scorecard for a CrossFit affiliate – a table-led review pack with traffic lights, sparklines and a KPI Trend page. It is not the analytical gym dashboard. If you want charts that slice revenue, retention cohorts and class mix, look at the Gym Retention Dashboard in Power BI or the Gym Fitness Business Dashboard in Power BI instead. The same scorecard also exists on two other platforms – the CrossFit Gym KPI Dashboard in Excel and the CrossFit Gym KPI Dashboard in Google Sheets. Buy the one that matches the tool your box already reports in; they are the same idea, not three copies of one file.
Key Features of the CrossFit Gym KPI Dashboard in Power BI
- 14 KPIs across 7 groups – Membership, Growth, Programming, Revenue, Staffing, Member Experience and Safety & Facility. Active Members, New Member Sign-Ups, Monthly Member Churn %, Class Attendance Rate %, Classes per Member per Month, Monthly Recurring Revenue, Average Revenue per Member, Coach Utilisation %, Lead-to-Trial Conversion %, Trial-to-Member Conversion %, Cost per Member Acquisition, Member Net Promoter Score, Injury Rate per 1,000 Training Hours and Equipment Downtime Hours.
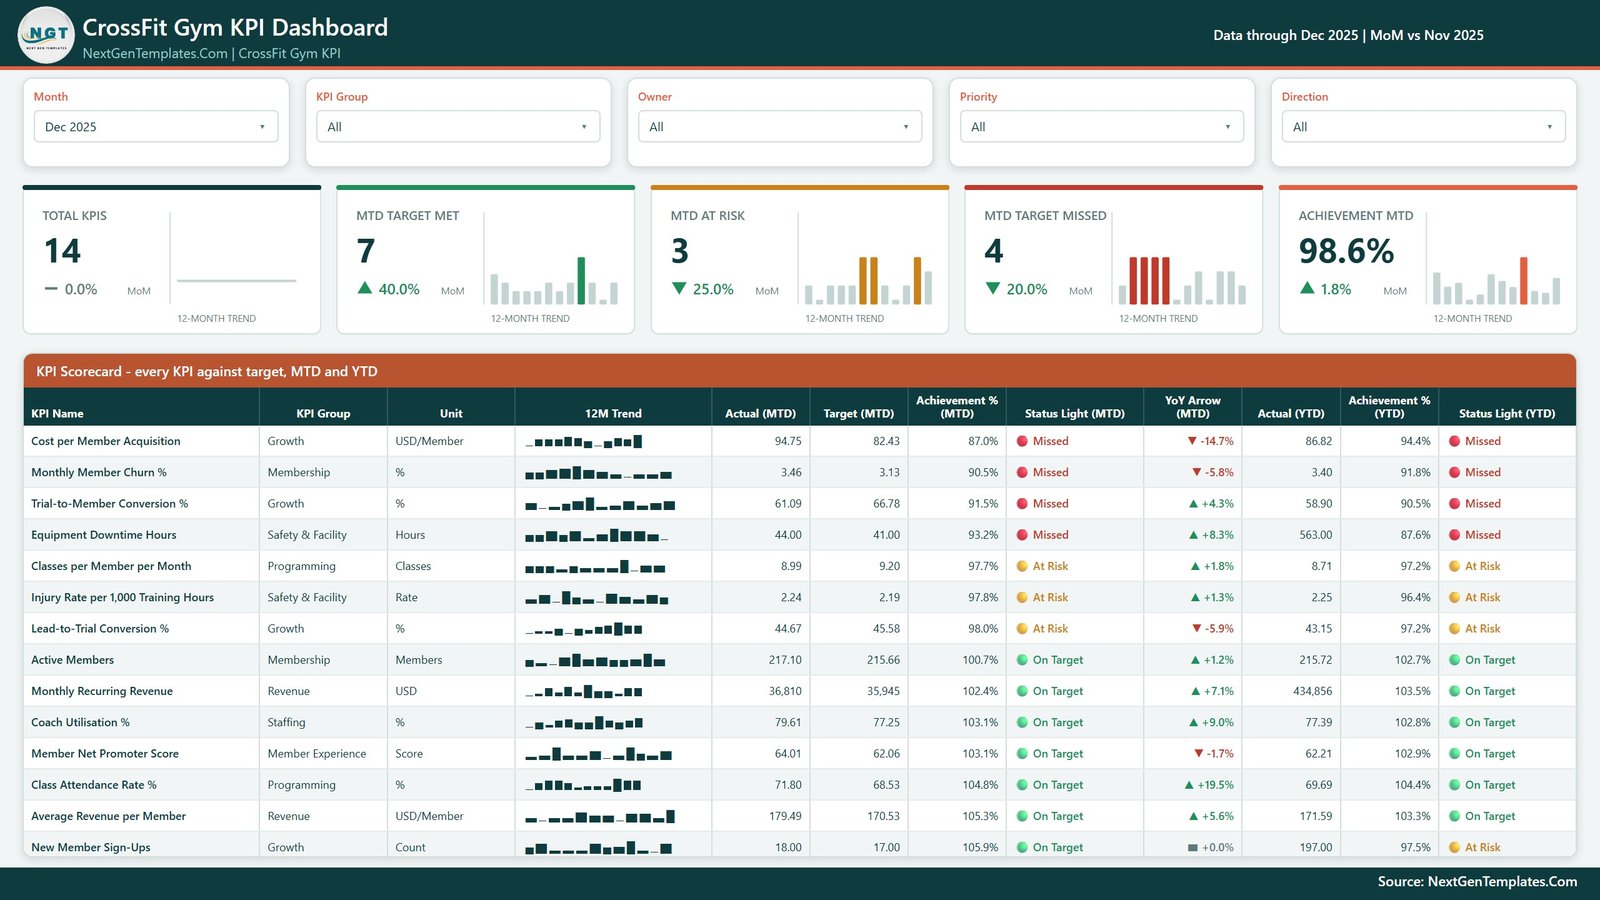
- Two traffic lights per KPI, not one – the scorecard scores MTD and YTD separately, so a KPI can read On Target for the month and Missed for the year. Three states: On Target, At Risk, Missed.
- A 12-month sparkline on every row – the sparkline stays on the full year even when the Month slicer is set to a single month, so a good month inside a bad year is obvious at a glance.
- Direction-aware scoring – each KPI is tagged UTB (higher is better) or LTB (lower is better) in the data pack. Churn, cost per acquisition, injury rate and equipment downtime therefore score above 100% when they fall below target, which is the one place most home-built scorecards get wrong.
- Five slicers on the scorecard – Month, KPI Group, Owner, Priority and Direction. Filter to Safety & Facility, or to everything owned by the Head Coach, or to every Critical KPI, in a click.
- Prior-year comparison built in – the data pack carries 24 months of actuals, so every YoY arrow and every prior-year line on the trend page comes from real history rather than an estimate.
- 38 DAX measures referenced by the report visuals, all written against a clean two-table model (a Data table and a proper Date table).
- Nothing is hard-coded – add a KPI, rename one, or delete one in the Excel data pack, hit Home > Refresh, and the cards, the scorecard, the KPI list and every chart follow.
- Native Power BI visuals only – no custom visual to import, no AppSource dependency, no locked pages. A custom theme file drives every colour, so re-branding is one edit.
What’s Inside the CrossFit Gym KPI Dashboard in Power BI
The download is a single ZIP holding the .pbix and its Data.xlsx source. The report has 6 pages – 4 you navigate and 2 hidden 280×360 tooltip pages that appear when you hover a card or a trend point.
- Page 1 – KPI Scorecard. Five slicers, five summary cards (Total KPIs, MTD Target Met, MTD At Risk, MTD Target Missed, Achievement MTD – each with its own 12-month trend and a MoM delta), then the full 14-row table: KPI Name, KPI Group, Unit, 12M Trend, Actual (MTD), Target (MTD), Achievement % (MTD), Status Light (MTD), YoY Arrow (MTD), Actual (YTD), Achievement % (YTD) and Status Light (YTD).
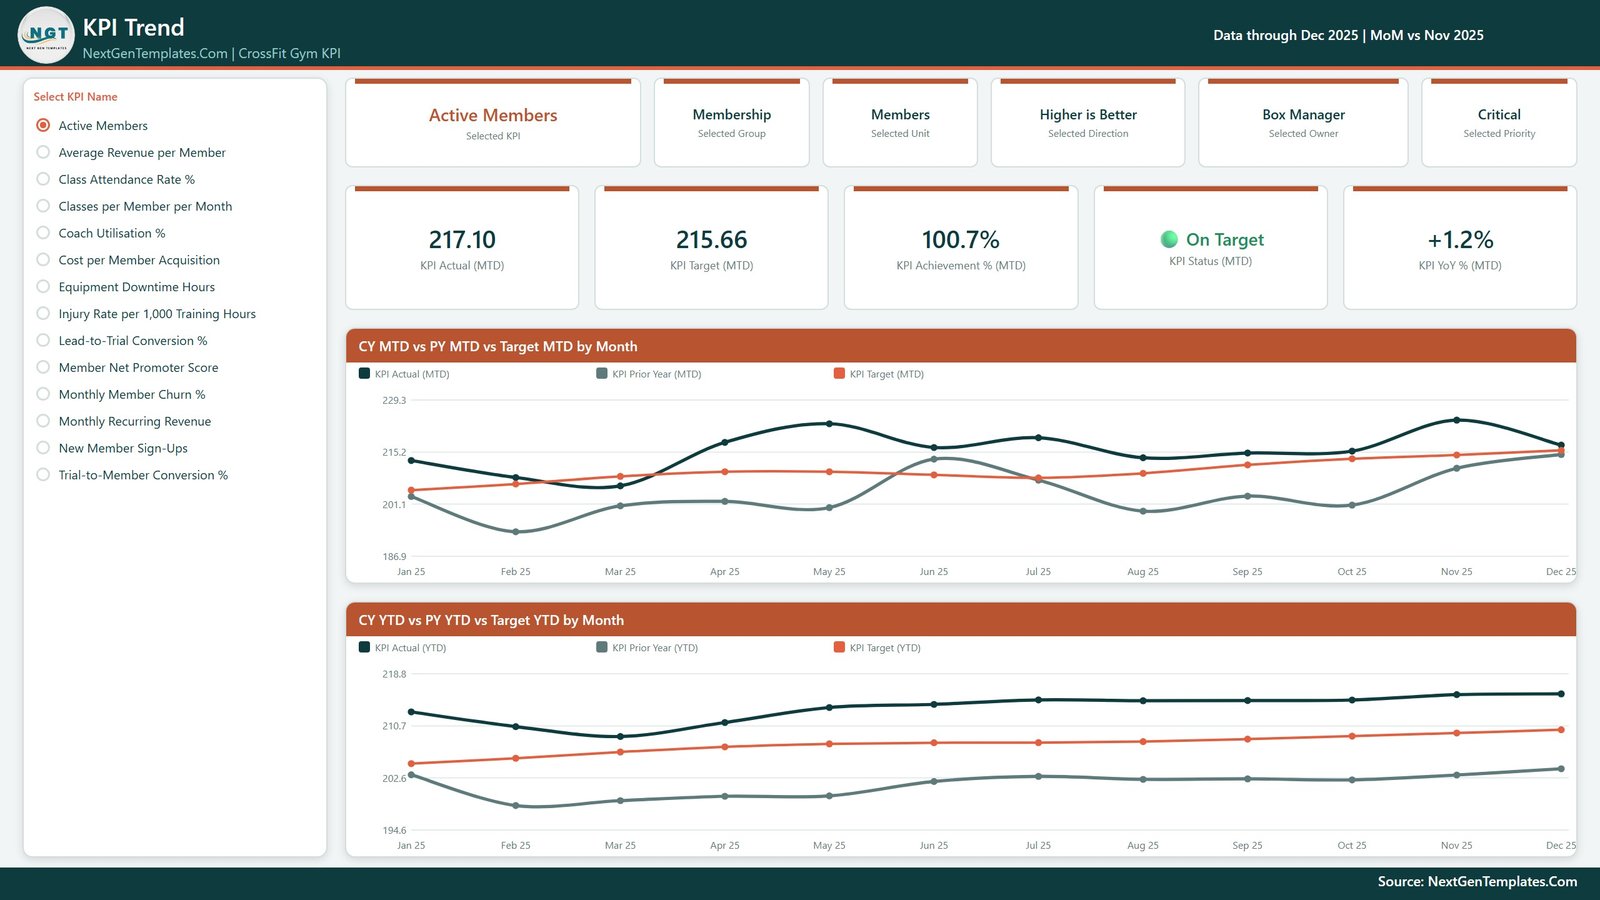
- Page 2 – KPI Trend. Pick one KPI from the list on the left and the whole page becomes that KPI: six context cards (selected KPI, group, unit, direction, owner, priority), five value cards (Actual MTD, Target MTD, Achievement % MTD, Status, YoY %), then two line charts – CY MTD vs PY MTD vs Target MTD by Month and CY YTD vs PY YTD vs Target YTD by Month.
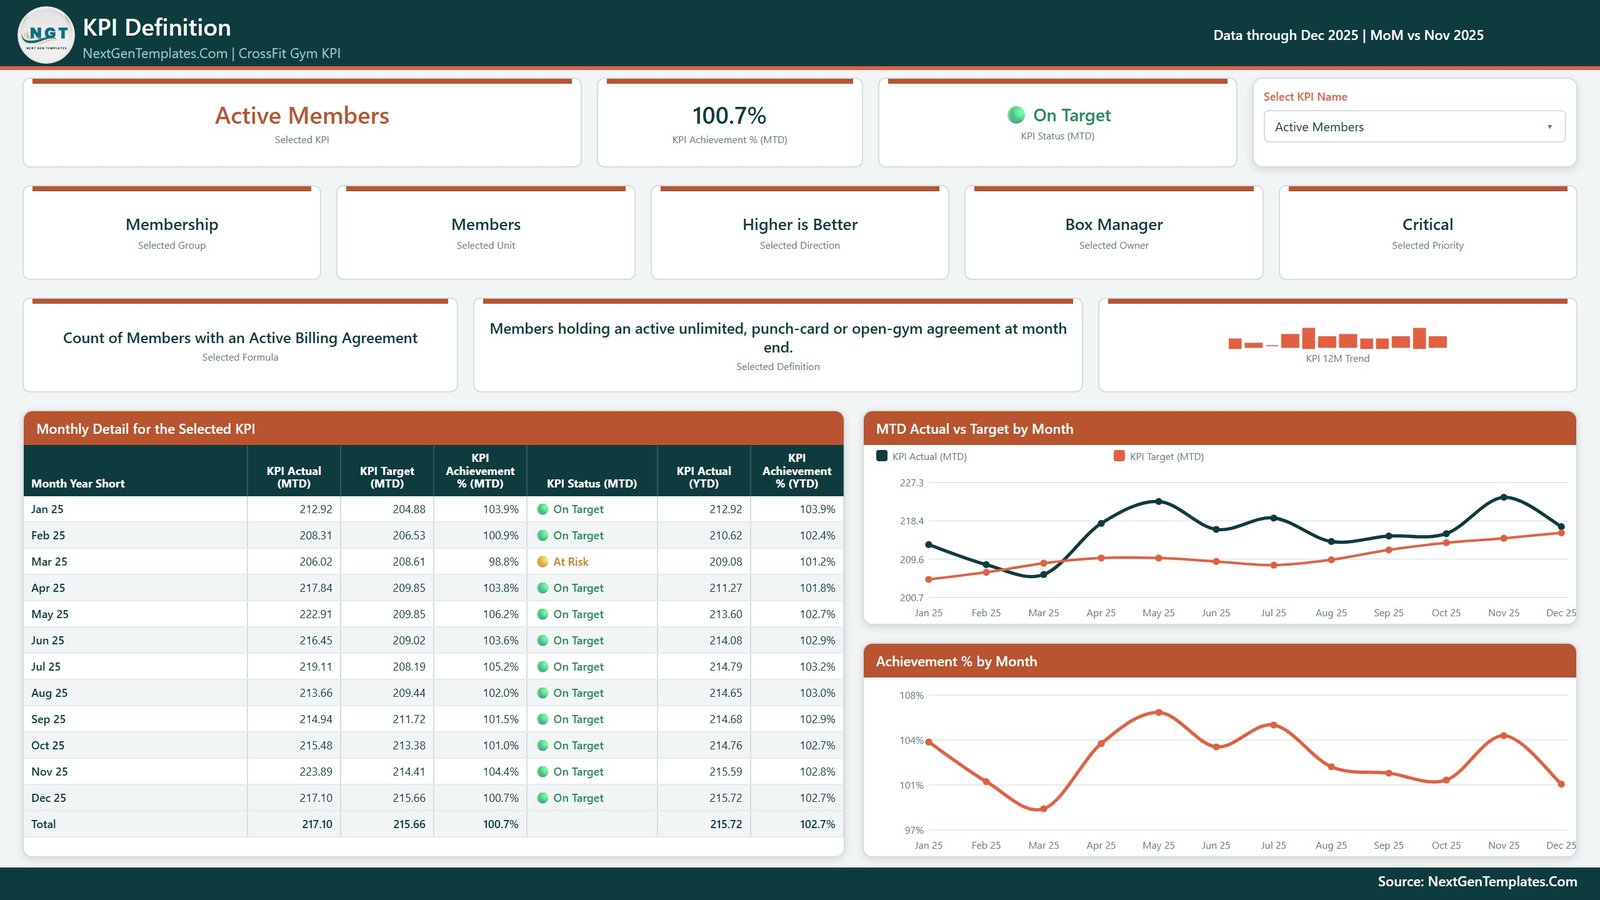
- Page 3 – KPI Definition. The same KPI selection, synced across pages, showing the KPI’s formula and its plain-English definition, its owner and priority, a 12-month trend, a month-by-month table (Actual MTD, Target MTD, Achievement % MTD, Status, Actual YTD, Achievement % YTD, with a total row) and two charts – MTD Actual vs Target by Month and Achievement % by Month.
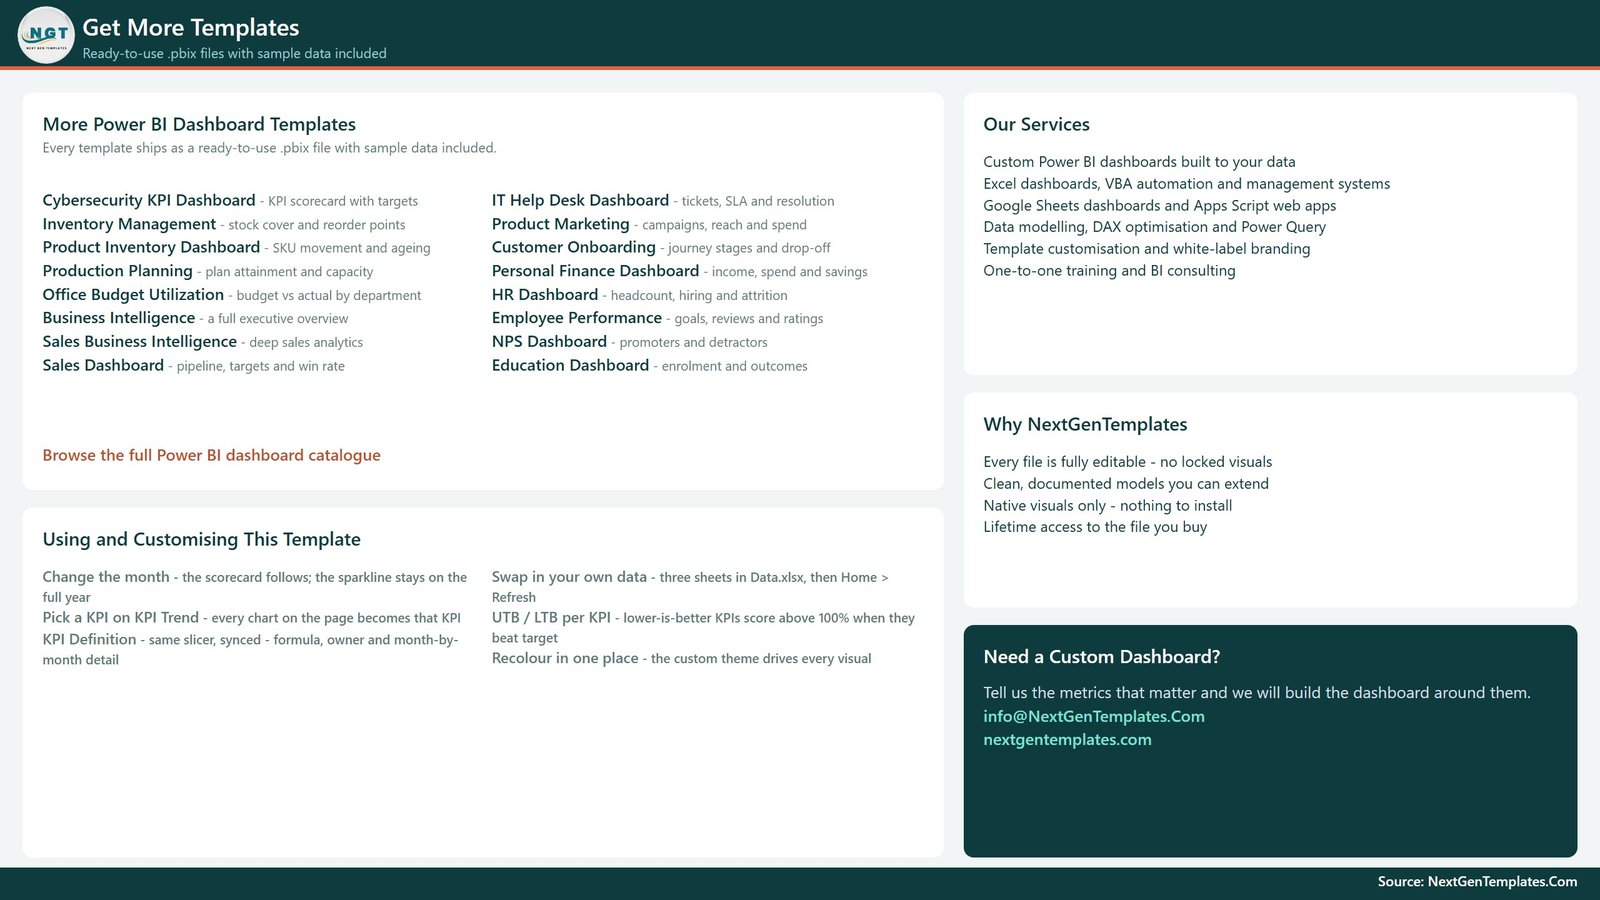
- Page 4 – Get More Templates. A short in-file guide to changing the month, swapping in your own data, the UTB/LTB rule and recolouring, alongside links to the wider catalogue.
- Data.xlsx – 4 sheets. A Read Me, KPI Definition (14 rows x 9 columns: group, name, unit, formula, definition, type, owner, priority), Input_ Target (168 rows – 14 KPIs x 12 months, MTD and YTD) and Input_ Actual (336 rows – the same, for the reporting year and the year before it).
CrossFit Gym KPI Dashboard in Power BI vs. Tableau or Qlik vs. Paid Gym SaaS Reporting – Where This Fits
| This template | Tableau / Qlik build | Gym SaaS reporting module | |
|---|---|---|---|
| Cost | One-time, $12.99 on sale | Per-user subscription plus build time | Recurring, usually bundled per location |
| Platform | Power BI Desktop (free from Microsoft) | Tableau or Qlik licence | Your gym software vendor’s portal |
| Setup time | Open, replace 3 sheets, refresh | Days to weeks of modelling | Instant, but only what the vendor built |
| Real-time team collaboration | Publish to the Power BI Service to share | Yes, on the paid server | Yes |
| Mobile access | Power BI mobile app once published | Yes | Yes |
| Customisable KPIs | Add, rename or delete any KPI in Excel | Fully, with developer effort | Only the vendor’s fixed metric set |
| Share with a link | Yes, after publishing | Yes | Yes |
| Year-1 cost at 5 users | $12.99 total, plus any Power BI licence you already hold | Recurring per-user licence – check vendor pricing | Recurring per-location fee – check vendor pricing |
| MTD and YTD scored separately | Yes, two traffic lights per KPI | If you build it | Rarely |
| Reads directly from your gym software | No – you export to Excel and refresh | With a connector | Yes, natively |
| You own the file forever | Yes | No | No |
Who This Template Is For – and Who It’s Not For
A good fit if you run one or a handful of CrossFit affiliates and want a monthly review pack rather than another live ops screen; if you already export membership, billing and check-in numbers to a spreadsheet; if you want owners and priorities against each metric so the monthly meeting has a name beside every red light; or if you report in Power BI and want the scorecard to sit alongside your other reports.
Not a good fit if you need a live feed from your gym management platform – this refreshes from an Excel file you maintain, and it does not connect to Wodify, PushPress, Zen Planner, Mindbody or any other system. It is not a membership, billing or class check-in tool. It does not ship industry benchmarks or recommended targets; the targets are yours to set. And the injury rate KPI is a management measure for your own safety reviews, not a medical, insurance or regulatory record.
How to Use the CrossFit Gym KPI Dashboard in Power BI
- Unzip the download and open the .pbix in Power BI Desktop.
- Open Data.xlsx and read the Read Me sheet – it explains the three input sheets in about a minute.
- In KPI Definition, keep, rename or replace the 14 KPIs. Set UTB for higher-is-better and LTB for lower-is-better, then set Owner and Priority in your own words.
- Fill Input_ Target with one row per KPI per month, MTD and YTD.
- Fill Input_ Actual the same way, for the reporting year and the year before it – the prior year is what every YoY arrow reads from.
- Back in Power BI Desktop, click Home > Refresh. Every card, light, sparkline and chart rebuilds around whatever rows now exist.
- Set the Month slicer to the month you are reviewing, then work the scorecard top to bottom – the table sorts worst-performing first.
- For anything red, open KPI Trend, select that KPI, and check whether the month is an outlier or a trend. KPI Definition then gives you the formula and the owner for the follow-up.
Real-World Use Cases
Marcus, owner of a single 180-member affiliate. He exports billing and check-ins on the 2nd of each month, pastes them into the three sheets and refreshes. The monthly owners’ meeting now opens on the scorecard: December read 4 KPIs missed, and because Cost per Member Acquisition showed 87.0% MTD achievement against an 82.43 target, the conversation was about intro-offer spend rather than about who felt busy.
Dana, head coach across two boxes. She filters Owner to “Head Coach” and sees only the four metrics she actually controls – Class Attendance Rate %, Classes per Member per Month, Coach Utilisation % and Injury Rate per 1,000 Training Hours – and takes that one filtered page into the coaching team’s weekly.
Priya, a consultant to three affiliates. She keeps one copy of the file per client, swaps the KPI list per box (some drop NPS, some add retail revenue) and delivers the same review pack to all three without rebuilding a report.
Frequently Asked Questions
Does it connect to Wodify, PushPress, Zen Planner or Mindbody?
No. The model imports from the bundled Data.xlsx. You export from whatever your box runs on, paste into the three input sheets and refresh. Nothing in the file talks to a gym platform’s API.
Do I need a paid Power BI licence?
Not to use it. Power BI Desktop is free from Microsoft and opens the .pbix straight away. A Power BI licence is only needed if you want to publish the report and share it with others online.
Can I change the 14 KPIs?
Yes – that is the point of the design. Add rows, delete rows or rename them in all three sheets (the KPI name is the join key), then refresh. No DAX editing, no visual rebuilding.
How is this different from the CrossFit Gym KPI Dashboard in Excel or in Google Sheets?
Same 14-KPI idea, three different tools. Pick the one your box already reports in – the Excel version if you live in workbooks, the Google Sheets version if your team shares links, and this one if you report in Power BI. There is also a CrossFit Gym KPI Scorecard in Excel, which is a lighter one-page review sheet.
What are the two hidden pages?
They are 280×360 tooltip pages. They are hidden by design – hover a KPI card or a point on a trend line and one of them appears as a rich tooltip.
Is there a drillthrough?
No. On this build, KPI Trend and KPI Definition are linked by a synced “Select KPI Name” slicer – pick a KPI on one page and the other page is already showing it. It behaves like a drillthrough without the right-click.
Are the sample numbers real?
No. The December 2025 figures are realistic demo data so the traffic lights, YoY arrows and sparklines have something to show. Replace them with your own before you make any decision on them.
About the Author
Built by PK – Microsoft Certified Professional with 15+ years of Excel, Google Sheets, and Power BI experience. Founder of NextGenTemplates, reaching 300K+ subscribers across YouTube channels. Every template is hand-built and tested before release.
Explore Related Templates
- Gym Retention Dashboard in Power BI – the analytical companion, for cohort and churn analysis rather than scoring.
- Gym Fitness Business Dashboard in Power BI – a wider business view across revenue, membership and classes.
- Fitness Trainer Dashboard in Power BI – built around individual trainer performance.
- CrossFit Gym KPI Scorecard in Excel – the one-page Excel review sheet.
- Browse every Power BI KPI Dashboard, or the full Power BI catalogue.
Get the CrossFit Gym KPI Dashboard in Power BI for $12.99 (regular $19.99) – one file, yours to keep, editable end to end. Add it to your cart above and download it immediately.
Last updated: 26 August 2026.



























Reviews
There are no reviews yet.