

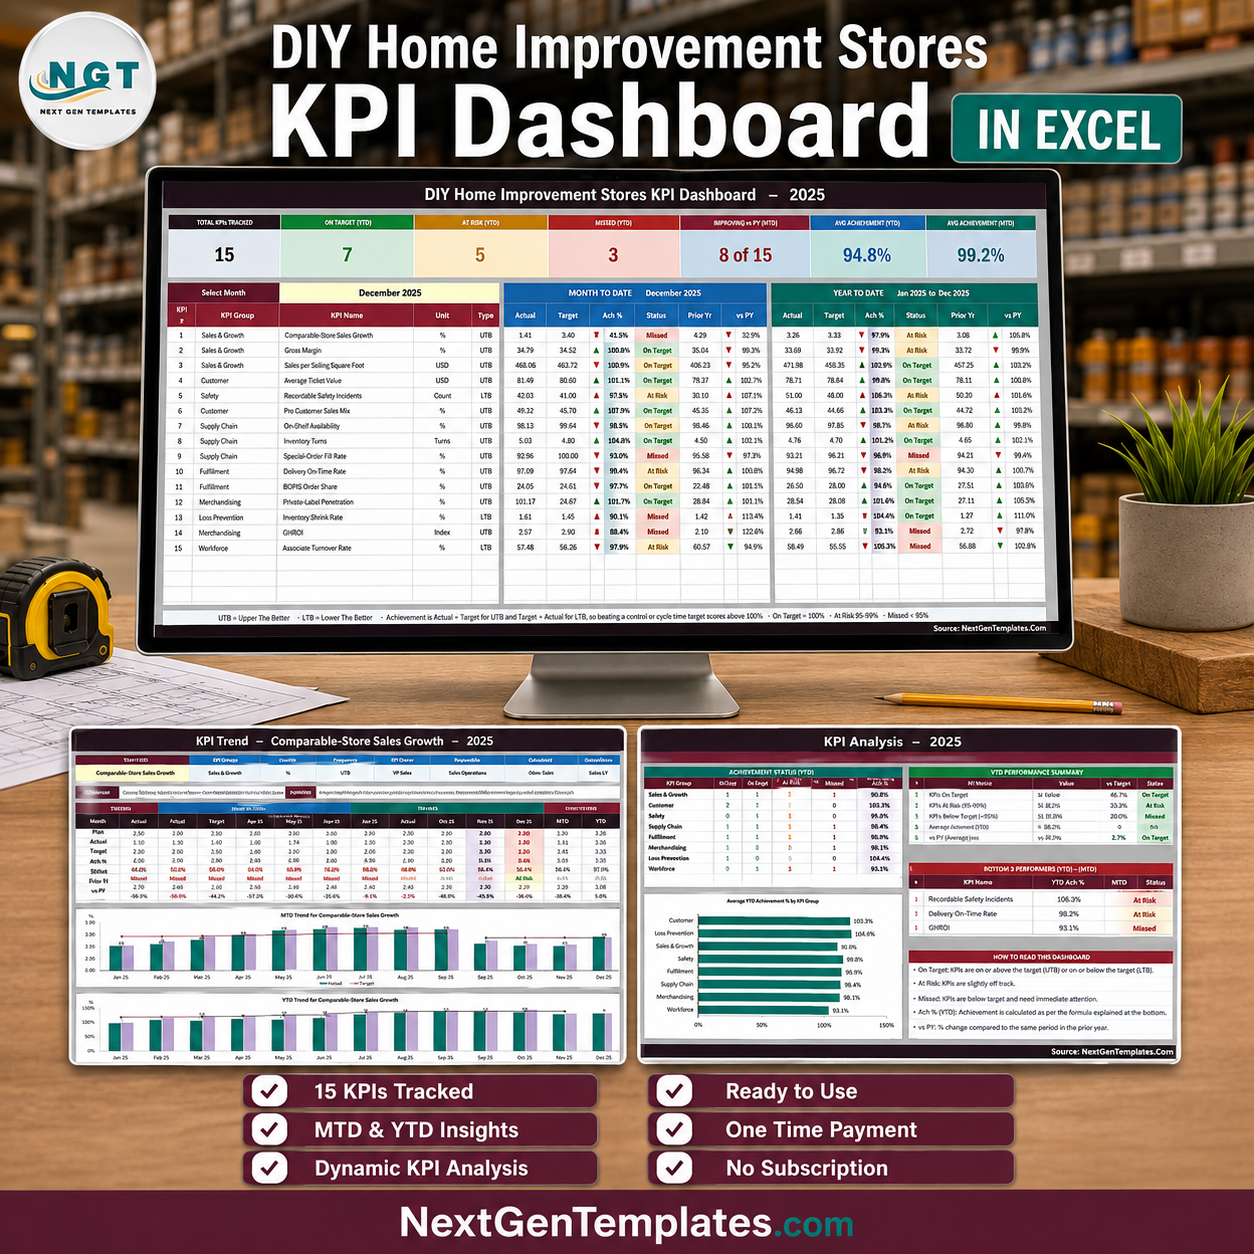

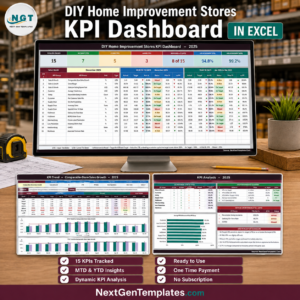
The DIY Home Improvement Stores KPI Dashboard in Excel tracks 15 retail KPIs across 8 KPI groups – comparable-store sales growth, gross margin, sales per selling square foot, pro customer mix, on-shelf availability, GMROI, shrink and associate turnover – on a single month-picker scorecard. Pick a month from one dropdown and every MTD and YTD figure, achievement percentage, traffic light and year-on-year arrow recalculates. 10 worksheets, 24 months of sample data (2025 actual and target, 2024 prior year), zero macros, zero Power Query, zero add-ins. It is plain worksheet formulas – VLOOKUP, MATCH, INDEX, COUNTIF – so it opens in Excel 2013 or later and in Excel for the web. Nothing is locked, nothing is hidden. One payment, lifetime access to the file, no subscription. Built and page-tested by PK before release.DIY Home Improvement Stores KPI Dashboard in Excel
Please read this first, because two similarly named products exist. This is the KPI scorecard line: a month picker, a 15-row traffic-light scorecard, a single-KPI trend page and a group roll-up page. It is not the analytical DIY Home Improvement Stores Dashboard in Excel, which is a pivot-and-slicer analytics dashboard built over a transaction table, and it is not the Power BI version of that dashboard. They answer different questions and many buyers own both. The comparison further down spells out which one you want. DIY Home Improvement Stores KPI Dashboard in Excel
Key Features of the DIY Home Improvement Stores KPI Dashboard in Excel
- One dropdown drives the whole scorecard. Cell D6 on the KPI Dashboard sheet lists the twelve months of your reporting year. Change it and the 15 KPI rows, the seven summary cards and the entire KPI Analysis page re-read from that month. There is no refresh button and no query to run. DIY Home Improvement Stores KPI Dashboard in Excel
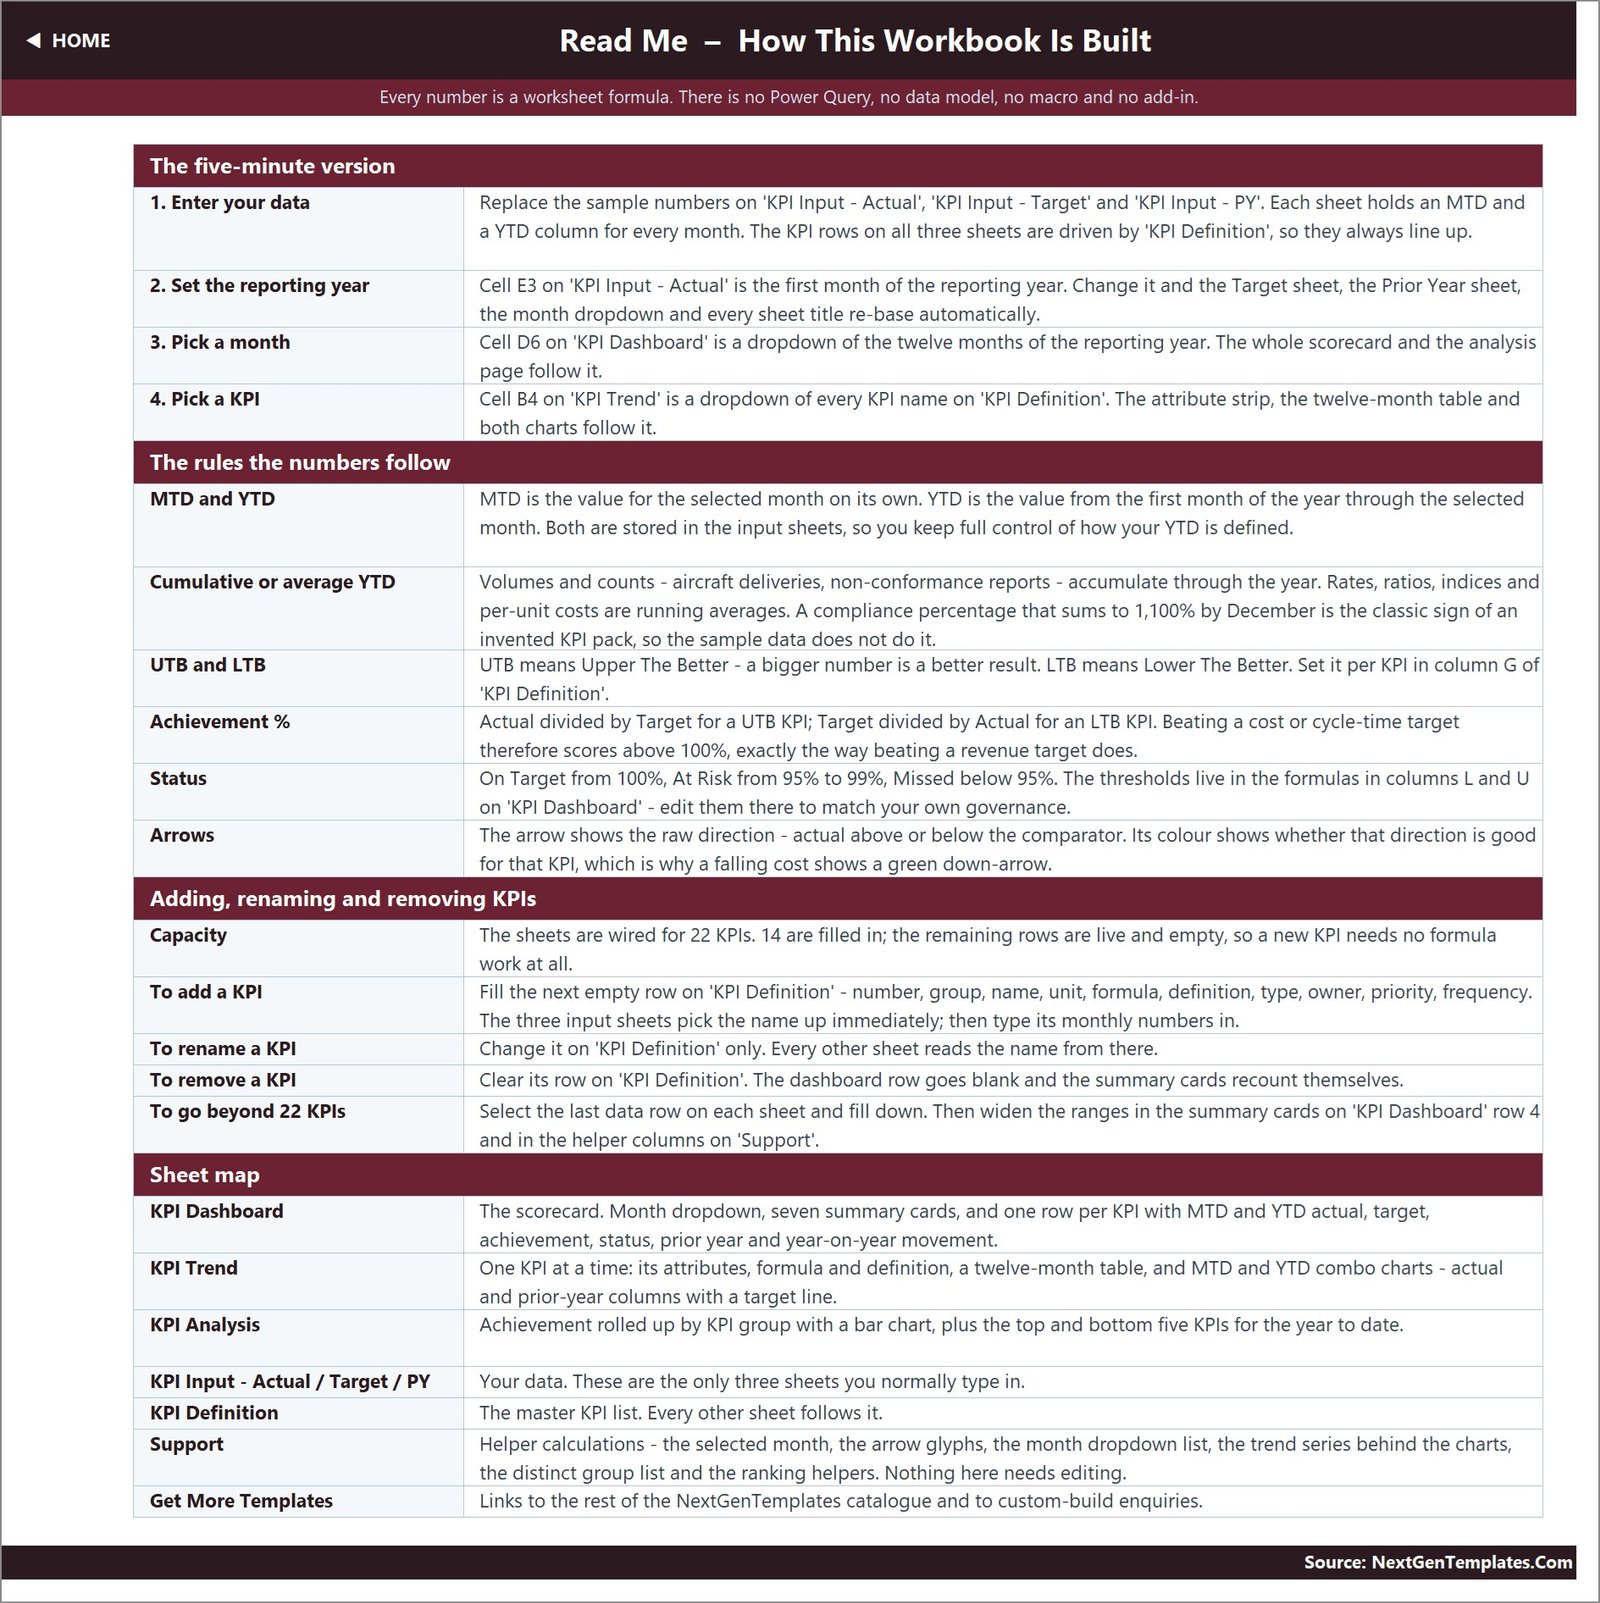
- Direction-aware achievement scoring. Every KPI carries a UTB (upper the better) or LTB (lower the better) flag. Achievement is Actual ÷ Target for UTB and Target ÷ Actual for LTB, so cutting shrink or lowering associate turnover scores above 100% exactly the way beating a sales target does. Recordable Safety Incidents, Inventory Shrink Rate and Associate Turnover Rate all run as LTB in the sample.
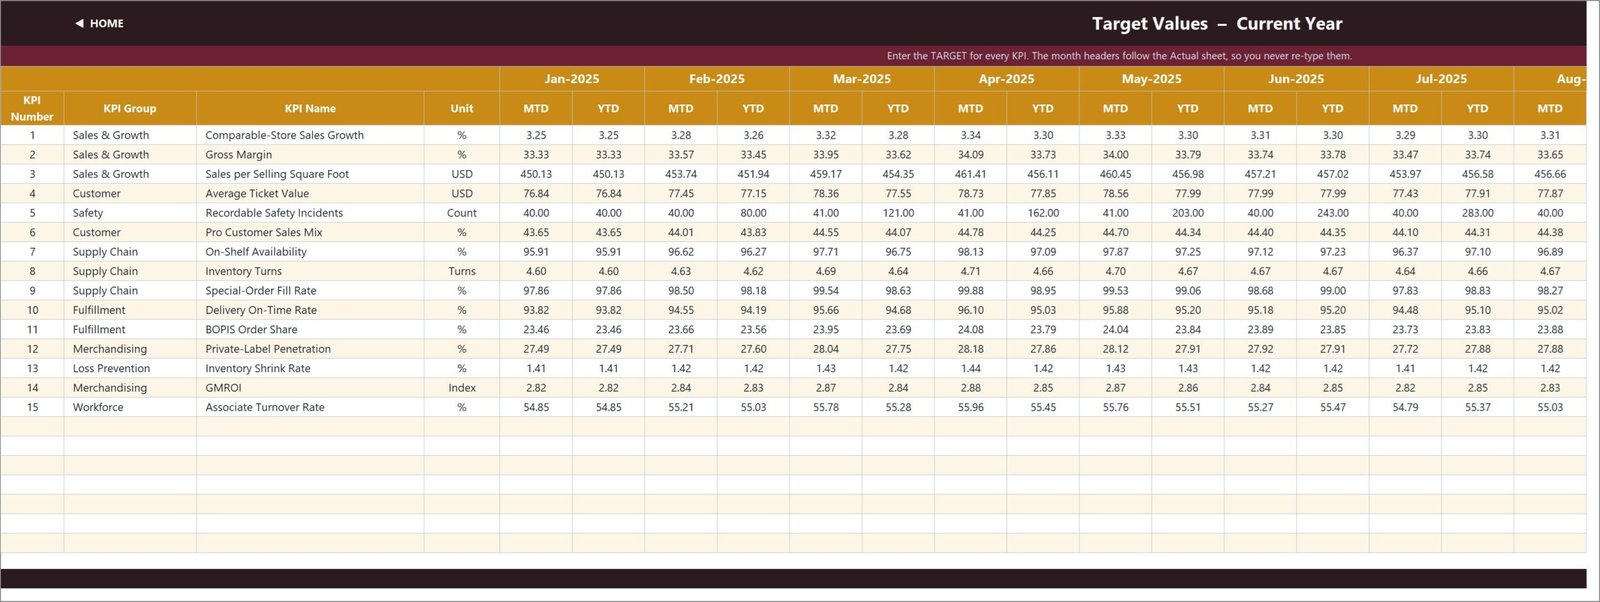
- Traffic lights you can re-cut. On Target from 100%, At Risk from 95% to 99%, Missed below 95%. The thresholds live in the formulas in columns L and U on KPI Dashboard, so a chain that runs a tighter or looser governance band edits two formulas rather than rebuilding conditional formatting.
- MTD and YTD side by side, plus prior year. Each KPI row carries Actual, Target, Achievement %, Status, Prior Year and a vs-PY movement for month-to-date and year-to-date. Rate and ratio KPIs run as YTD averages; counts such as recordable safety incidents accumulate. DIY Home Improvement Stores KPI Dashboard in Excel
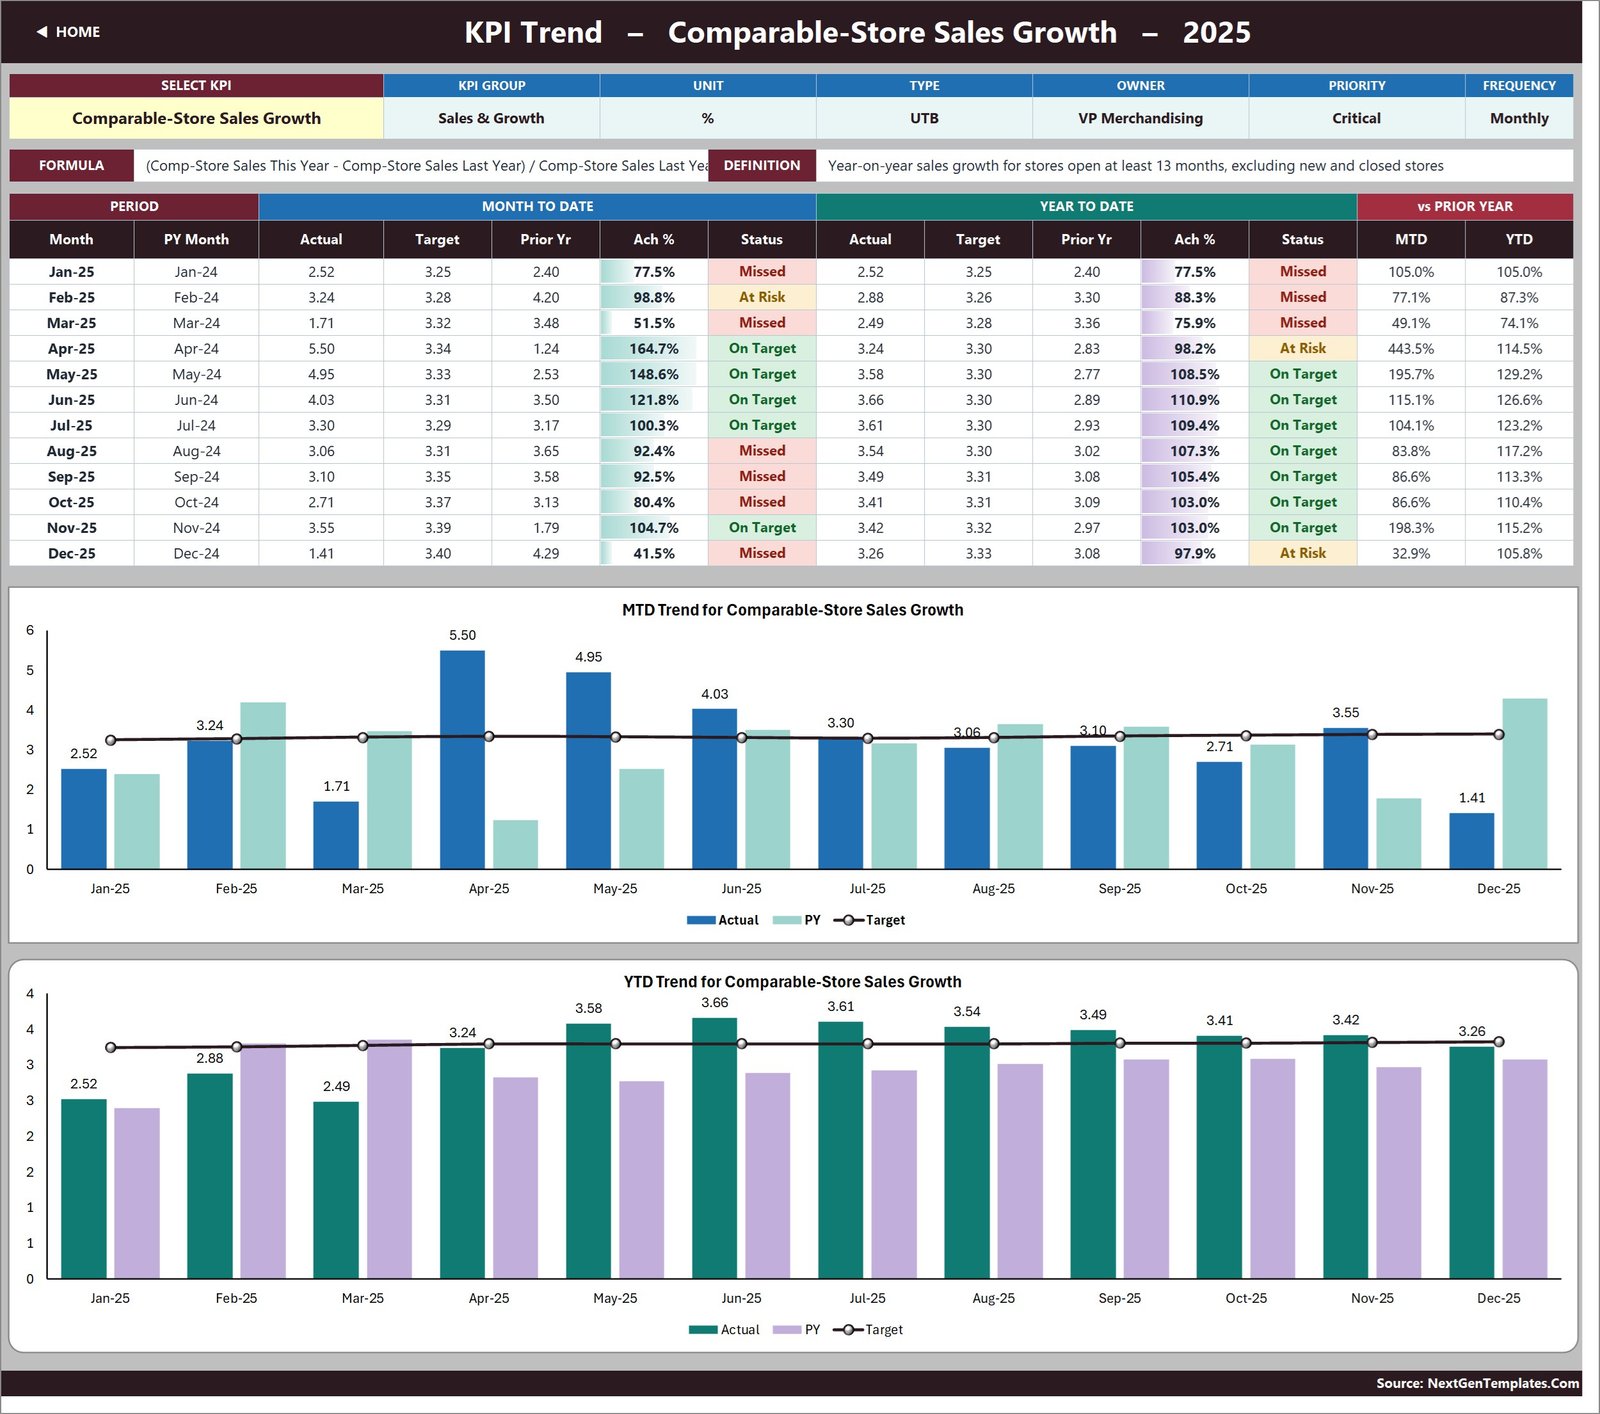
- A single-KPI trend page with two charts. Pick any KPI from cell B4 on KPI Trend and its attribute strip, its formula and definition, a twelve-month table and two combo charts – Actual and Prior Year columns with a Target line, one MTD and one YTD – all redraw.
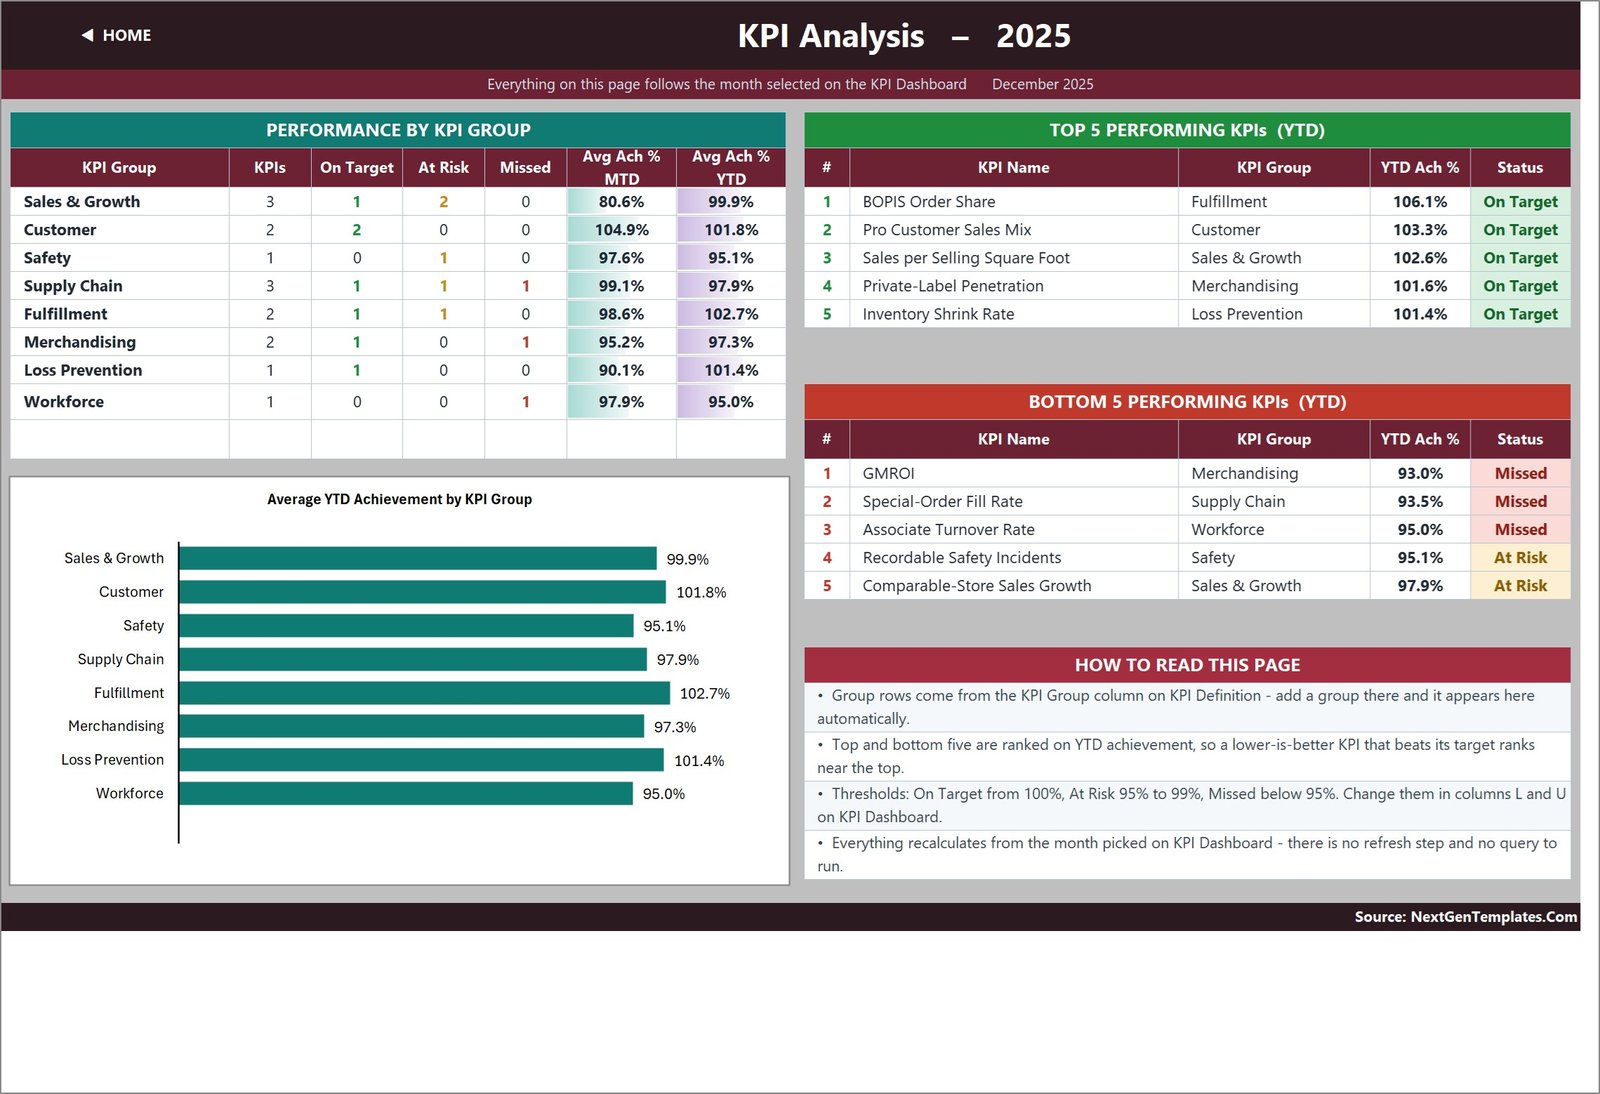
- Group roll-up and ranked movers. KPI Analysis rolls achievement up by KPI group with an On Target / At Risk / Missed count and a bar chart, then ranks the top five and bottom five KPIs on YTD achievement.
- Add or rename KPIs without touching a formula. The sheets are wired for 22 KPI rows; 15 are filled and 7 are live and empty. Type a new KPI on KPI Definition – number, group, name, unit, formula, definition, type, owner, priority, frequency – and it appears on all three input sheets, the scorecard, the trend picker and the analysis roll-up immediately.
- Ownership baked into the KPI list. Every KPI carries an accountable owner (VP Merchandising, VP Supply Chain, Director Loss Prevention, Director EHS and so on), a priority of Critical / High / Medium and a review frequency, so the scorecard doubles as a governance document.
What’s Inside the DIY Home Improvement Stores KPI Dashboard in Excel
The download is a single ZIP containing the .xlsx workbook and a user manual PDF. The workbook holds ten sheets:
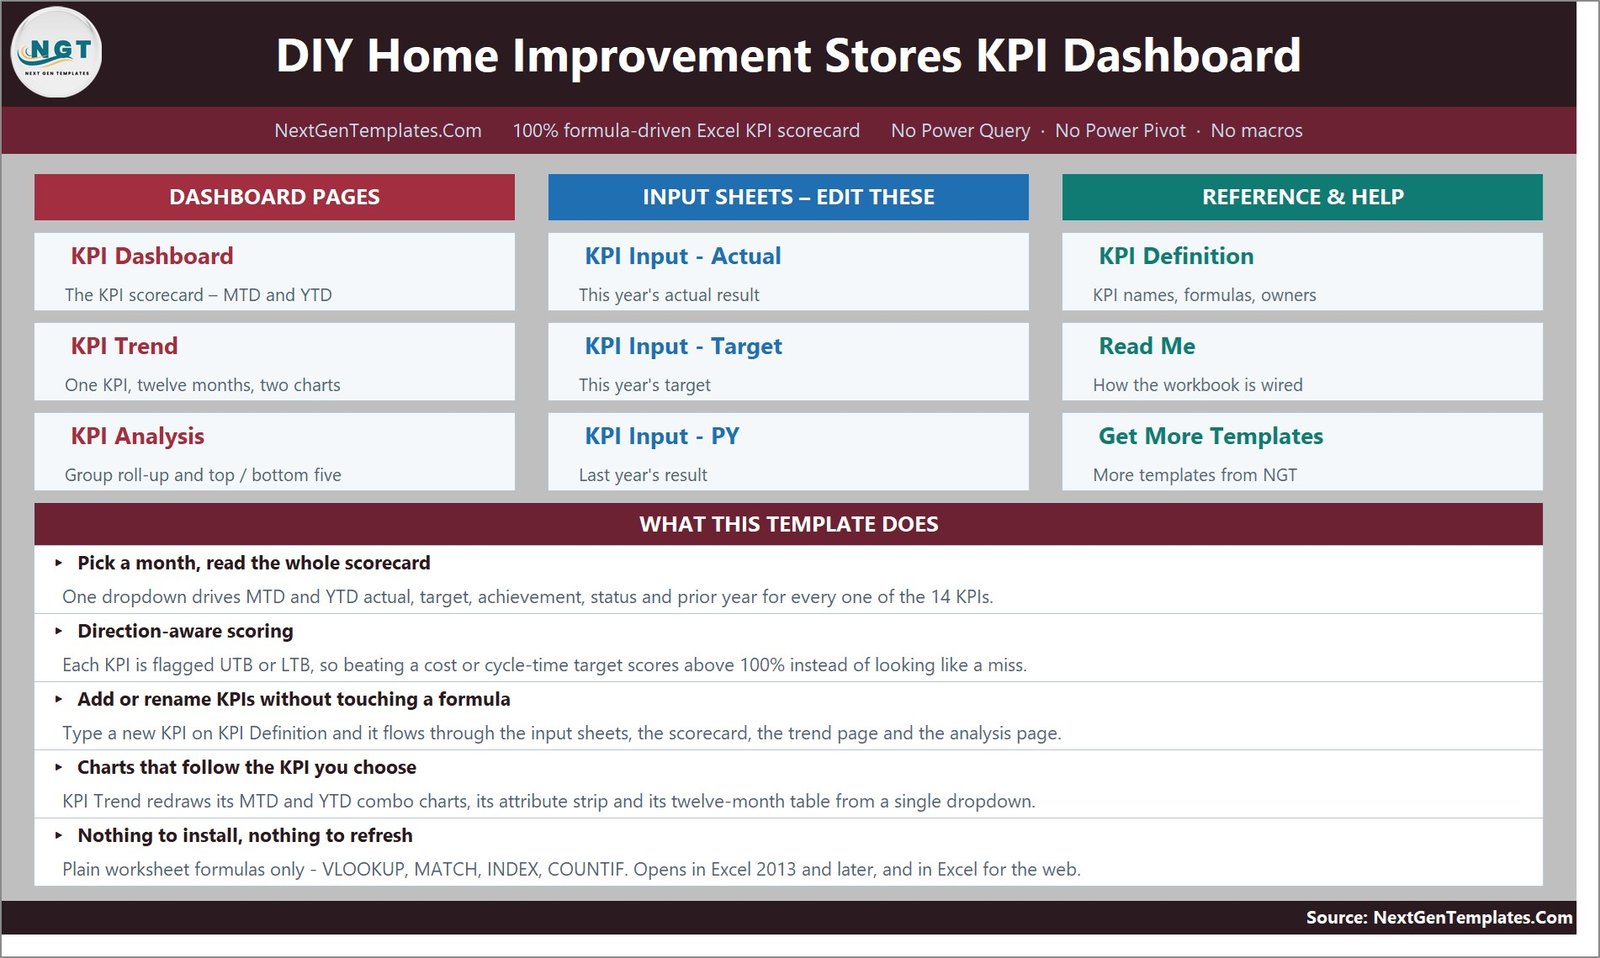
- Home – a navigation page with links to every sheet and a five-point summary of what the template does.
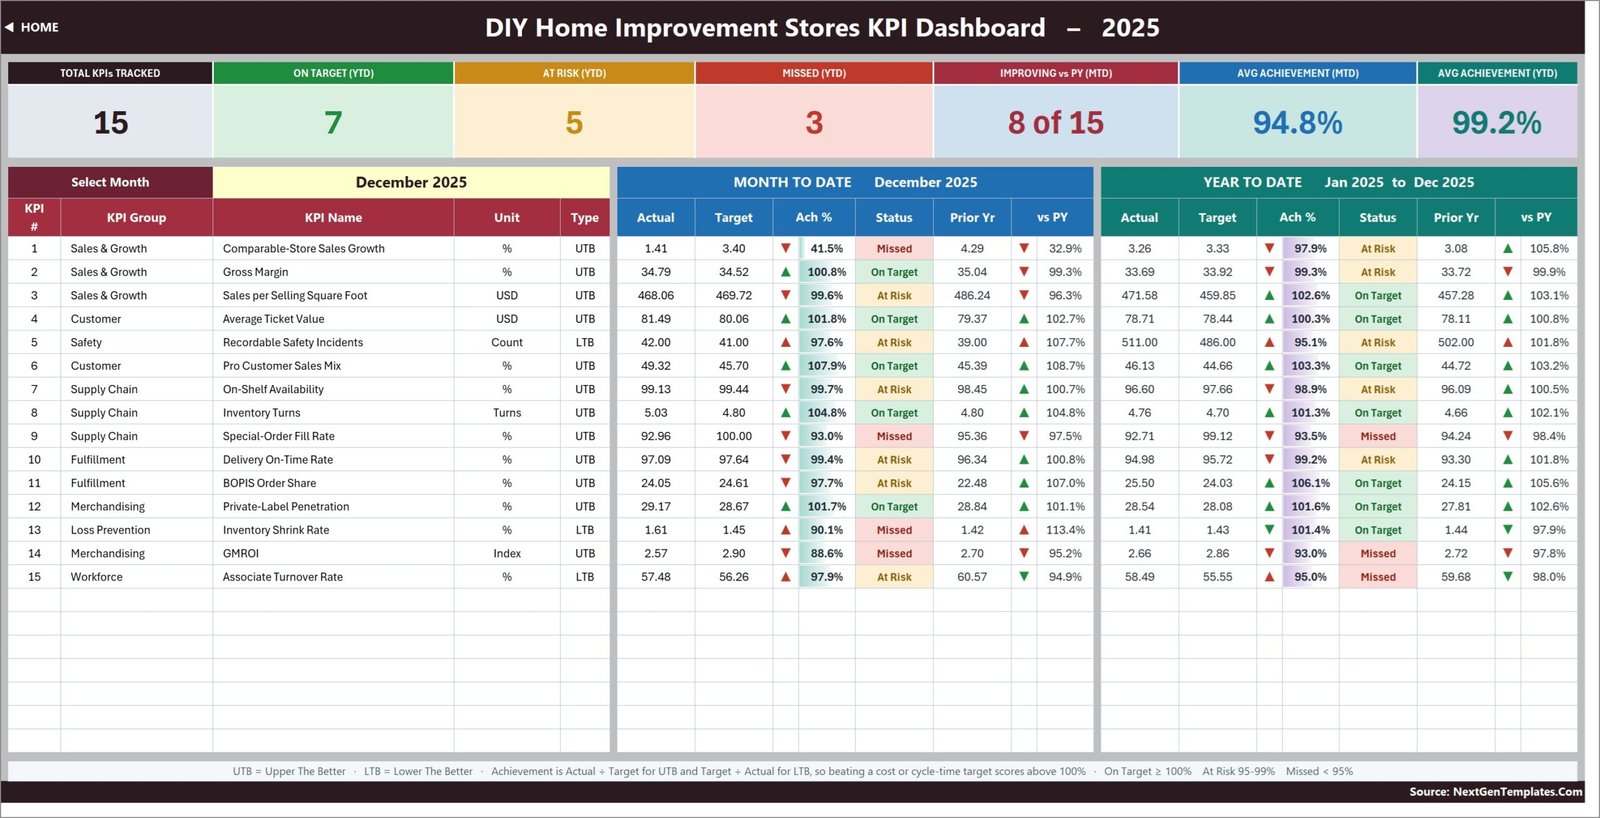
- KPI Dashboard – the scorecard. Month picker, seven summary cards (Total KPIs Tracked, On Target YTD, At Risk YTD, Missed YTD, Improving vs PY MTD, Avg Achievement MTD, Avg Achievement YTD) and one row per KPI.
- KPI Trend – one KPI at a time across twelve months, with MTD and YTD combo charts.
- KPI Analysis – performance by KPI group, an average-YTD-achievement bar chart, and ranked top five and bottom five KPIs.
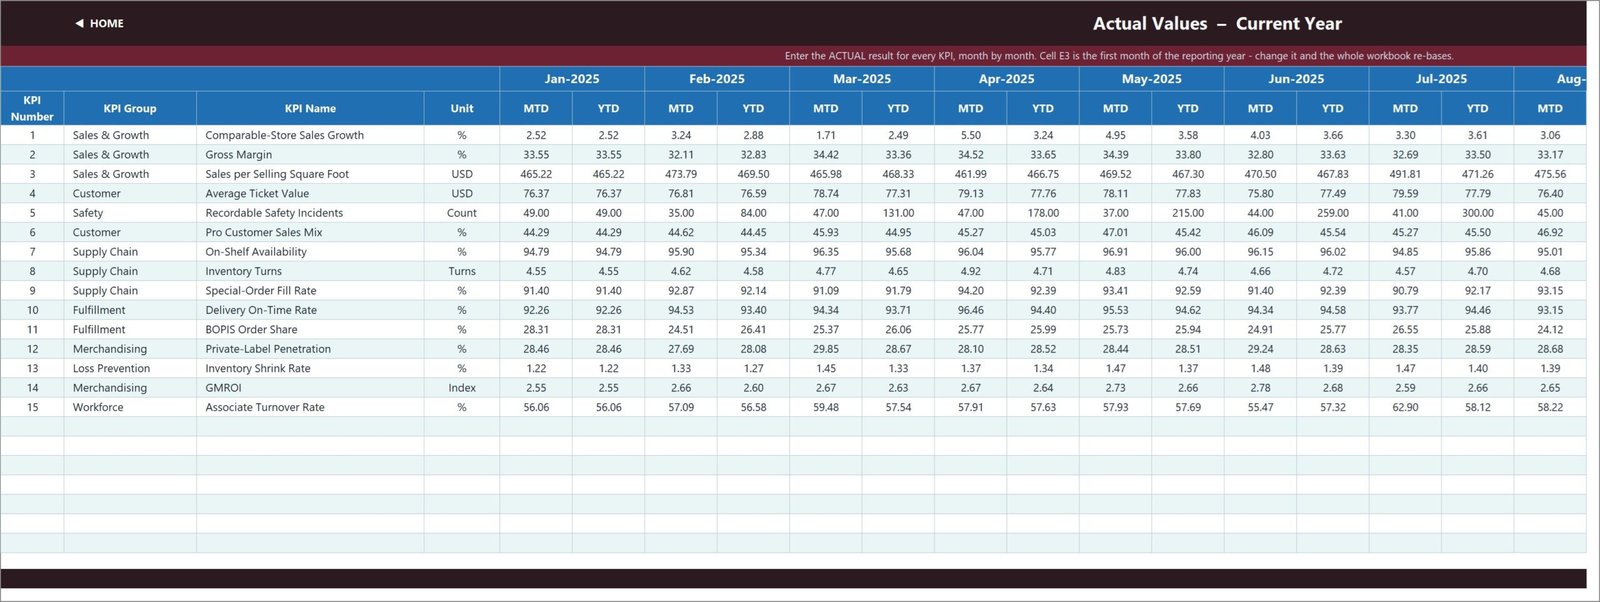
- KPI Input – Actual – this year’s results. MTD and YTD columns for each of the twelve months. Cell E3 sets the first month of the reporting year and the whole workbook re-bases from it.
- KPI Input – Target – this year’s targets, on the same grid.
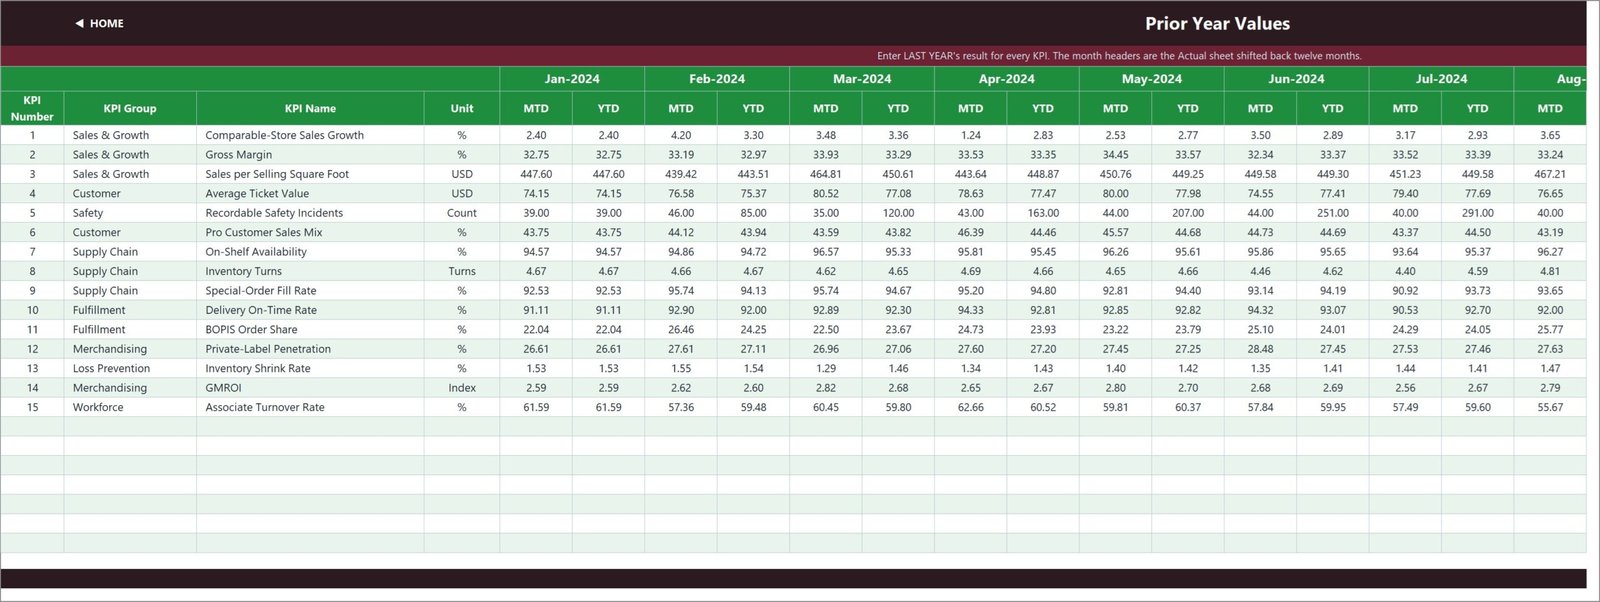
- KPI Input – PY – last year’s results, month headers shifted back twelve months automatically.
- KPI Definition – the master list: group, name, unit, formula, definition, UTB/LTB type, owner, priority and frequency for all 15 KPIs.
- Support – helper calculations behind the month dropdown, the arrow glyphs, the chart series and the ranking. Nothing here needs editing.
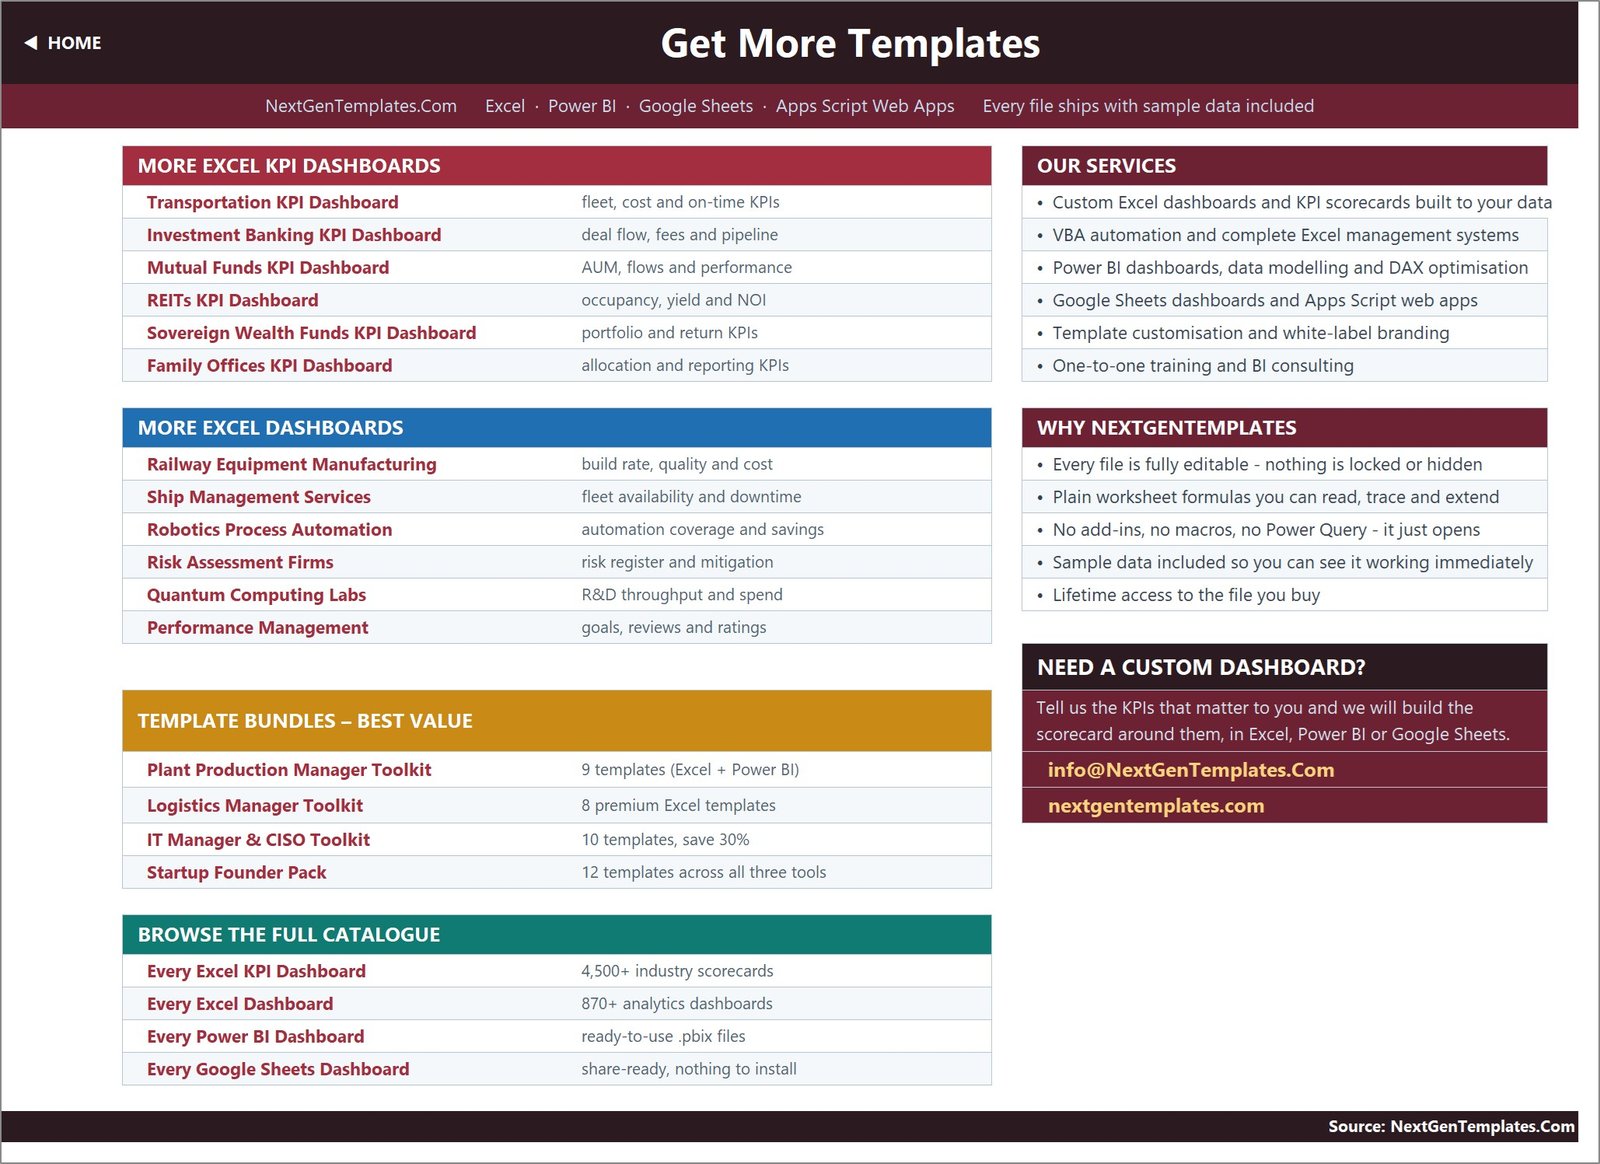
- Get More Templates – links to the rest of the NextGenTemplates catalogue.
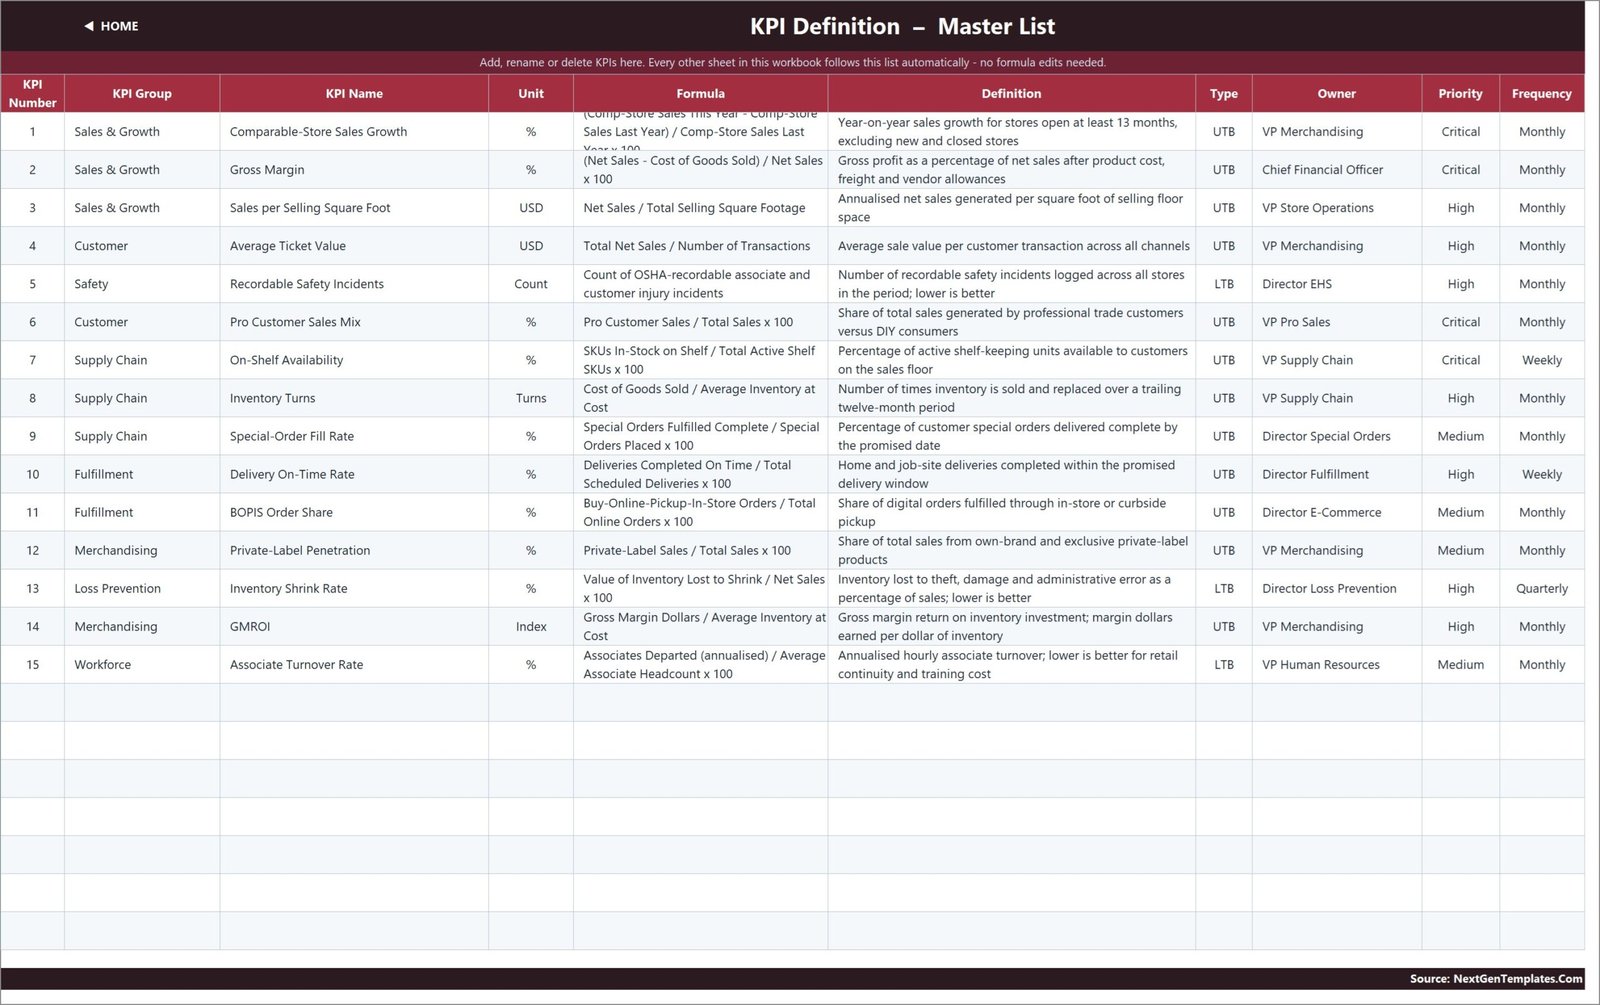
The 15 KPIs that ship, by group: Sales & Growth – Comparable-Store Sales Growth, Gross Margin, Sales per Selling Square Foot. Customer – Average Ticket Value, Pro Customer Sales Mix. Safety – Recordable Safety Incidents. Supply Chain – On-Shelf Availability, Inventory Turns, Special-Order Fill Rate. Fulfillment – Delivery On-Time Rate, BOPIS Order Share. Merchandising – Private-Label Penetration, GMROI. Loss Prevention – Inventory Shrink Rate. Workforce – Associate Turnover Rate.
Every KPI arrives with its arithmetic written down. GMROI is Gross Margin Dollars ÷ Average Inventory at Cost. On-Shelf Availability is SKUs In-Stock on Shelf ÷ Total Active Shelf SKUs × 100. Comparable-Store Sales Growth is the year-on-year change for stores open at least 13 months, excluding new and closed stores. You can hand the KPI Definition sheet to a store operations lead and they can argue with the definition rather than guess at it. DIY Home Improvement Stores KPI Dashboard in Excel
Excel KPI Scorecard vs. Google Sheets vs. Paid Retail BI – Where This Fits
| This Excel KPI Dashboard | Google Sheets KPI Dashboard | Paid retail BI (NetSuite Analytics, Zoho Analytics) | |
|---|---|---|---|
| Cost | $12.99 one time | $8.99-$13.99 one time | $50-$300 per user per month |
| Platform | Excel 2013+, Microsoft 365, Excel for the web | Browser, any device | Browser plus a connected ERP or POS |
| Setup time | Under an hour – replace three input sheets | Under an hour | 2-8 weeks of data-source mapping |
| Real-time team collaboration | Via OneDrive or SharePoint co-authoring | Native, built in | Native |
| Mobile access | Excel mobile app, read and light edit | Full | Full, with native apps |
| Customizable fields | Every cell – nothing locked or hidden | Every cell | Only what the vendor exposes |
| Share with a link | Through OneDrive or SharePoint | Native | Native, seat-gated |
| Year-1 cost at 5 users | $12.99 | $8.99-$13.99 | $3,000-$18,000 |
| Connects to your POS / ERP | No – you type or paste the monthly figures | No | Yes, that is what you pay for |
| Direction-aware (LTB) scoring | Yes, per KPI, editable | Yes | Usually, with configuration |
| Works offline | Yes, completely | No | No |
The honest read: if your monthly retail numbers already arrive as a report from your POS or merchandising system and somebody currently retypes them into a slide deck, this workbook replaces the slide deck for the price of a lunch. If you need the numbers to arrive automatically from a live system, you need the paid tier and no spreadsheet will change that. DIY Home Improvement Stores KPI Dashboard in Excel
Who This Template Is For – and Who It’s Not For
It fits a multi-store DIY, hardware or home improvement chain running a monthly management review; a regional operations manager who wants comp sales, on-shelf availability, shrink and turnover on one page; a merchandising lead tracking private-label penetration and GMROI against plan; and a finance analyst who has to produce the same board pack every month and would rather change one dropdown.
It does not fit anyone expecting a live feed – the three input sheets are typed or pasted, and the workbook connects to nothing. It does not fit store-by-store or SKU-level analysis: this scorecard holds one chain-level figure per KPI per month, not a breakdown by branch, department or item. And it does not fit a team that wants to slice a transaction table by region, category and salesperson – that is the analytical dashboard line, linked above and below, and it is a genuinely different product.
How to Use the DIY Home Improvement Stores KPI Dashboard in Excel
- Open the workbook and land on Home. Every sheet is one click away. Read Read Me once – it is a one-page map of how the numbers are wired.
- Set your reporting year. Cell E3 on KPI Input – Actual is the first month of the year. Change it and the Target sheet, the Prior Year sheet, the month dropdown and every sheet title re-base themselves.
- Replace the sample numbers. Type or paste your own figures into KPI Input – Actual, KPI Input – Target and KPI Input – PY. Each sheet holds an MTD and a YTD column per month, so you keep control of how your year-to-date is defined rather than inheriting somebody’s assumption.
- Edit the KPI list if you want different metrics. On KPI Definition, rename a KPI, clear a row to remove it, or fill one of the 7 empty rows to add one. Set its unit, its UTB/LTB type, its owner and its priority. Every other sheet follows automatically.
- Pick a month on KPI Dashboard. Cell D6. Read the seven cards, then read down the 15 rows.
- Drill into anything red. Go to KPI Trend, choose that KPI in cell B4, and read the twelve-month table and the two charts to see whether it is a one-month wobble or a trend.
- Check the group picture. KPI Analysis shows which KPI group is dragging and which five KPIs sit at the bottom for the year. DIY Home Improvement Stores KPI Dashboard in Excel
- Adjust the bands if your governance differs. The 100 / 95 thresholds sit in columns L and U on KPI Dashboard.
Real-World Use Cases
Marcus, Regional Operations Manager, 14-store hardware chain. His monthly review used to be six tabs and a slide deck. He now pastes the month’s numbers into the three input sheets on the first Tuesday, sets the month picker and walks the leadership team down 15 rows. In the shipped sample December reads 7 On Target, 5 At Risk and 3 Missed for the year to date, with average achievement of 94.8% MTD and 99.2% YTD – a picture the whole room can argue with in one glance instead of one page at a time.
Priya, Merchandising Director. She lives on two rows. Private-Label Penetration is running at 101.6% of its YTD target while GMROI sits at 93.0% – the single worst YTD performer in the sample – which tells her the own-brand push is landing but the margin return on inventory is not following it. She opens KPI Trend on GMROI to see whether that gap has been widening all year before she takes it to the buying team. DIY Home Improvement Stores KPI Dashboard in Excel
Dan, EHS and Loss Prevention lead. His two KPIs both run lower-the-better, so a falling number scores above 100% and shows a green down-arrow. Recordable Safety Incidents at 95.1% YTD is At Risk while Inventory Shrink Rate at 101.4% is On Target – two very different conversations that a naive percentage would have flattened into one.DIY Home Improvement Stores KPI Dashboard in Excel
Frequently Asked Questions
Does this connect to my POS, ERP or inventory system?
No. This is an input-driven scorecard. You type or paste your monthly figures into the three input sheets and the workbook does the arithmetic, the scoring, the traffic lights and the charts. There is no connector, no Power Query and no data model. That is deliberate – it is why the file opens instantly on any machine and why nothing breaks when a source system changes – but you should buy it knowing it.
How many KPIs does it actually ship with?
Fifteen. Worth saying plainly, because the Home page and the Read Me page both carry a leftover line that says “14 KPIs” – a text typo in the two help pages. The working sheets are all correct: KPI Definition lists 15, the scorecard shows 15 rows, and the Total KPIs Tracked card reads 15. The sheets are wired for 22, so 7 rows are live and empty for your own additions.
Can I add my own KPIs or rename these?
Yes, and it needs no formula work. Fill the next empty row on KPI Definition and the three input sheets, the scorecard, the trend picker and the analysis page all pick it up. To rename, change it on KPI Definition only – every other sheet reads the name from there. To remove one, clear its row and the summary cards recount themselves. To go past 22 KPIs you fill down the last data row on each sheet and widen two ranges, which the Read Me explains.
The KPI Definition sheet lists a review frequency – does that change the calculation?
No. Owner, Priority and Frequency are documentation columns. Inventory Shrink Rate is labelled Quarterly and On-Shelf Availability and Delivery On-Time Rate are labelled Weekly, but the input grid is monthly for every KPI without exception. Treat those columns as governance labels for your review calendar, not as switches.
Are there macros? Will my IT team block it?
No macros, no VBA, no add-ins, no Power Query and no data model – the file is a plain .xlsx. Every number on every page is a worksheet formula built from VLOOKUP, MATCH, INDEX and COUNTIF. It opens in Excel 2013 and later, in Microsoft 365 and in Excel for the web.
Can I see performance store by store?
Not in this workbook. It holds one chain-level figure per KPI per month. If you need to compare branches, categories or SKUs against each other, the analytical DIY Home Improvement Stores Dashboard in Excel is built over a transaction table with slicers and is the right tool – a number of buyers run both, the scorecard for the monthly review and the analytical dashboard for the digging.
Is the sample data real?
No. The workbook ships with twelve months of plausible 2025 figures, twelve months of targets and twelve months of 2024 prior-year figures purely so you can see every formula, chart and traffic light working before you type a single number. Replace it with your own on the three input sheets.
What exactly do I download?
One ZIP containing the .xlsx workbook and a user manual PDF. Instant download after checkout, lifetime access to the file, one payment, no subscription.
About the Author
Built by PK – Microsoft Certified Professional with 15+ years of Excel, Google Sheets, and Power BI experience. Founder of NextGenTemplates, reaching 300K+ subscribers across YouTube channels. Every template is hand-built and tested before release.
Explore Related Templates
- DIY Home Improvement Stores Dashboard in Excel – the analytical companion. Same industry, different job: pivots and slicers over a transaction table instead of a month-picker scorecard.
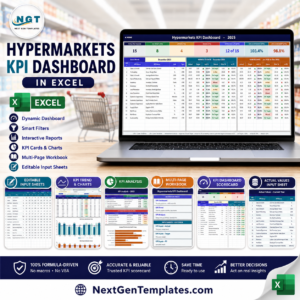
- Hypermarkets KPI Dashboard in Excel – the same scorecard engine tuned to big-box grocery and general merchandise.
- Online Furniture Retail KPI Dashboard in Excel – for the e-commerce side of a home and hardline business.
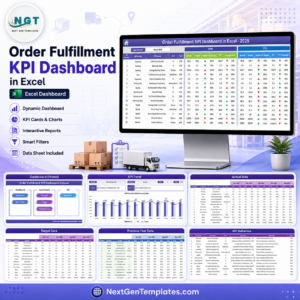
- Order Fulfillment KPI Dashboard in Excel – goes deeper on the delivery, BOPIS and special-order metrics this scorecard summarises in four rows.
- Garden Center Dashboard in Excel – the adjacent seasonal category, on the analytical line.
- DIY Home Improvement Stores Dashboard in Power BI – if your team has already standardised on Power BI.
- Browse every KPI Dashboard template or the full MS Excel catalogue.
Get the DIY Home Improvement Stores KPI Dashboard in Excel
$19.99 $12.99 – one payment, instant download, lifetime access to the file. No subscription, no seat count, no account to create. Every cell is editable and nothing is locked or hidden, so if your chain measures something this scorecard does not, you add it in two minutes on the KPI Definition sheet. Need it wired to a different KPI set or your own branding? Email [email protected] and we will build it around your metrics. DIY Home Improvement Stores KPI Dashboard in Excel
Last updated: 26 August 2026.





























Reviews
There are no reviews yet.