

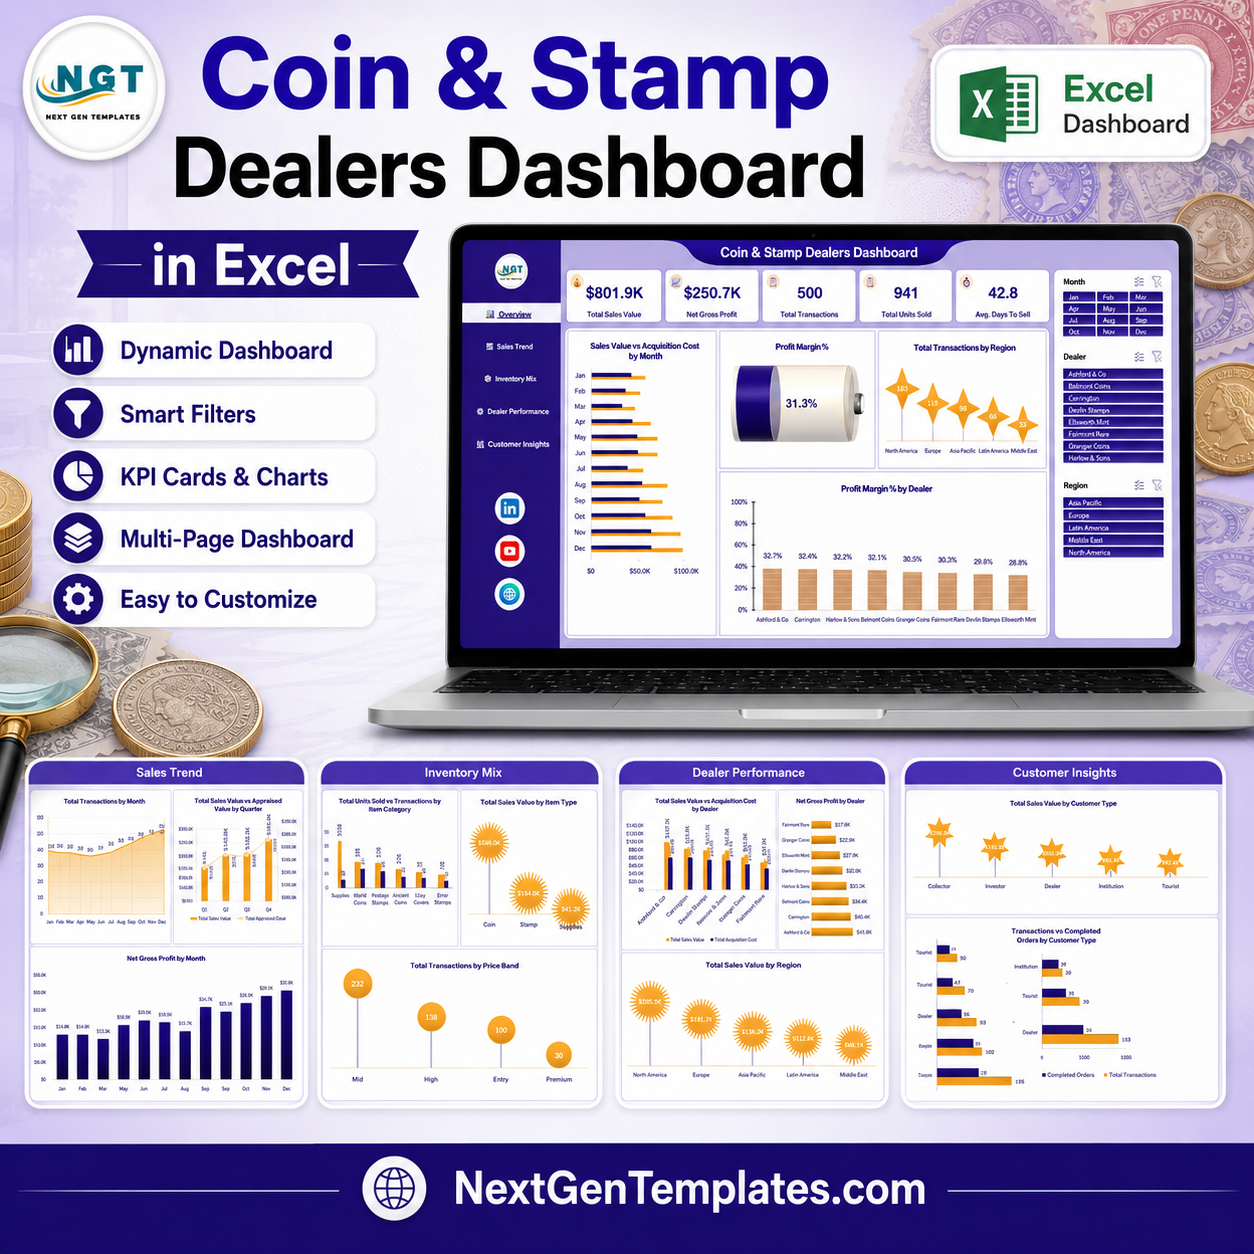
The Coin & Stamp Dealers Dashboard in Excel turns a dealer’s own transaction log into five linked report pages. Five hundred sample sale records across 25 columns feed 24 pivot tables and 19 charts, topped by KPI cards for Total Sales Value, Net Gross Profit, Total Transactions, Total Units Sold and Avg. Days To Sell. Three slicers – Month, Dealer and Region – are repeated and synced on every page, so one click re-filters the whole book. It is a plain .xlsx: no add-ins, no macros, no monthly fee, and it opens in Excel 2016, 2019, 2021 and Microsoft 365 on Windows or Mac. Instant download, lifetime access and free updates, from a template library used by 300K+ subscribers across our YouTube channels.
Read this before you buy. This workbook is a record-keeping and reporting tool. It does not grade, authenticate, certify, appraise or value coins, stamps or supplies. It ships no price guide, catalogue value, population report or market data, and nothing in it is investment advice. Condition Grade, Certification, Appraised Value and Condition Rating are columns you type in from your own records; the dashboard only totals, averages and charts what you entered. It is not affiliated with, endorsed by, or connected to any grading service, auction house or price-guide publisher.
Key Features of the Coin & Stamp Dealers Dashboard in Excel
- Five report pages reachable from a fixed left-hand navigation rail – Overview, Sales Trend, Inventory Mix, Dealer Performance and Customer Insights.
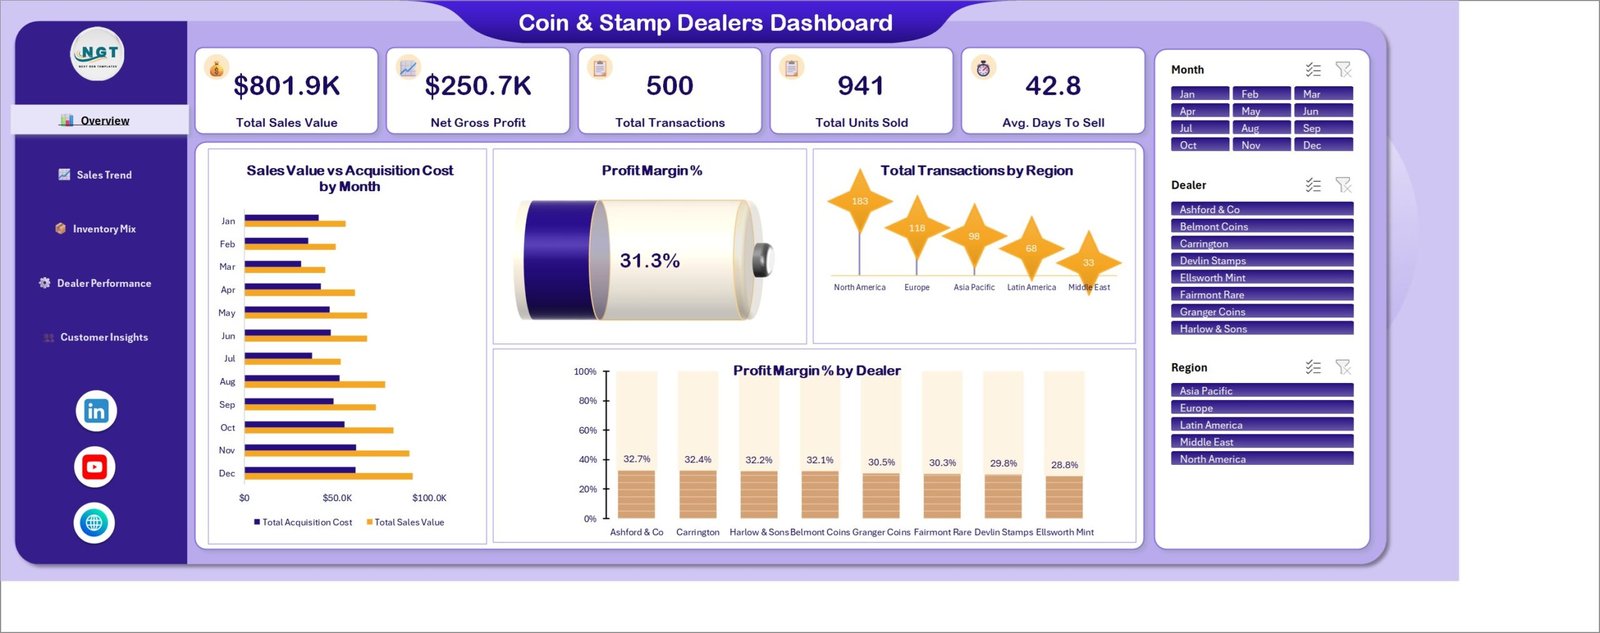
- Five KPI cards on the Overview page. In the sample data they read $801.9K Total Sales Value, $250.7K Net Gross Profit, 500 Total Transactions, 941 Total Units Sold and 42.8 Avg. Days To Sell.
- Three page-synced slicers – Month (Jan-Dec), Dealer (8 names) and Region (5 regions). Selecting a slicer on one page moves the same selection on all five.
- 24 pivot tables parked on a hidden-away Support sheet, so the report pages stay clean and nothing needs re-pointing when your row count changes.
- 19 charts named for the measure they show – Sales Value vs Acquisition Cost by Month, Profit Margin % by Dealer, Total Sales Value by Sales Channel, Avg. Days To Sell by Condition Grade and more.
- A 25-column Data sheet with 500 demo rows: Transaction ID, Sale Date, Dealer, Region, Item Category, Item Type, Condition Grade, Certification, Sales Channel, Customer Type, Payment Method, Order Status, Quantity, Acquisition Cost, Sale Price, Appraised Value, Days In Inventory, Condition Rating, plus derived Month, Year, Quarter and Price Band helpers.
- Gross-profit maths you can audit – Net Gross Profit is Sale Price minus Acquisition Cost, and Profit Margin % is that figure over Total Sales Value. In the demo data it works out at 31.3%.
What’s Inside the Coin & Stamp Dealers Dashboard in Excel
1. Overview
The landing page. Five KPI cards sit above four visuals: Sales Value vs Acquisition Cost by Month, a Profit Margin % gauge, Total Transactions by Region and Profit Margin % by Dealer. It answers “how did the shop do” in one screen before you drill anywhere.
2. Sales Trend
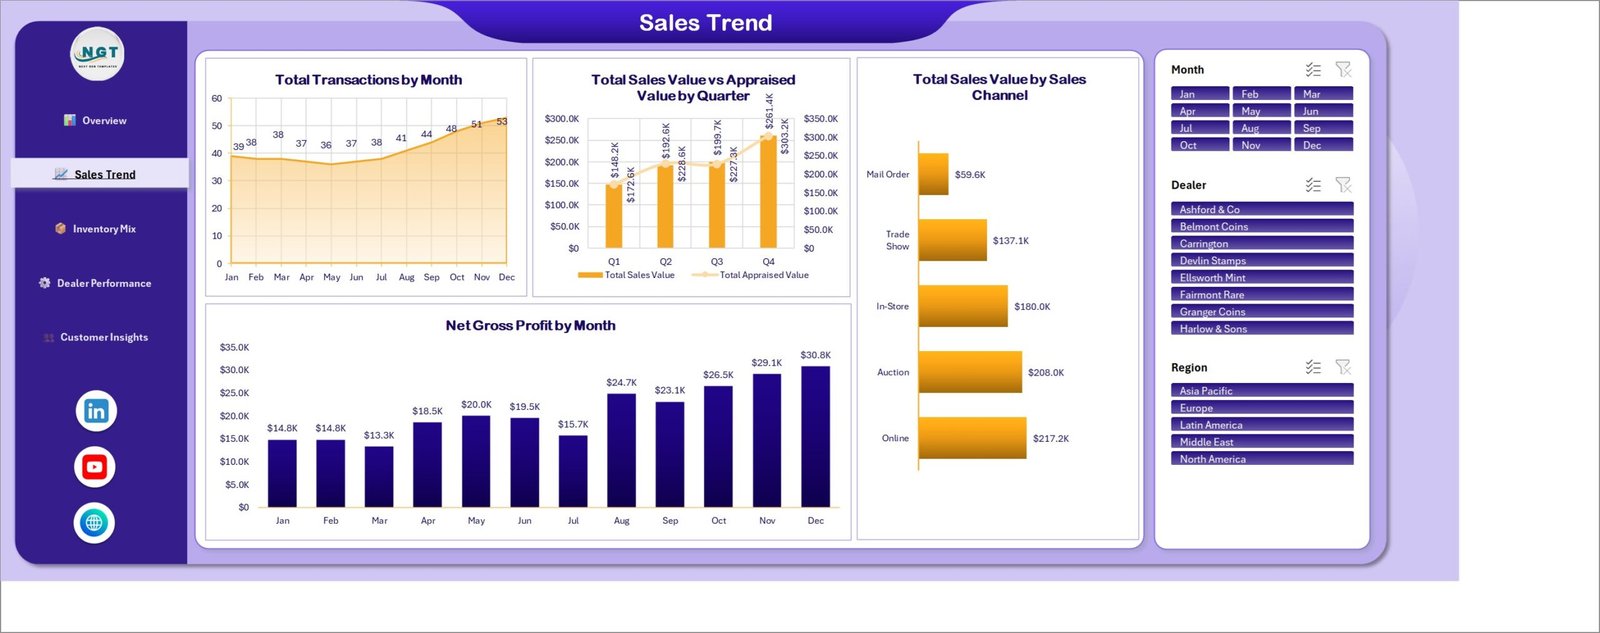
Four time-and-channel views: Total Transactions by Month, Total Sales Value vs Appraised Value by Quarter, Total Sales Value by Sales Channel and Net Gross Profit by Month. The channel bar is often the most useful one – in the demo data Online ($217.2K) and Auction ($208.0K) clear more than Mail Order ($59.6K).
3. Inventory Mix
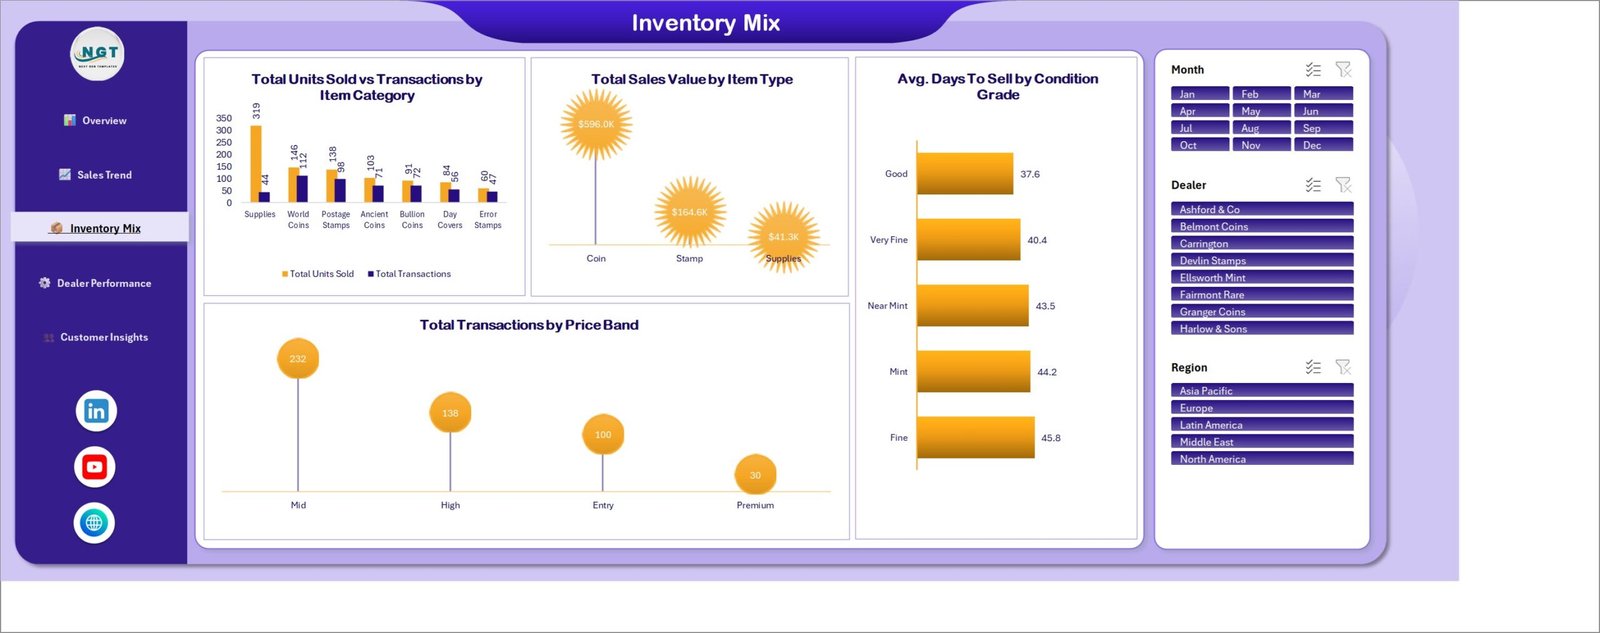
What is actually moving. Total Units Sold vs Transactions by Item Category covers World Coins, Ancient Coins, Bullion Coins, Postage Stamps, Error Stamps, Day Covers and Supplies. Beside it, Total Sales Value by Item Type, Avg. Days To Sell by Condition Grade and Total Transactions by Price Band (Entry, Mid, High, Premium). Condition Grade here is the label you typed on the row, nothing the workbook assessed.
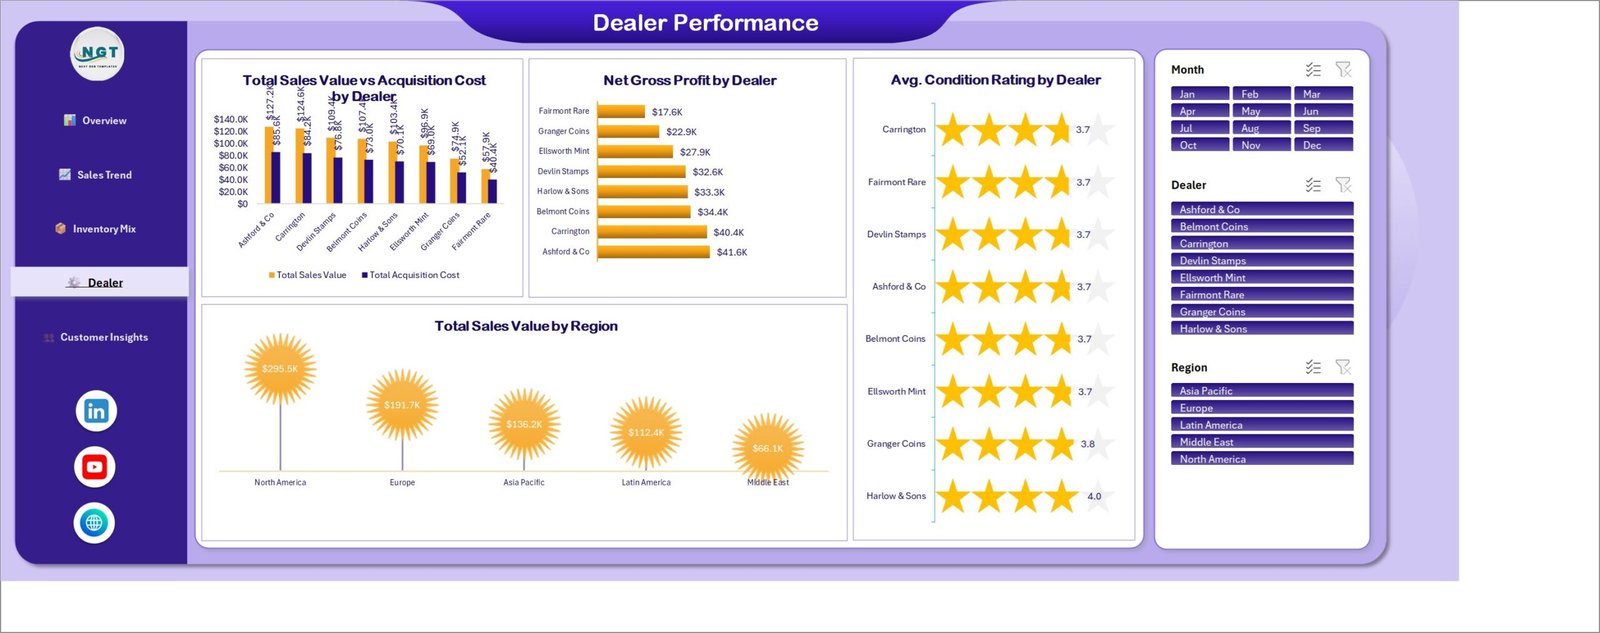
4. Dealer Performance
Eight dealer names compared four ways: Total Sales Value vs Acquisition Cost by Dealer, Net Gross Profit by Dealer, Avg. Condition Rating by Dealer as a star display, and Total Sales Value by Region. Swap the demo names for your own consignors, buyers or shop locations – the pivots follow whatever you type.
5. Customer Insights
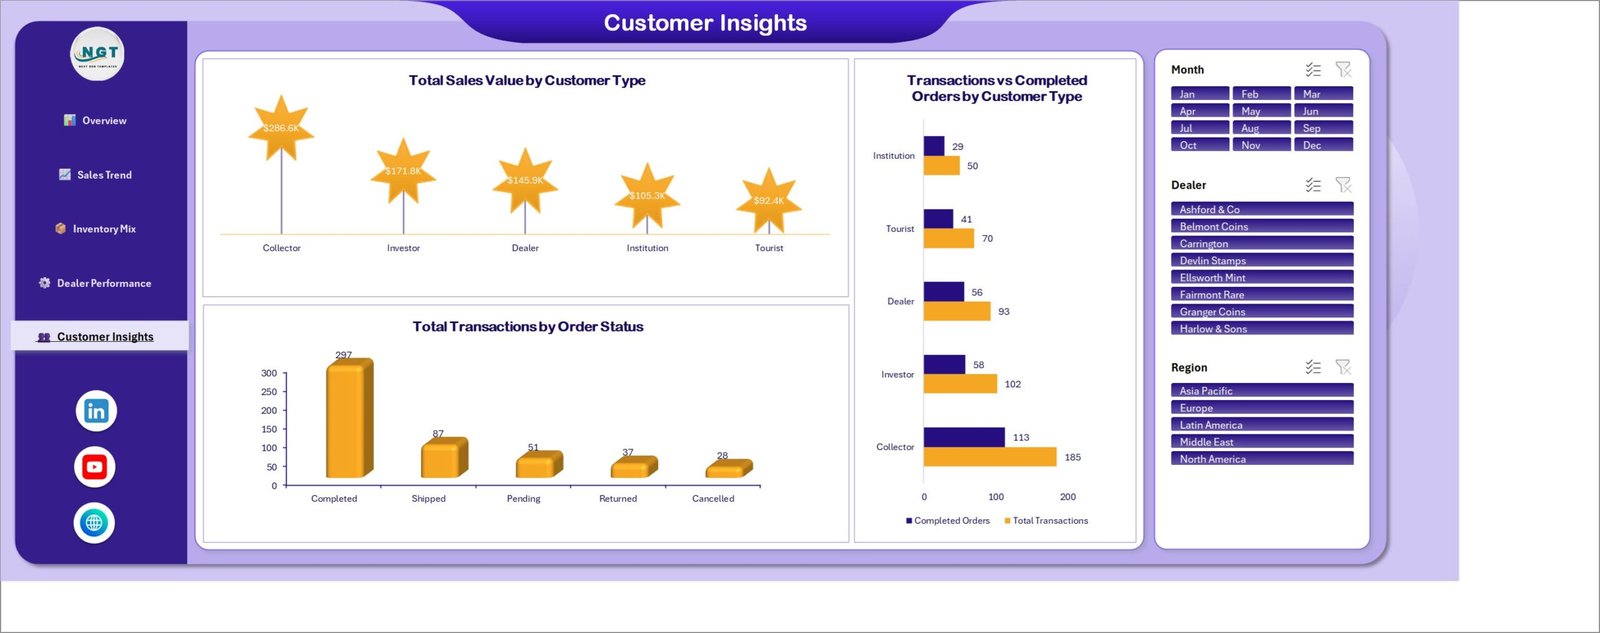
Who is buying. Total Sales Value by Customer Type splits Collector, Investor, Dealer, Institution and Tourist; Transactions vs Completed Orders by Customer Type shows how many of each group’s orders actually closed; Total Transactions by Order Status breaks the 500 rows into Completed, Shipped, Pending, Returned and Cancelled. “Investor” is only a customer label you can rename – it implies nothing about returns.
Plus two working sheets
Data holds the 25-column transaction log you edit. Support holds all 24 pivot tables that feed the charts. A user manual PDF ships in the same ZIP.
Coin & Stamp Dealers Dashboard vs. Google Sheets vs. Paid Inventory SaaS – Where This Fits
| This Excel Dashboard | DIY Google Sheets build | Paid inventory SaaS (Zoho Inventory, NetSuite) | |
|---|---|---|---|
| Cost | $17.99 once | Free, plus your build time | $39-$999 per month |
| Platform | Excel 2016+ / Microsoft 365, Windows or Mac | Browser | Browser plus mobile app |
| Setup time | Under 30 minutes – paste your rows, refresh | 10-30 hours to build pivots and charts | 1-6 weeks of onboarding |
| Real-time team collaboration | Via OneDrive / SharePoint co-authoring | Yes, natively | Yes |
| Mobile access | Excel mobile app, view and light edits | Yes | Yes |
| Customizable fields | Yes – add columns, re-point the pivots | Yes | Limited to the vendor’s schema |
| Share with a link | Yes, once stored in OneDrive | Yes | Yes |
| Year-1 cost at 5 users | $17.99 | $0 plus 10-30 hours of labour | $2,340-$11,988 |
| Grading / authentication built in | No – you type the labels | No | No |
| Works offline on a shop laptop | Yes | No | No |
Who This Template Is For – and Who It’s Not For
A good fit if you are an independent coin or stamp dealer, a small numismatic or philatelic shop, a collectibles booth that sells across several channels, an estate or consignment dealer who needs a monthly margin picture, or a bookkeeper who already receives the shop’s sale log as a spreadsheet.
Not the right buy if you need a point-of-sale till, barcode scanning or a live e-commerce connection; if you want the file to look up catalogue values, population reports or auction results; if you want it to grade, certify or authenticate anything; if you need multi-currency conversion (the demo book is single-currency); or if you are looking for buy/sell recommendations or a portfolio-return calculator – this file does none of that, by design.
How to Use the Coin & Stamp Dealers Dashboard in Excel
- Unzip the download and open the .xlsx in Excel. Read the included user manual PDF first – it is two minutes well spent.
- Go to the Data sheet. Keep row 3 (the headers) and delete the 500 demo rows beneath it.
- Paste your own transactions. Every row needs at minimum a Sale Date, Dealer, Region, Item Category, Item Type, Quantity, Acquisition Cost and Sale Price – the rest are optional labels.
- Fill Condition Grade, Certification and Appraised Value from your own records or invoices. The workbook never populates these for you.
- Press Ctrl + Alt + F5 to refresh all pivot tables. Every KPI card and chart on all five pages updates together.
- Use the Month, Dealer and Region slicers to filter. Because they are synced, a Region click on Overview carries through to Customer Insights.
- Renaming a category? Change it in the Data sheet, refresh, and the axis labels follow. To add a brand-new column, add it on Data, then add it to the relevant pivot’s field list on Support.
Real-World Use Cases
Miriam runs a two-room coin shop and a weekend table at three shows a year. She logs every sale in one sheet on Sunday night. The Sales Channel bar tells her the trade-show table cleared $137.1K-equivalent against her online listings, and the Net Gross Profit by Month column chart shows her which months carried the year. She reprices her show inventory on that, not on a hunch.
Devan buys estate stamp collections and re-sells them in lots. He cares about Avg. Days To Sell by Condition Grade because his cash is tied up in stock. When “Fine” lots average 45.8 days against 37.6 for “Good”, he knows where his working capital is sitting – the labels are his own, and the workbook just measures how long the rows carrying them took.
Priya keeps the books for a family firm with eight buyers. She sends the Dealer Performance page as a PDF each month. Total Sales Value vs Acquisition Cost per dealer, and Net Gross Profit per dealer, are the two numbers the partners actually argue about, and she no longer rebuilds the pivots by hand to produce them.
Frequently Asked Questions
Does this template grade, authenticate, appraise or value my coins and stamps?
No – to all four. Condition Grade, Certification, Appraised Value and Condition Rating are text and number columns you fill in yourself. The workbook has no grading logic, no authentication step, no catalogue or price-guide data and no connection to any grading service or auction platform. It totals and charts your entries, nothing more.
Is any of this investment advice?
No. Nothing in the file recommends what to buy, hold or sell, projects a future value, or calculates an investment return. “Investor” appears only as one of five editable customer-type labels.
Do I need macros, add-ins or a subscription?
None of the three. It is a plain .xlsx built on native pivot tables, pivot charts and slicers. Excel 2016 or later, Windows or Mac.
Can I add my own item categories, dealers or regions?
Yes. Type them into the Data sheet and refresh. The pivots and slicers pick up new values automatically – you do not need to edit any formula.
How many rows can it handle?
The demo ships 500. Pivot tables comfortably handle tens of thousands of rows; expect the refresh to take a couple of seconds once you are past about 50,000.
Does it connect to my POS, eBay listings or accounting software?
No. There is no live connection of any kind. You paste or export your sales into the Data sheet.
What exactly is in the download?
One ZIP containing the .xlsx workbook and an Excel Dashboard user manual PDF. No installer, no licence key.
About the Author
Built by PK – Microsoft Certified Professional with 15+ years of Excel, Google Sheets, and Power BI experience. Founder of NextGenTemplates, reaching 300K+ subscribers across YouTube channels. Every template is hand-built and tested before release.
Explore Related Templates
- Antique Dealers Dashboard in Excel – the closest sibling if you also trade furniture, art or general antiques.
- Auction Houses Dashboard in Excel – lot-level view for consignment and hammer-price reporting.
- Antique Dealers KPI Dashboard in Excel – the compact month-picker scorecard, a different template family from this analytical dashboard.
- NFT Art Marketplaces Dashboard in Excel – same build style for digital collectibles.
- Antique Dealers Dashboard in Power BI – if you would rather work in Power BI Desktop.
- Browse every Excel Dashboard template or the full MS Excel catalogue.
Get the Coin & Stamp Dealers Dashboard in Excel
Download it once, paste in your own sale log, and you have a five-page margin and inventory report you can send to a partner or an accountant the same afternoon. Lifetime access, free updates, no subscription. Prefer to see it explained first? The walkthrough is on youtube.com/@PKAnExcelExpert.
Last updated: 18 August 2026.



























Reviews
There are no reviews yet.