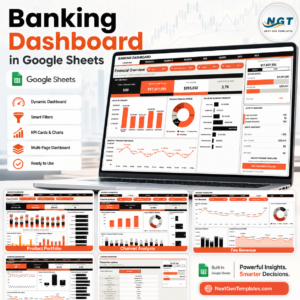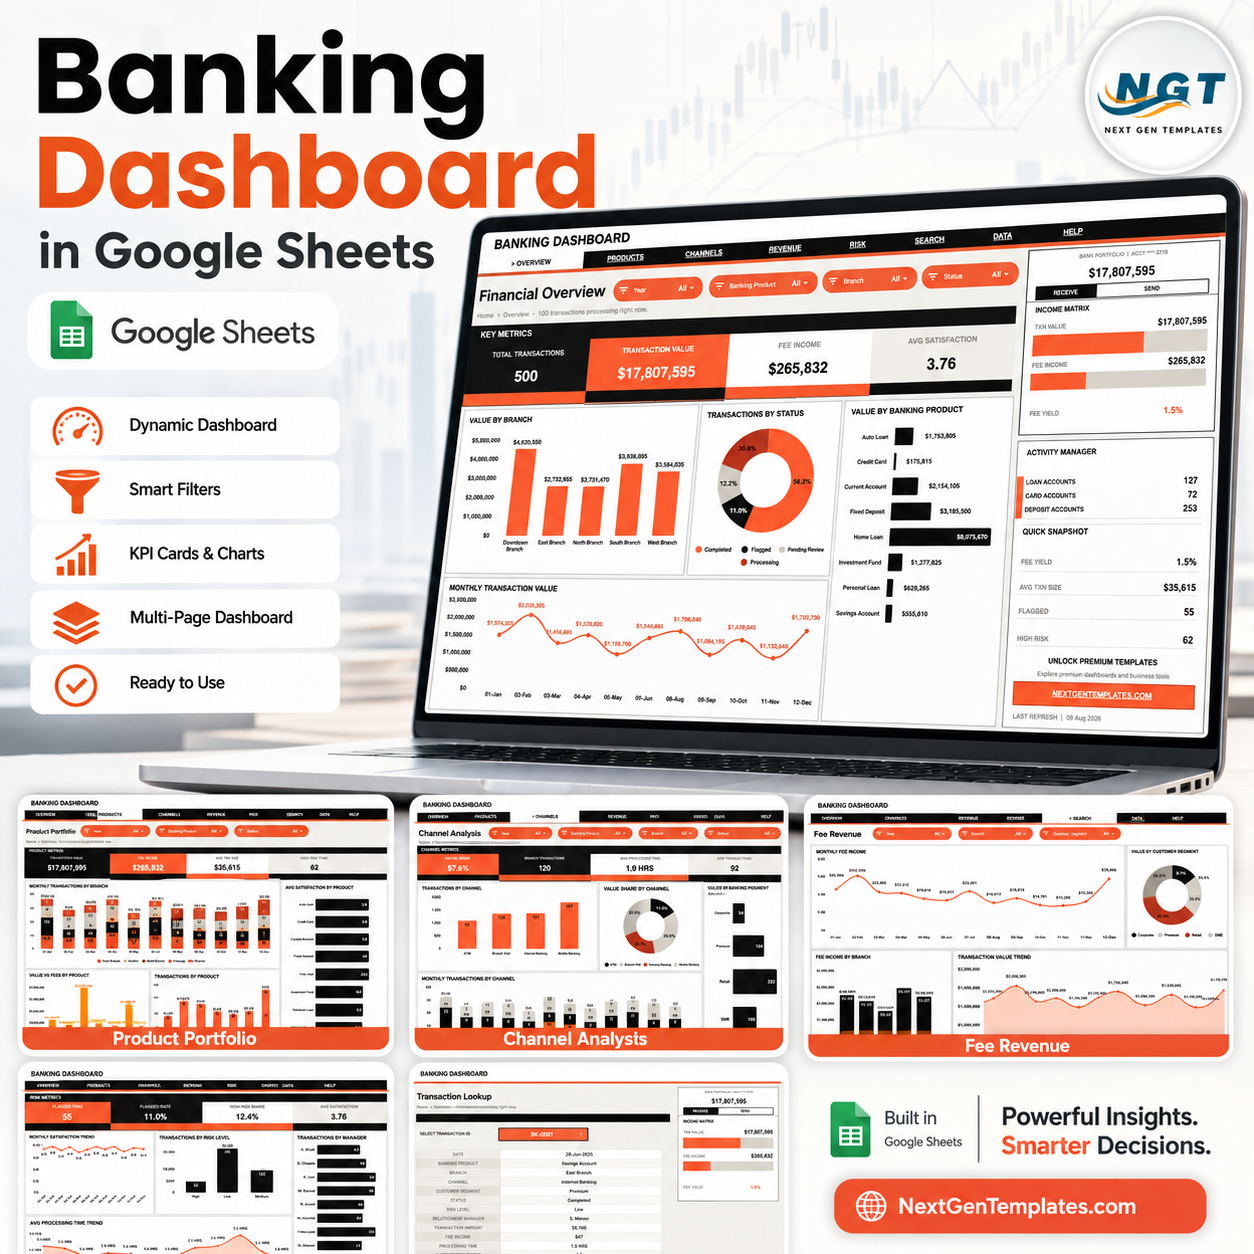
Banking Dashboard in Google Sheets gives banking teams 7 connected sheet tabs, 4 executive KPI cards, 21 chart views, native slicers, a transaction lookup screen, and an editable data sheet for just $9.99 during the launch sale. Branch managers, operations analysts, and finance leaders can open Google Sheets, replace sample rows, and review transactions, fee income, processing time, satisfaction, status, and risk without a paid SaaS rollout. Built by the NextGenTemplates team behind 10,000+ template users and 300K+ YouTube subscribers, it reduces buying risk with visible screenshots, editable structure, and a one-time price.
Key Features of Banking Dashboard in Google Sheets
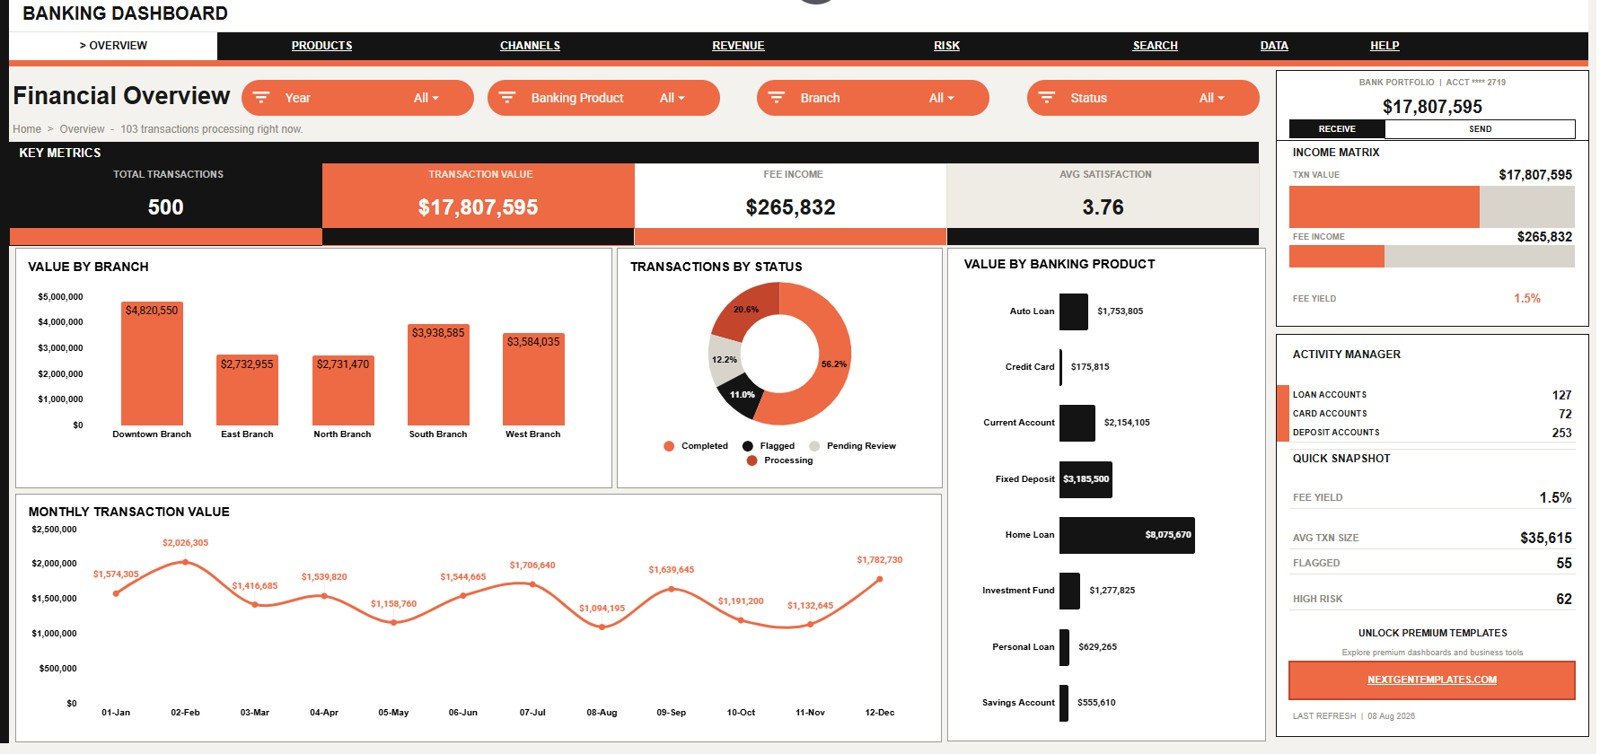
This template is built for transaction-level banking analysis. The Overview page shows Total Transactions, Transaction Value, Fee Income, and Avg Satisfaction so leaders can review activity, money movement, revenue contribution, and customer sentiment in one place.
Dedicated pages cover product portfolio, channel behavior, fee revenue, risk and compliance, transaction lookup, and raw data management. Slicers help users filter by branch, banking product, channel, customer segment, status, risk level, and relationship manager.
What’s Inside the Banking Dashboard in Google Sheets
Overview Page: KPI cards summarize Total Transactions, Transaction Value, Fee Income, and Avg Satisfaction, with charts for branch value, status, product value, and monthly value.
Product Portfolio: Analyze Monthly Transactions by Branch, Average Satisfaction by Banking Product, Transaction Value, Fee Income, and Transactions by Banking Product.

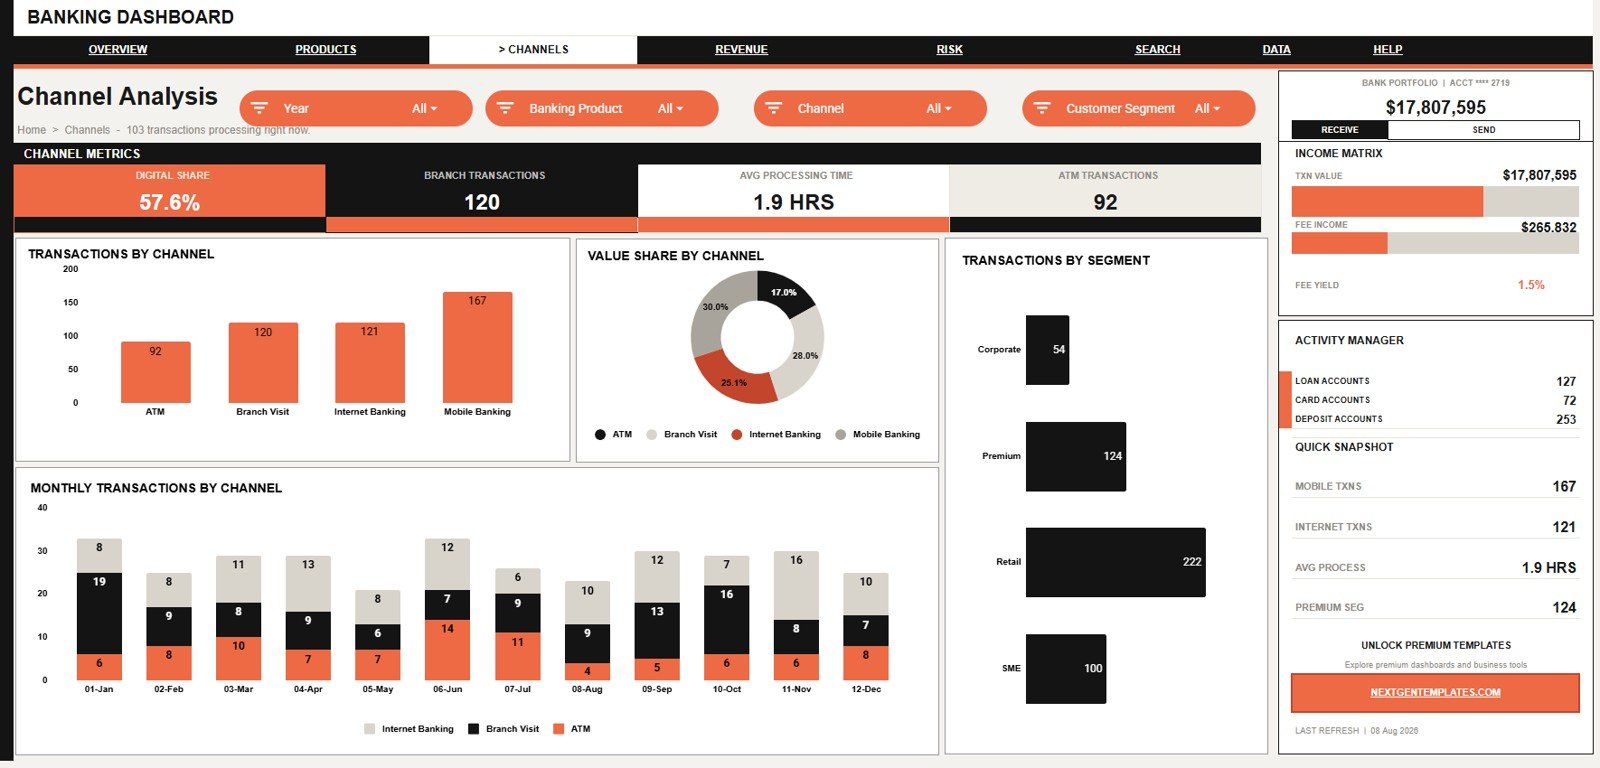
Channel Analysis: Compare Transactions by Channel, Transaction Value Share by Channel, Transactions by Customer Segment, and Monthly Transactions by Channel.
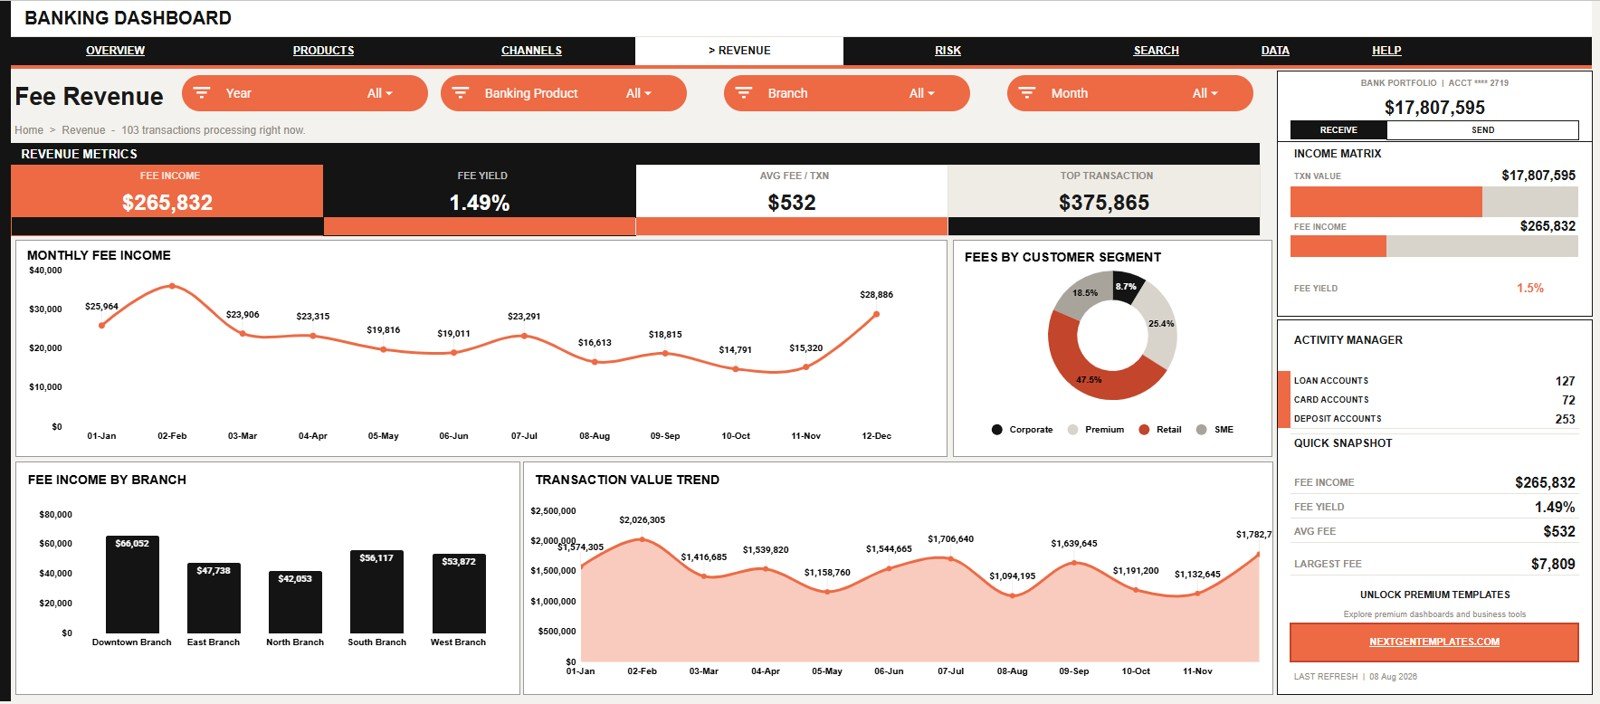
Fee Revenue: Review Fee Income by Month, Fee Income by Customer Segment, Fee Income by Branch, and Transaction Value by Month.
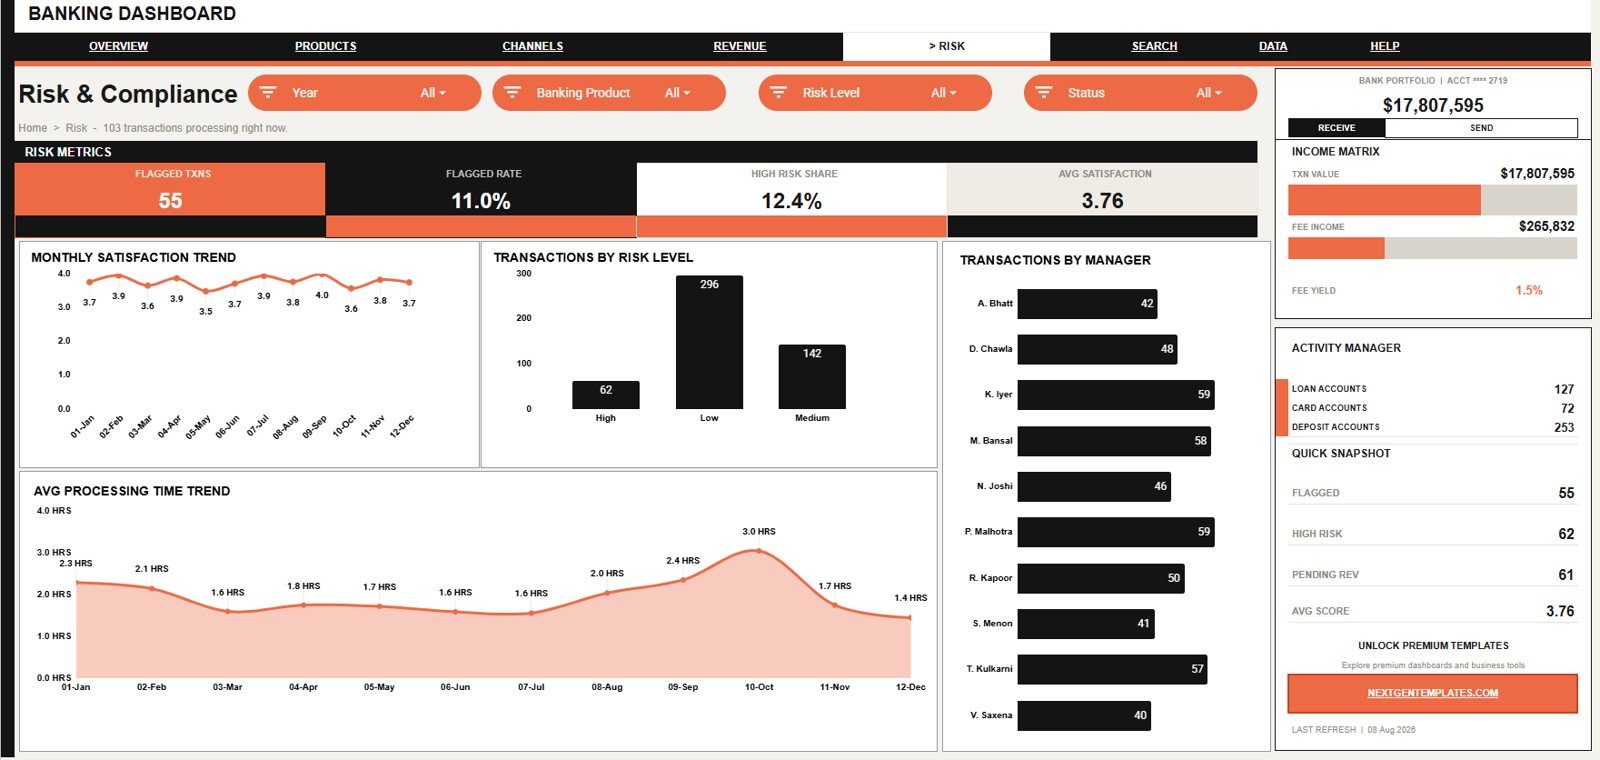
Risk & Compliance: Track Satisfaction Score by Month, Transactions by Risk Level, Transactions by Relationship Manager, and Average Processing Time by Month.
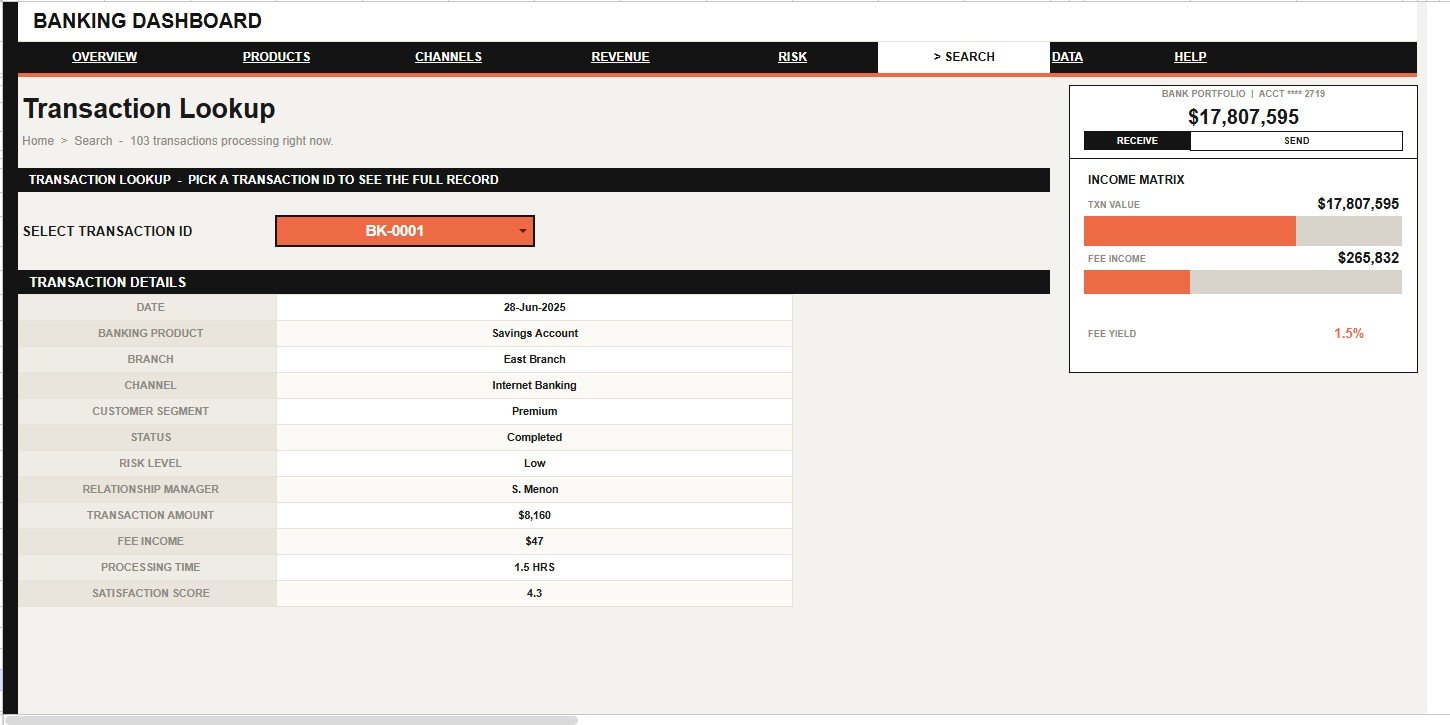
Transaction Lookup: Pick a transaction ID and see date, product, branch, channel, segment, status, risk, manager, amount, fee income, processing time, and satisfaction score.
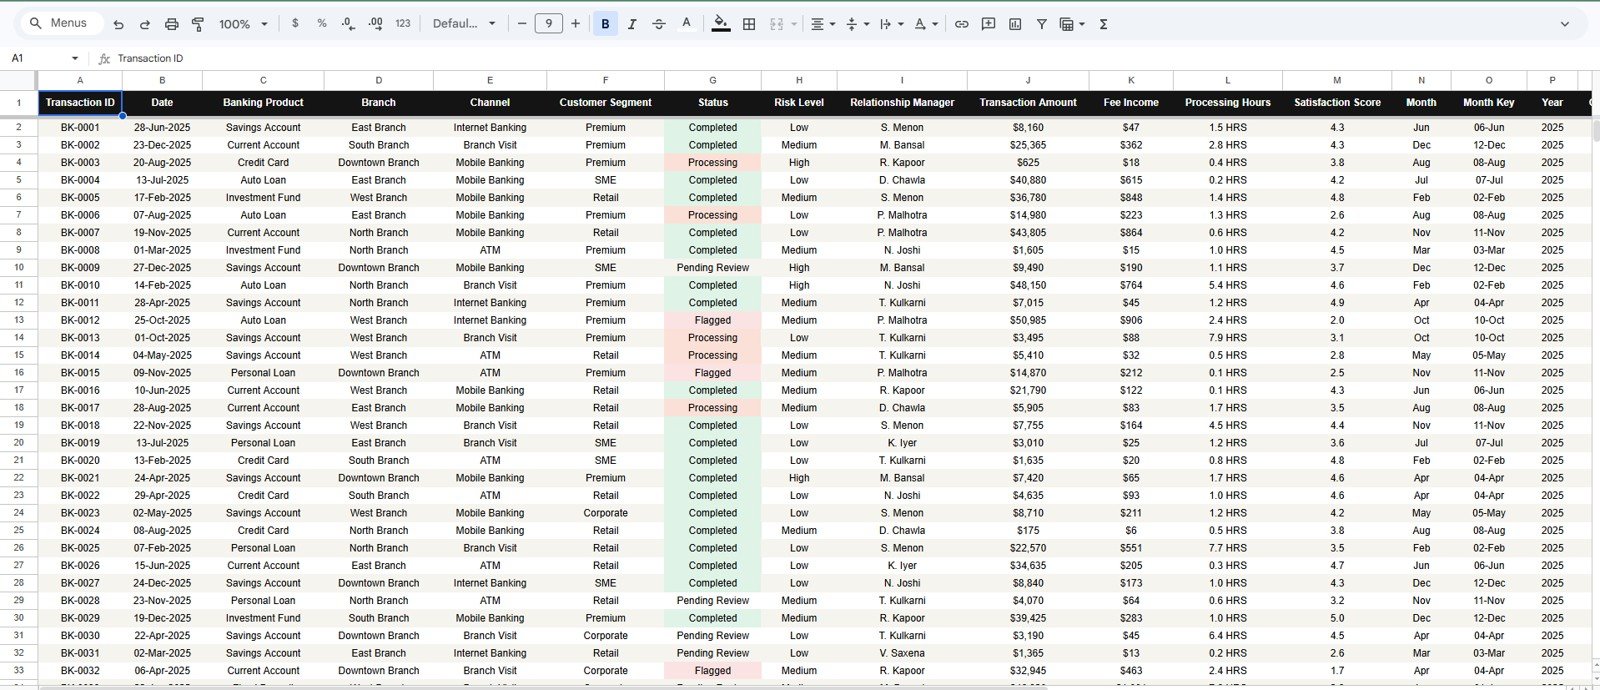
Data Sheet Tab: Add banking records in the same format so the connected cards, slicers, charts, and lookup view keep working.
Banking Dashboard in Google Sheets vs. Microsoft Excel Dashboard vs. Paid CRM/SaaS – Where This Fits
| Area | This Google Sheets template | Excel dashboard | Paid SaaS |
|---|---|---|---|
| Cost | $9.99 one-time sale price | Template plus Excel license | Recurring subscription |
| Platform | Google Sheets | Excel desktop or web | Vendor app |
| Setup time | Copy file and paste data | Download and refresh | Implementation project |
| Collaboration | Built into Google Sheets | Best through OneDrive | License based |
| Mobile access | Google Sheets app | Depends on setup | Usually included |
| Custom fields | Edit rows, labels, and charts | Edit workbook | Vendor limits apply |
| Share with link | Google Drive permissions | Microsoft sharing | Account based |
| Year-1 cost at 5 users | $9.99 before Workspace licensing | Template plus licenses | Often much higher |
| Transaction lookup | Included by transaction ID | Depends on file | Usually included |
| Best fit | Fast spreadsheet reporting | Excel-first teams | Enterprise live systems |
Who This Template Is For – and Who It’s Not For
Use it for branch reviews, product portfolio meetings, customer segment analysis, fee revenue checks, and risk follow-up. It fits branch managers, banking operations teams, finance analysts, product owners, relationship managers, and compliance reviewers.
It is not a replacement for core banking, payment processing, fraud detection, regulated reporting, or enterprise access controls. Use approved or anonymized data according to your internal policy.
How to Use the Banking Dashboard in Google Sheets
- Open the PDF guide and create your editable Google Sheets copy.
- Paste your records into the Data Sheet tab using the same columns.
- Review the Overview page to confirm totals, value, fees, and satisfaction.
- Use product, channel, fee, and risk pages to find performance drivers.
- Use Transaction Lookup when one record needs detailed review.
Real-World Use Cases
Priya, Branch Operations Manager: Compares branch value and status before a weekly branch call.
Michael, Finance Analyst: Reviews fee income by month, segment, and branch to explain revenue movement.
Asha, Risk and Compliance Lead: Checks risk levels, manager activity, processing time, and satisfaction trends.
Frequently Asked Questions
What does the Banking Dashboard in Google Sheets track?
It tracks transactions, value, fee income, satisfaction, branch results, product mix, channels, segments, risk, status, processing time, and lookup details.
Do I need advanced Google Sheets skills?
No. Replace sample records, use slicers, and review the connected dashboard pages.
Can I customize branches, products, and segments?
Yes. You can edit labels, source rows, formulas, and charts to match your reporting structure.
Does it include transaction lookup?
Yes. The search tab lets users select a transaction ID and view the full banking record.
Can multiple people use it?
Yes, through Google Sheets sharing, subject to your organization’s permissions and data policy.
Is it suitable for regulated banking data?
The template is a reporting layer only. Follow your own privacy, compliance, and security rules before adding live records.
About the Author
Built by PK – Microsoft Certified Professional with 15+ years of Excel, Google Sheets, and Power BI experience. Founder of NextGenTemplates, reaching 300K+ subscribers across YouTube channels. Every template is hand-built and tested before release.
Explore Related Templates
Browse Google Sheets Dashboard Templates and Google Sheets Financial Tools. Related products include Banking Operations KPI Dashboard in Google Sheets, Fintech Dashboard in Google Sheets, Banking Dashboard in Excel, and Mobile Banking Dashboard in Excel.
Watch the step-by-step video Demo:
Ready to review banking transactions, fees, products, channels, and risk in Google Sheets? Add the Banking Dashboard in Google Sheets to your toolkit today. Last updated: August 8, 2026.