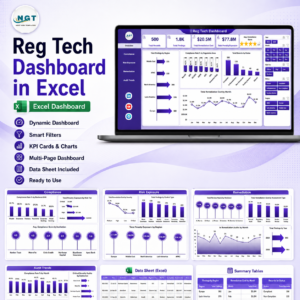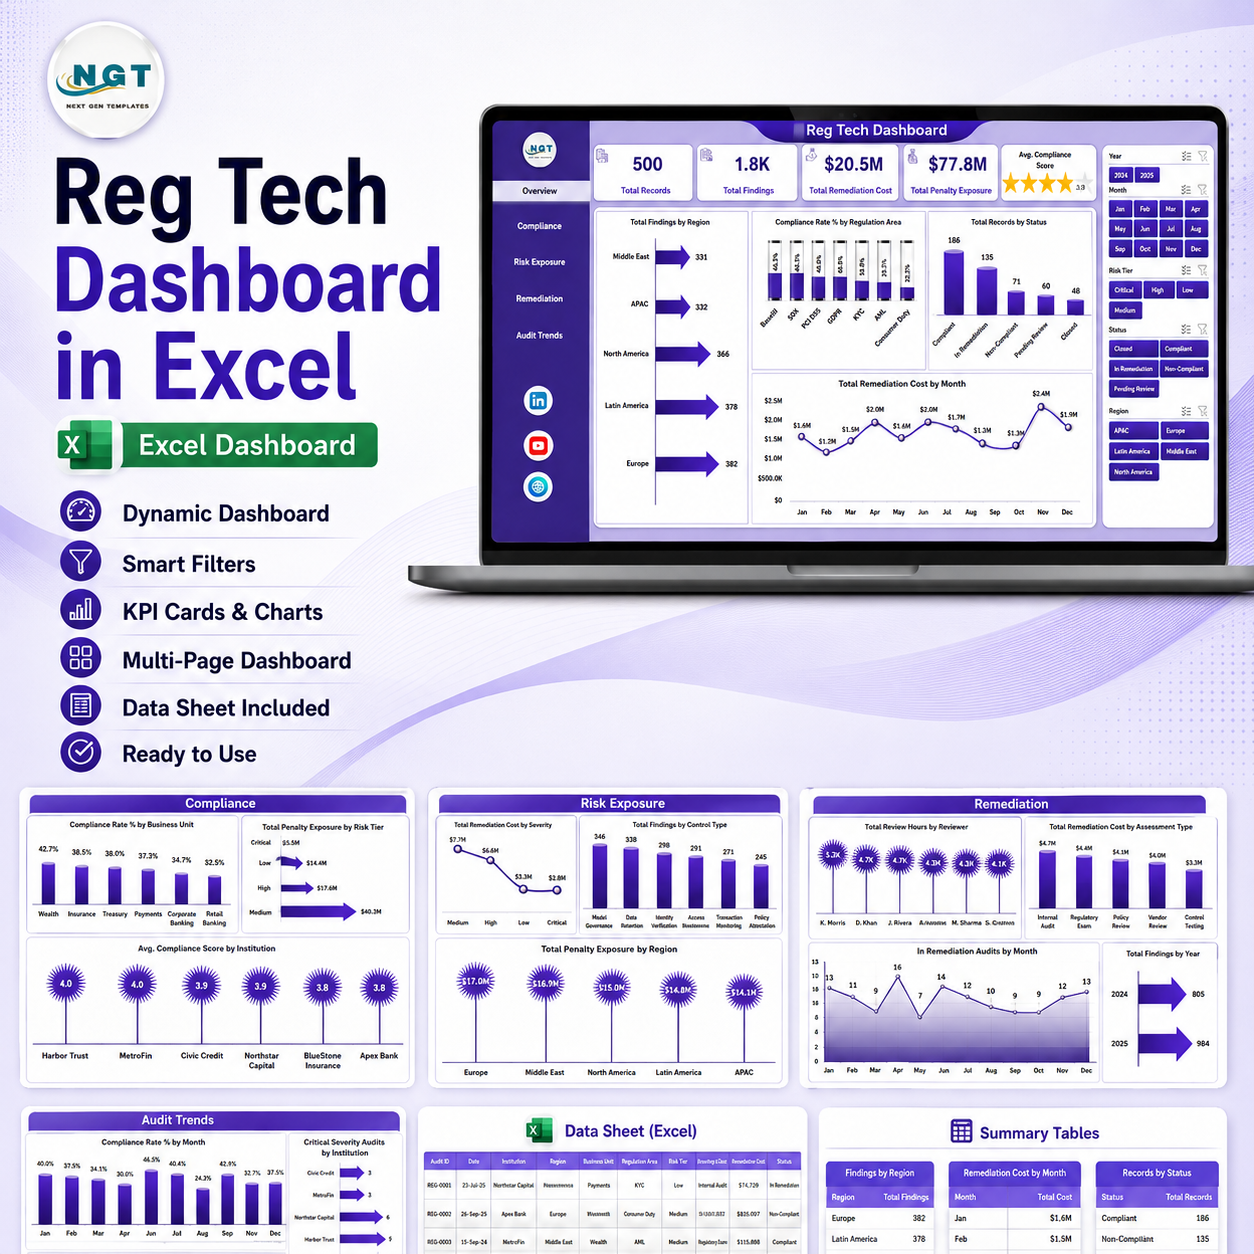


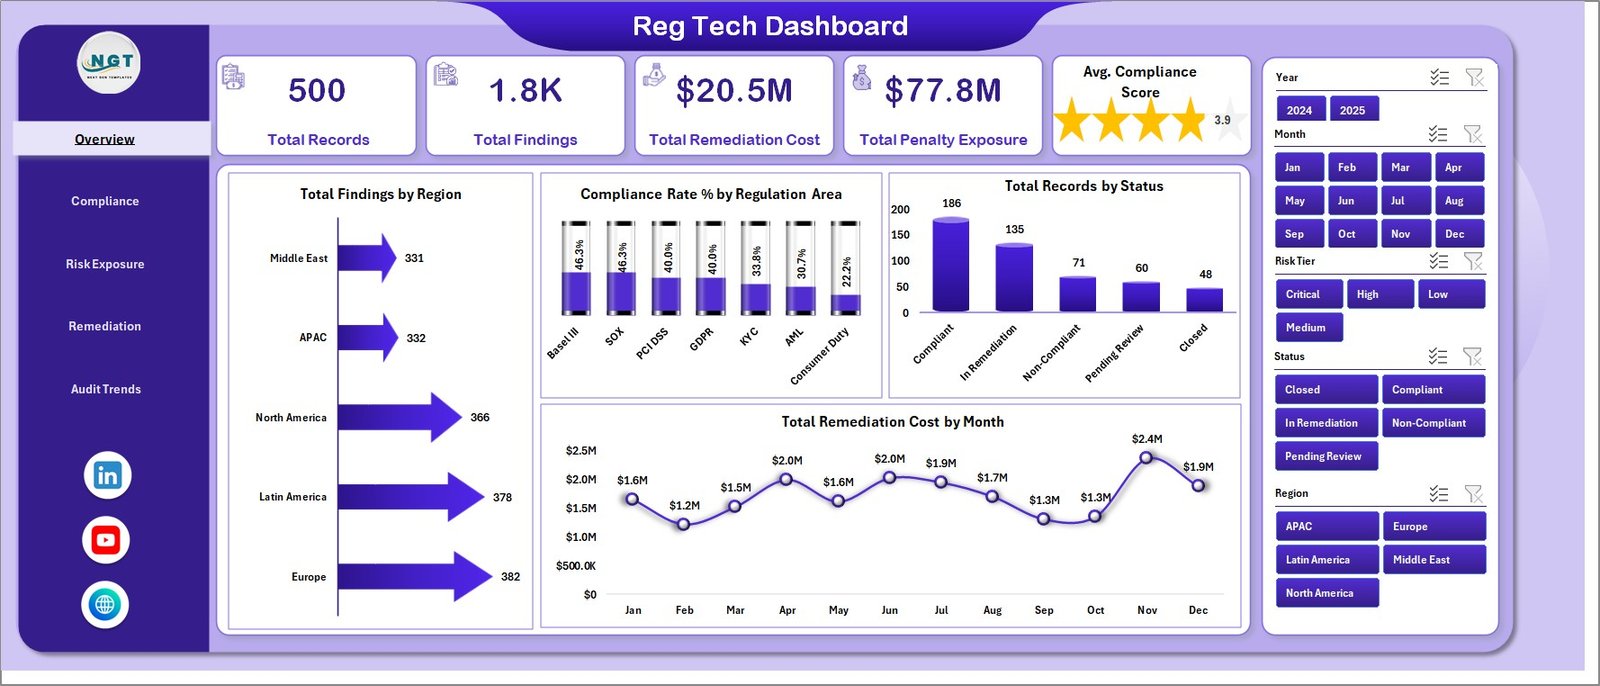
Reg Tech Dashboard in Excel helps compliance, audit, and risk teams monitor regulatory findings across 7 worksheet tabs, 5 executive KPI cards, and 19 chart views. Regulatory teams often track hundreds or thousands of audit records, remediation costs, penalty exposure values, review hours, risk tiers, institutions, reviewers, and business units. This workbook gives those signals a single Excel reporting layer with slicers, pivot-backed charts, and editable source data. Built by PK, backed by 15+ years of Excel, Google Sheets, and Power BI experience and 300K+ YouTube subscribers, this is a one-time digital download with no subscription and no per-user fee.
Reg Tech Dashboard in Excel
Key Features of Reg Tech Dashboard in Excel
- 7 Excel worksheet tabs for Overview, Compliance, Risk Exposure, Remediation, Audit Trends, Data, and Support.
- 5 high-level cards for Total Records, Total Findings, Total Remediation Cost, Total Penalty Exposure, and Avg. Compliance Score.
- 19 chart views covering region, regulation area, status, month, business unit, institution, risk tier, reviewer, severity, and control type analysis.
- Multiple slicers for fast filtering across the dashboard without rebuilding formulas or charts.
- Editable Data sheet so users can replace sample records with their own regulatory audit data.
- Support sheet with pivot tables that refresh the full dashboard after data changes.
What’s Inside the Reg Tech Dashboard in Excel
Overview Page: The Overview sheet starts with Total Records, Total Findings, Total Remediation Cost, Total Penalty Exposure, and Avg. Compliance Score. These cards give leaders a fast view of workload, financial exposure, and control health before moving into detailed analysis.
Total Findings by Region: This chart compares the number of findings across regions, helping managers identify where control gaps are concentrated. Compliance Rate % by Regulation Area shows which regulatory domains perform best or need attention.
Total Records by Status: This chart separates records by status so teams can see open, closed, remediated, or in-progress work. Total Remediation Cost by Month highlights the timing of remediation spend and supports monthly planning.
Compliance
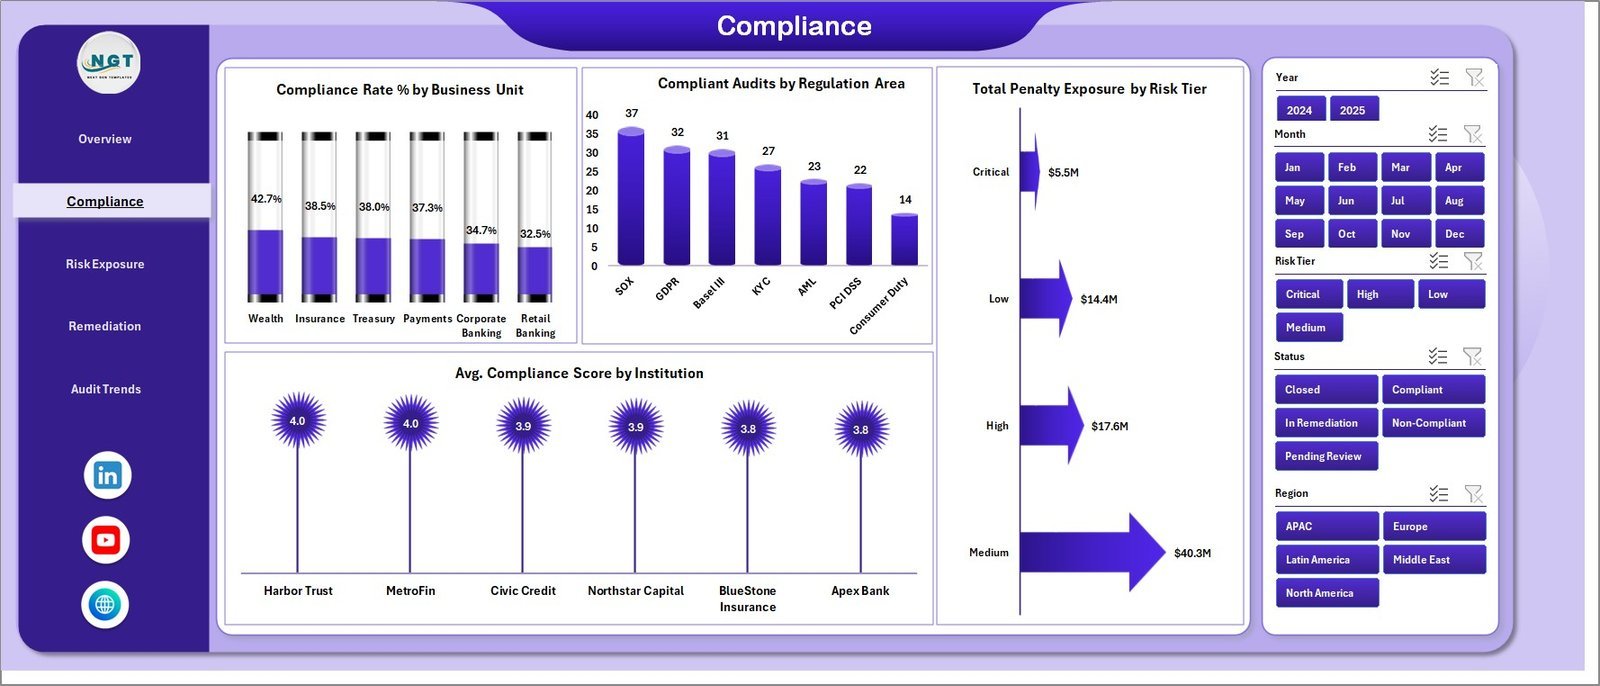
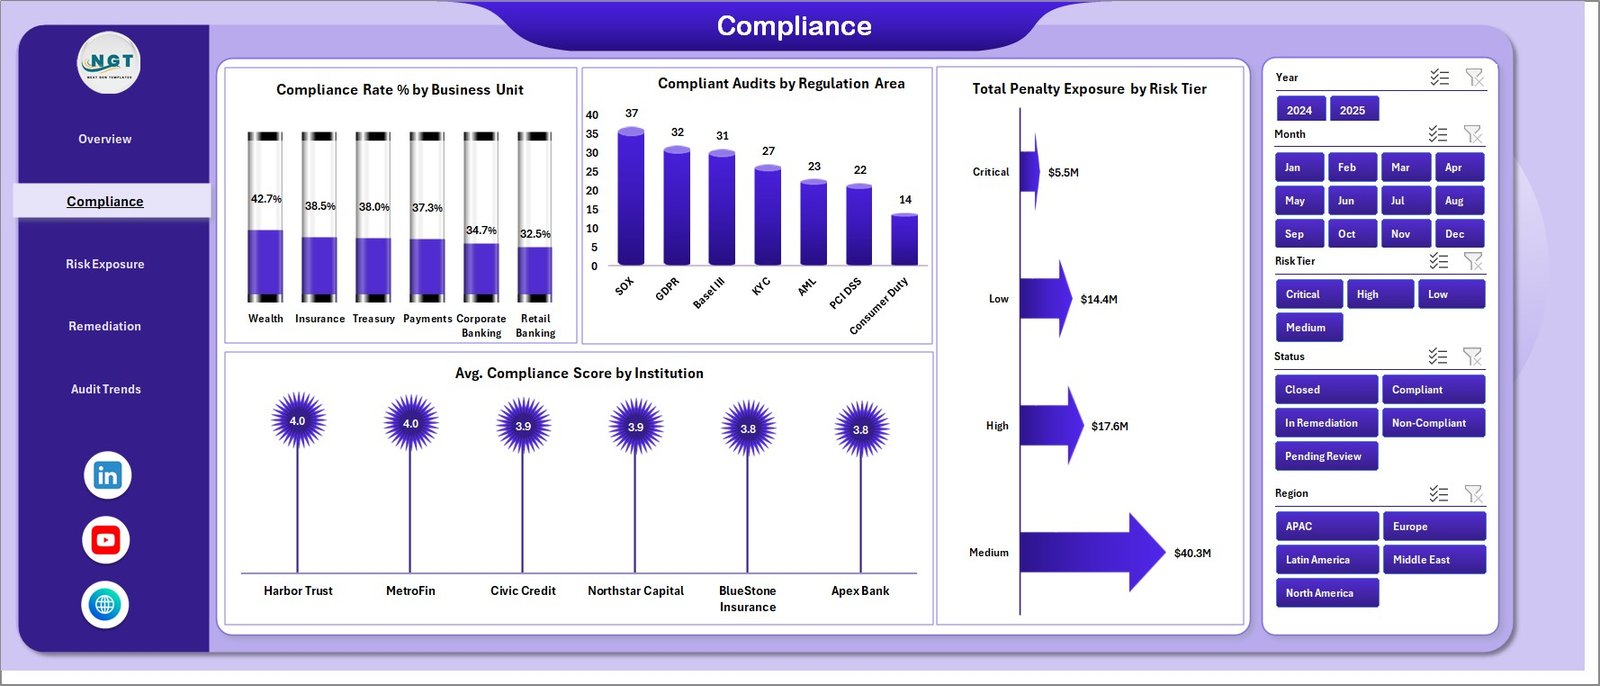
The Compliance tab reviews Compliance Rate % by Business Unit, Compliant Audits by Regulation Area, Total Penalty Exposure by Risk Tier, and Avg. Compliance Score by Institution. It is useful for comparing operating units, regulatory domains, institutions, and risk levels in one view.
Risk Exposure
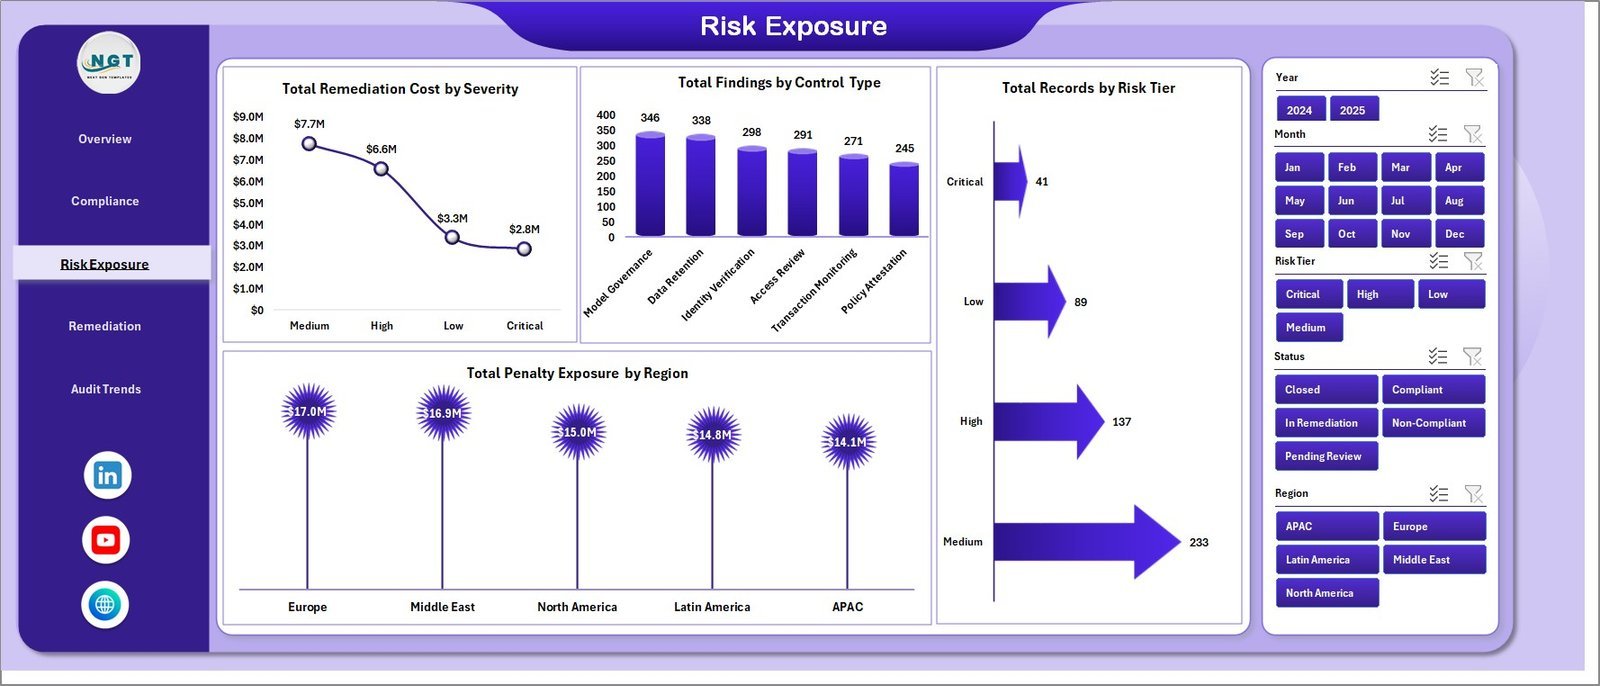
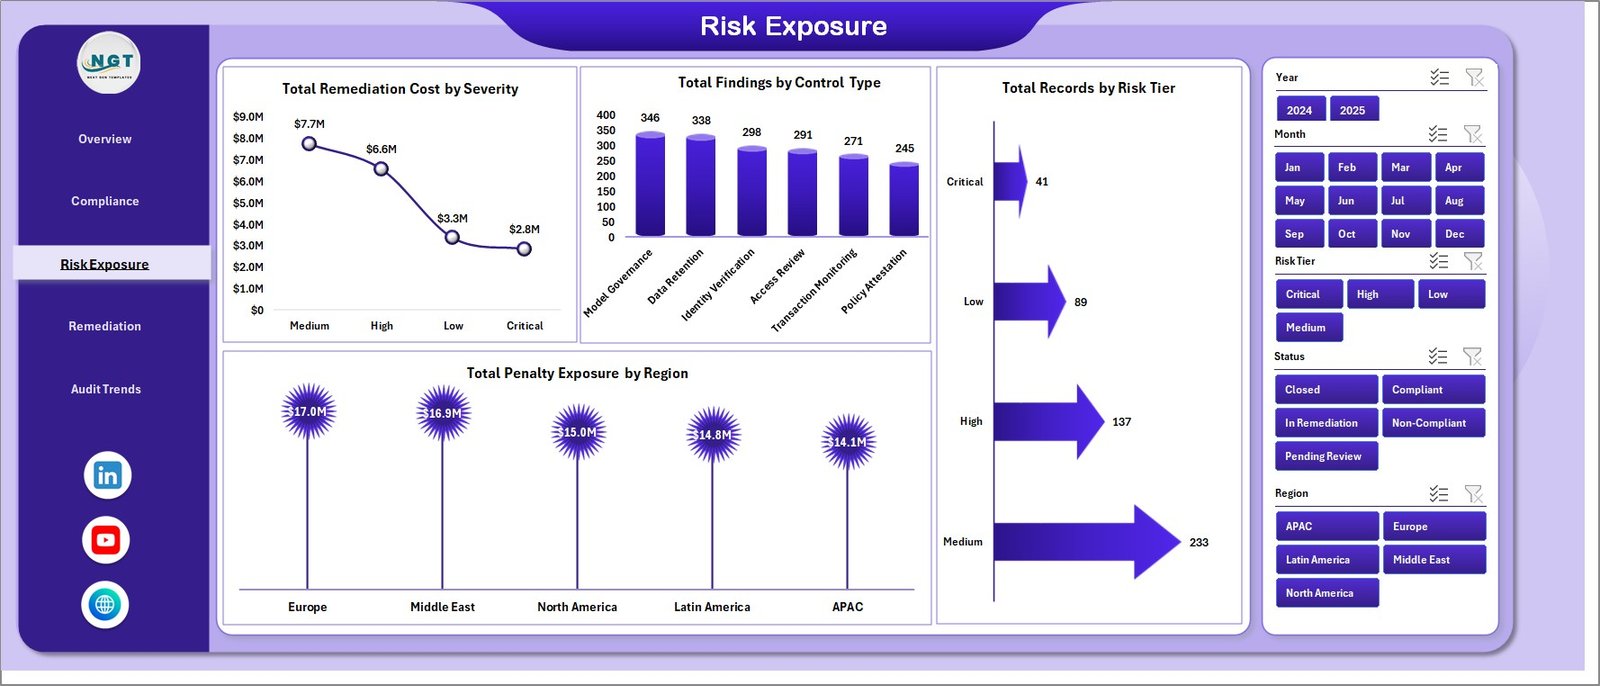
The Risk Exposure tab includes Total Remediation Cost by Severity, Total Findings by Control Type, Total Records by Risk Tier, and Total Penalty Exposure by Region. This page helps compliance teams prioritize high-cost, high-severity, and high-exposure areas.
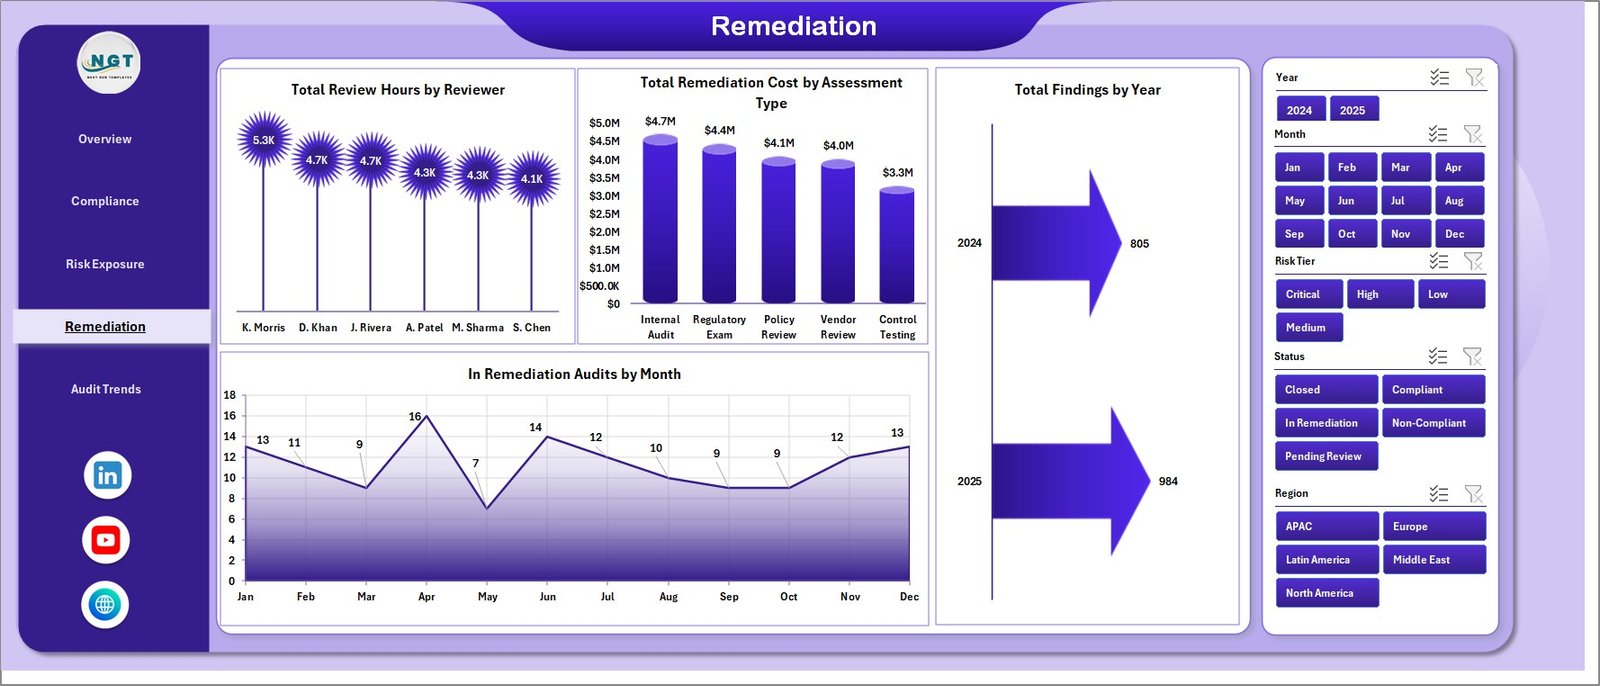
Remediation
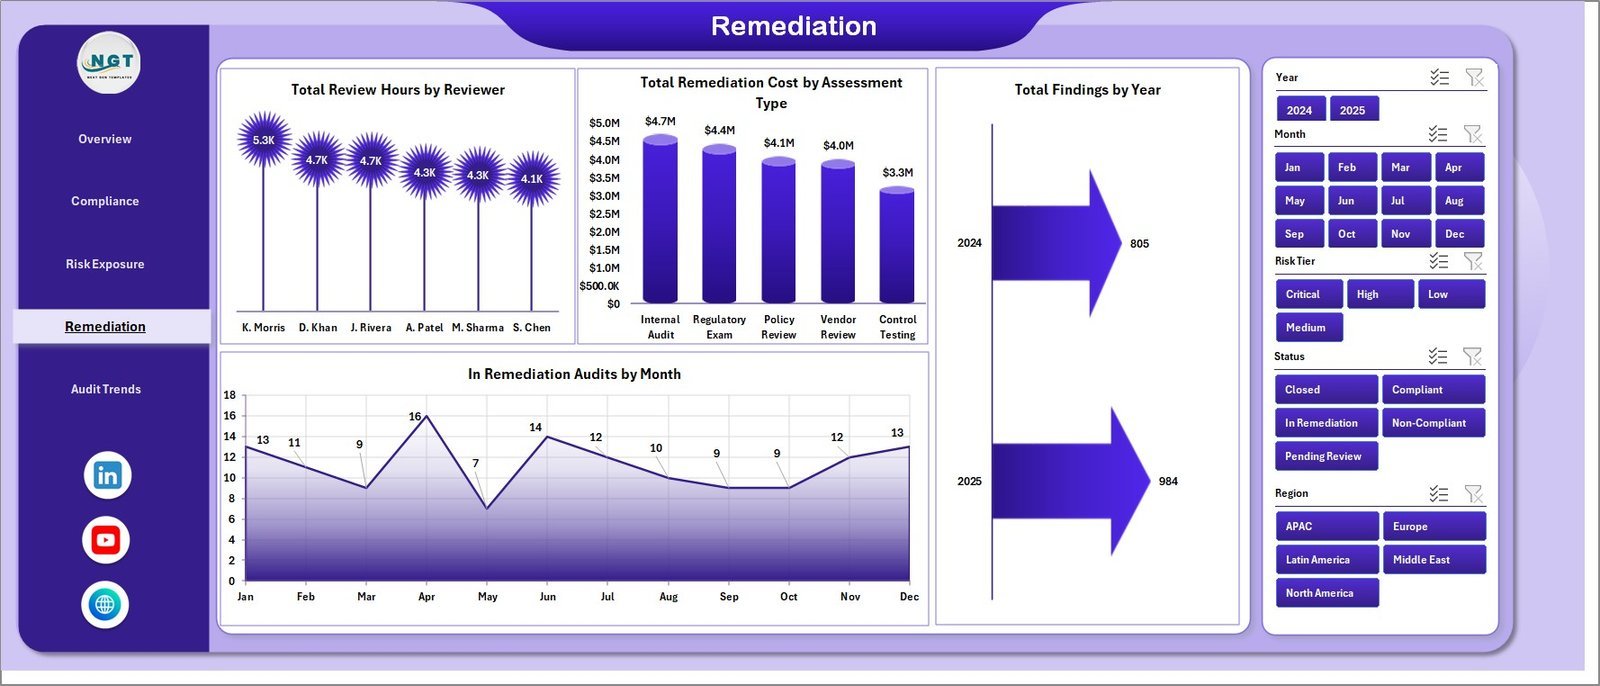
The Remediation sheet tracks Total Review Hours by Reviewer, Total Remediation Cost by Assessment Type, Total Findings by Year, and In Remediation Audits by Month. It supports workload planning, cost review, and follow-up tracking.
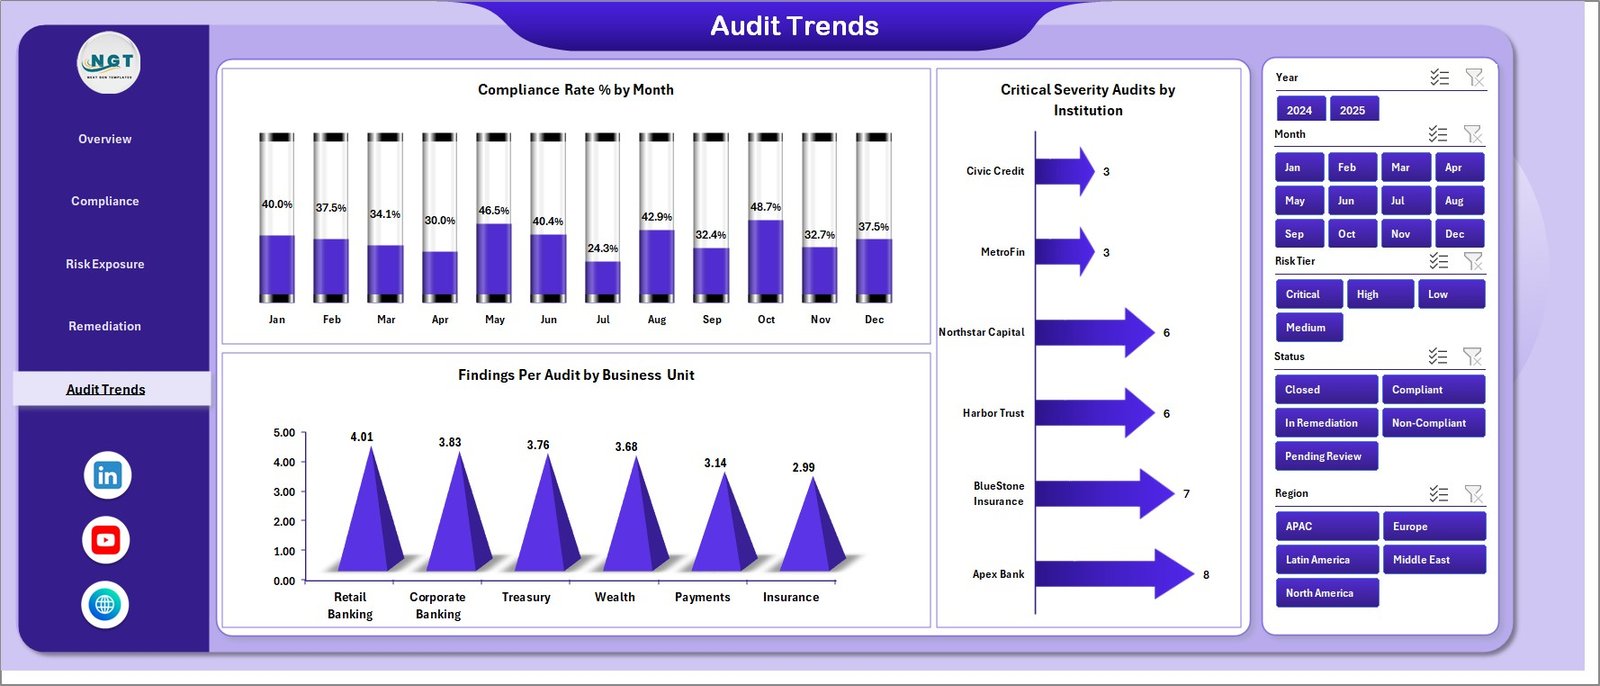
Audit Trends
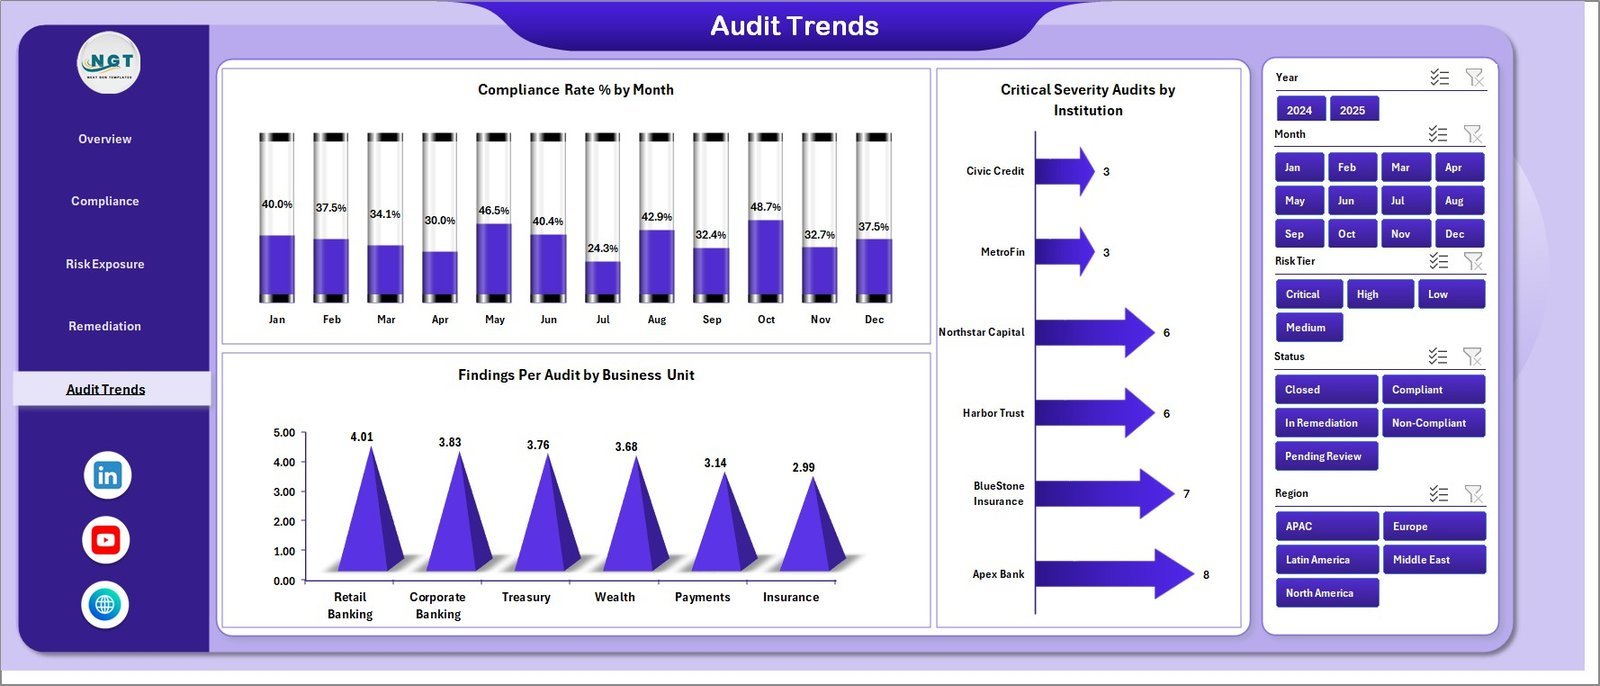
The Audit Trends page shows Compliance Rate % by Month, Findings Per Audit by Business Unit, and Critical Severity Audits by Institution. It is built for recurring audit reviews where trend direction matters as much as the current number.

Data Sheet tab
The Data sheet is where users add records in the same column format as the template. Update the sample rows with your own regulatory audit data, then refresh the workbook to update the pivots, cards, slicers, and charts.

Support sheet tab
The Support sheet contains the pivot tables used to create the dashboard dynamically. After updating the Data sheet, go to the Excel Data ribbon and click Refresh All. You can keep this sheet hidden during normal use.
Reg Tech Dashboard in Excel vs. Google Sheets vs. Paid GRC SaaS – Where This Fits
| Area | This Excel dashboard | Google Sheets alternative | Paid GRC SaaS |
|---|---|---|---|
| Cost | One-time template purchase | Low tool cost but manual build required | Recurring subscription and implementation cost |
| Platform | Microsoft Excel | Browser-based spreadsheet | Vendor-hosted compliance platform |
| Setup time | Update data and refresh pivots | Build tables, formulas, pivots, and charts | Requires onboarding, configuration, and user setup |
| Real-time collaboration | Available through OneDrive or SharePoint workflows | Native collaboration | Usually included |
| Customizable fields | Fully editable workbook | Editable if built manually | Often limited by admin permissions |
| Year-1 cost at 5 users | Template cost plus Excel access | Workspace cost plus build time | Often hundreds or thousands per year |
Who This Template Is For – and Who It’s Not For
This dashboard is for compliance analysts, internal auditors, banking risk teams, fintech operations teams, GRC managers, regulatory reporting teams, consultants, and institutions that want a practical Excel dashboard for audit findings, remediation cost, compliance score, penalty exposure, and risk tier tracking.
It is not a replacement for a validated GRC system with approval routing, evidence collection, electronic signatures, audit trails, API integrations, or automated regulatory filing. Use it as a reporting workbook or management dashboard when your data can be exported into Excel.
How to Use the Reg Tech Dashboard in Excel
- Download and unzip the product file.
- Open the workbook in Microsoft Excel.
- Go to the Data sheet and replace the sample records with your own data in the same format.
- Use the Excel Data ribbon and click Refresh All.
- Review the Overview page first, then use slicers and analysis tabs for deeper review.
- Keep the Support sheet hidden if you do not want users editing pivot tables directly.
Real-World Use Cases
Compliance Manager: A bank compliance manager can review Total Penalty Exposure by Risk Tier and Avg. Compliance Score by Institution before the monthly risk committee meeting.
Internal Audit Lead: An audit lead can use Total Findings by Region, Total Records by Status, and Findings Per Audit by Business Unit to prioritize follow-up work.
RegTech Consultant: A consultant can load client audit exports into the Data sheet and present remediation cost, severity, and trend analysis without building a workbook from scratch.
Frequently Asked Questions
Does this dashboard require macros?
No special macro workflow is required for the dashboard view. It is designed around Excel data, pivots, charts, and slicers.
Can I use my own compliance data?
Yes. Replace the sample records in the Data sheet using the same column format, then refresh the workbook.
How many sheets are included?
The workbook includes Overview, Compliance, Risk Exposure, Remediation, Audit Trends, Data, and Support sheets.
Can I hide the Support sheet?
Yes. The Support sheet holds pivot tables and can be hidden after setup to keep users focused on the dashboard pages.
Is this suitable for banking compliance?
Yes, it can support banking and financial services compliance reporting if your source data includes similar fields such as risk tier, regulation area, institution, findings, and penalty exposure.
Does it replace a GRC platform?
No. It is a reporting dashboard, not a full GRC workflow system. It works well when you export or maintain audit records in Excel.
About the Author
Built by PK – Microsoft Certified Professional with 15+ years of Excel, Google Sheets, and Power BI experience. Founder of NextGenTemplates, reaching 300K+ subscribers across YouTube channels. Every template is hand-built and tested before release.
Explore Related Templates
- Audit Findings and CAPA Data Entry System in Excel
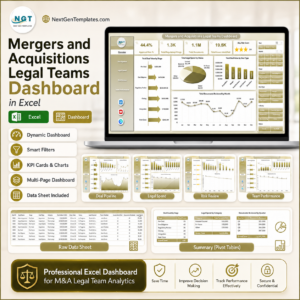
- Mergers and Acquisitions Legal Teams Dashboard in Excel
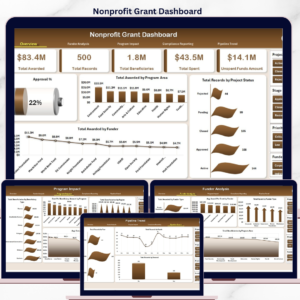
- Nonprofit Grant Dashboard in Excel
- Excel Dashboard Templates
- Excel IT Templates
Download the Reg Tech Dashboard in Excel today and turn regulatory records into clear compliance, risk exposure, remediation, and audit trend reporting.
Last updated: August 2, 2026