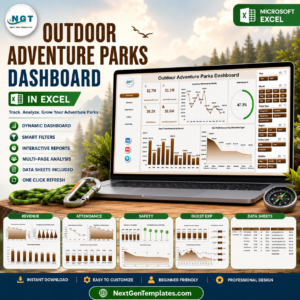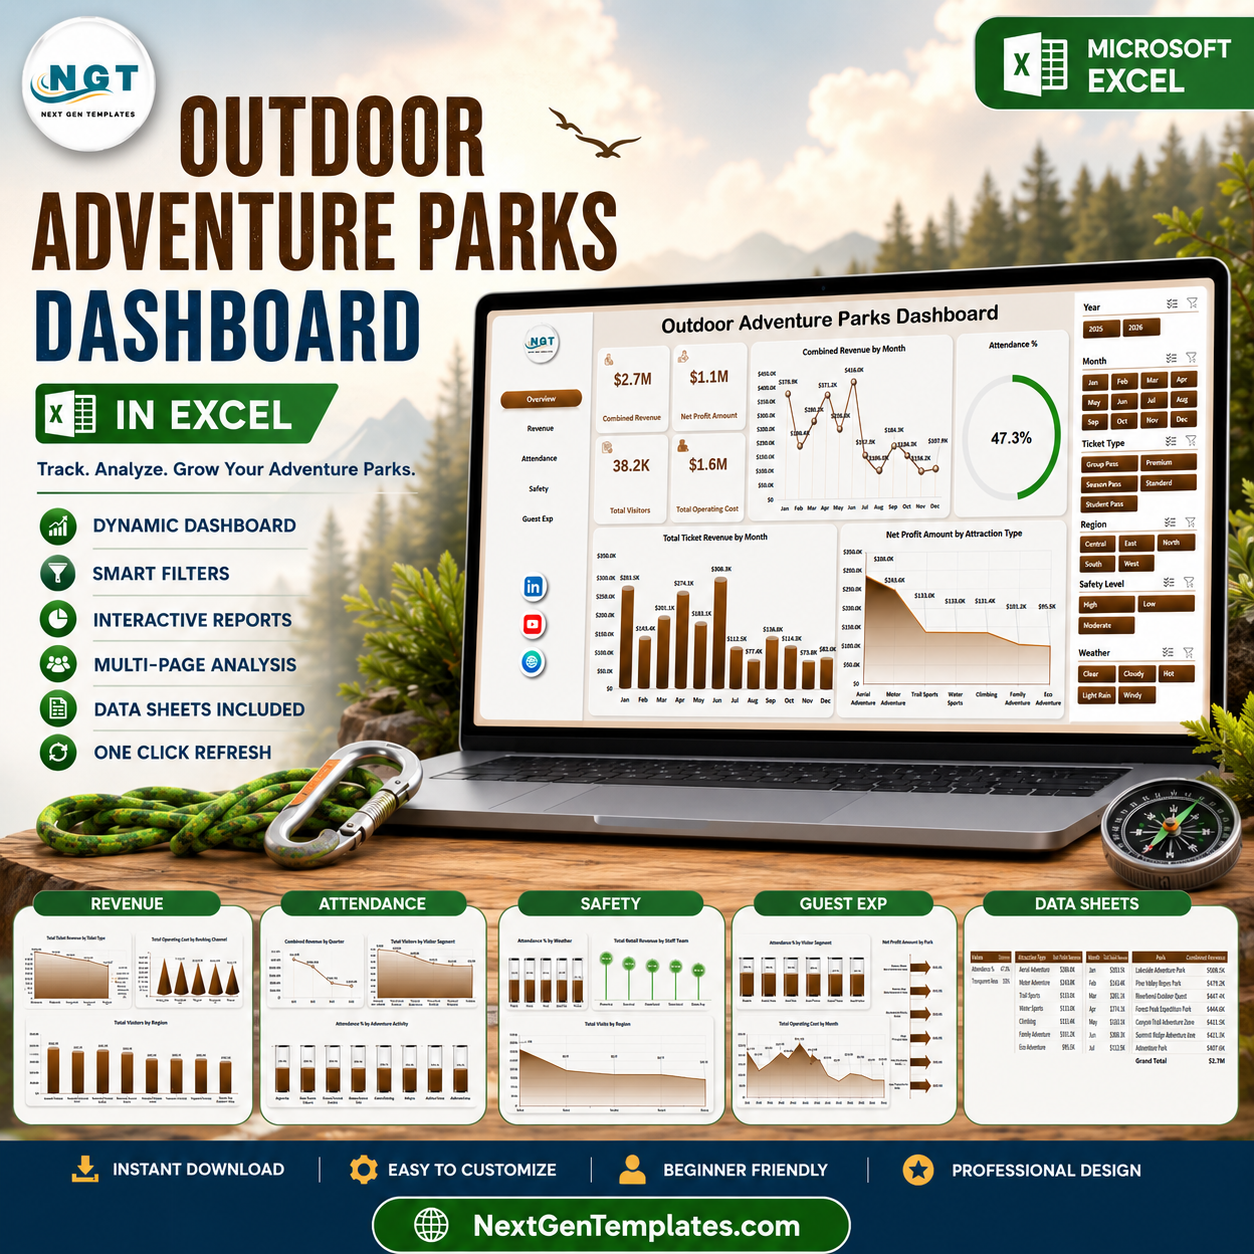


Outdoor Adventure Parks Dashboard in Excel helps adventure park owners, operations managers, finance teams, safety leads, and guest experience analysts review revenue, profit, visitors, operating cost, attendance, ticket sales, activities, weather, safety level, channels, regions, and parks in one editable workbook. Adventure parks often track thousands of visits across ticketing, attractions, retail, staffing, safety, and weather records, but decisions slow down when the data sits in separate exports. For $17.99 one-time, this Excel dashboard gives you 5 dashboard pages, a structured Data sheet, a pivot-backed Support sheet, KPI cards, slicers, and ready charts. Instant download. No monthly reporting subscription.
Key Features of Outdoor Adventure Parks Dashboard in Excel
- 5 dashboard pages for Overview, Revenue, Attendance, Safety, and Guest Exp analysis.
- 5 executive KPI cards for Combined Revenue, Net Profit Amount, Total Visitors, Total Operating Cost, and Attendance %.
- Revenue analysis by ticket type, booking channel, visitor region, and park location.
- Attendance reporting by quarter, visitor segment, safety level, and adventure activity.
- Safety and weather views to compare attendance, retail revenue, staff teams, park performance, and visits by region.
- Guest experience page for visitor segment attendance, monthly operating cost, and net profit by park.
- Interactive slicers so teams can filter the dashboard quickly during park reviews and weekly operations meetings.
- Data and Support sheets for replacing sample records, refreshing pivots, and keeping the dashboard dynamic.
What’s Inside the Outdoor Adventure Parks Dashboard in Excel
1. Overview Page
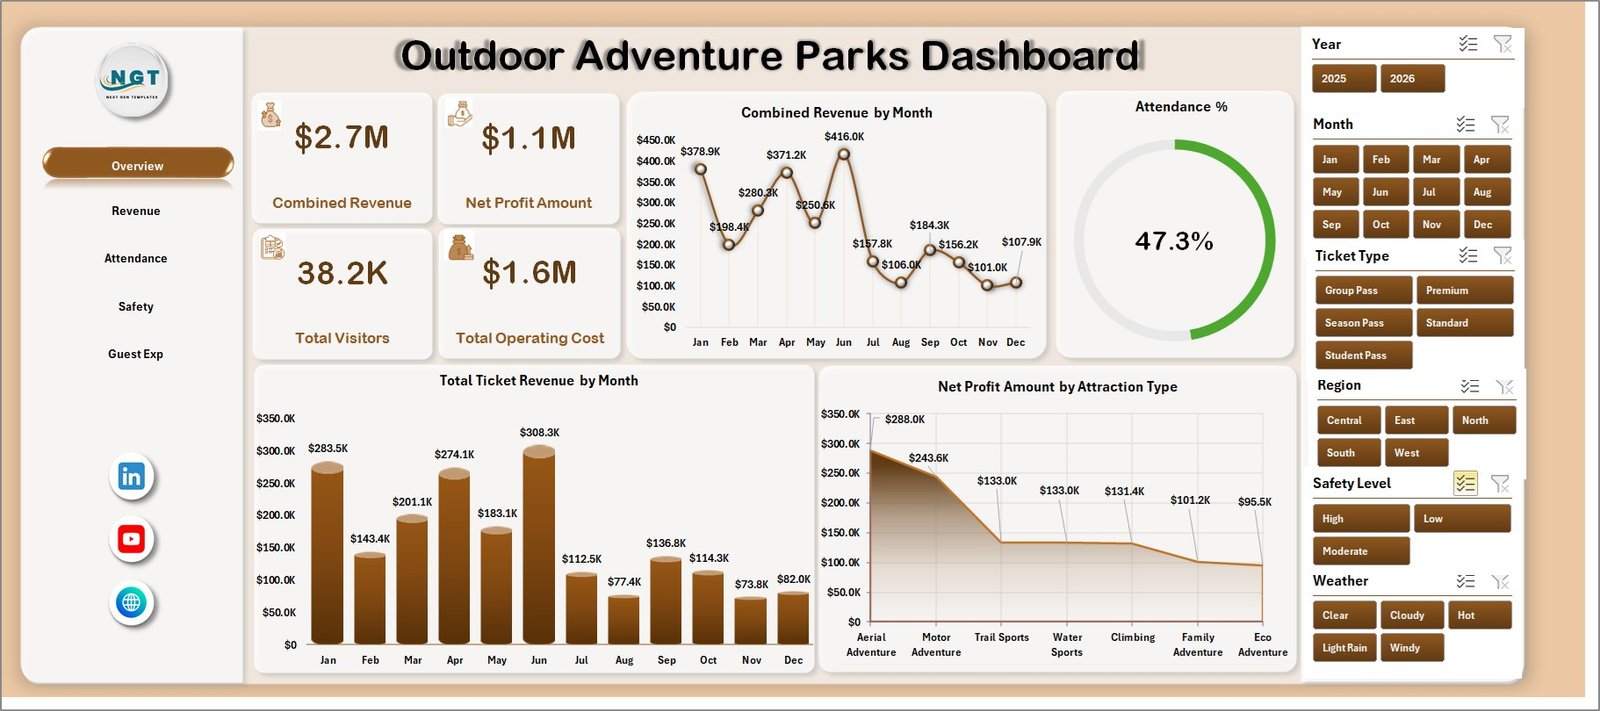
The Overview page gives leaders a high-level readout of Combined Revenue, Net Profit Amount, Total Visitors, Total Operating Cost, and Attendance %. It is built for quick scanning before moving into detailed revenue, attendance, safety, and guest experience pages.
Combined Revenue by Month: This trend shows how total revenue changes through the year. It helps park managers spot seasonal peaks, weak months, and periods that need stronger marketing or staffing plans.
Attendance % by Overall Dashboard Selection: This view responds to slicer selections and shows attendance performance for the filtered data. It helps users compare selected parks, activities, regions, ticket types, or visitor groups without rebuilding reports.
Total Ticket Revenue by Month: This monthly ticket revenue chart separates admission income from wider combined revenue. It is useful for pricing reviews, promotion planning, and demand tracking.
Net Profit Amount by Attraction Type: This chart compares profit across attraction types. It helps identify which attractions are contributing stronger financial returns after cost impact.
2. Revenue
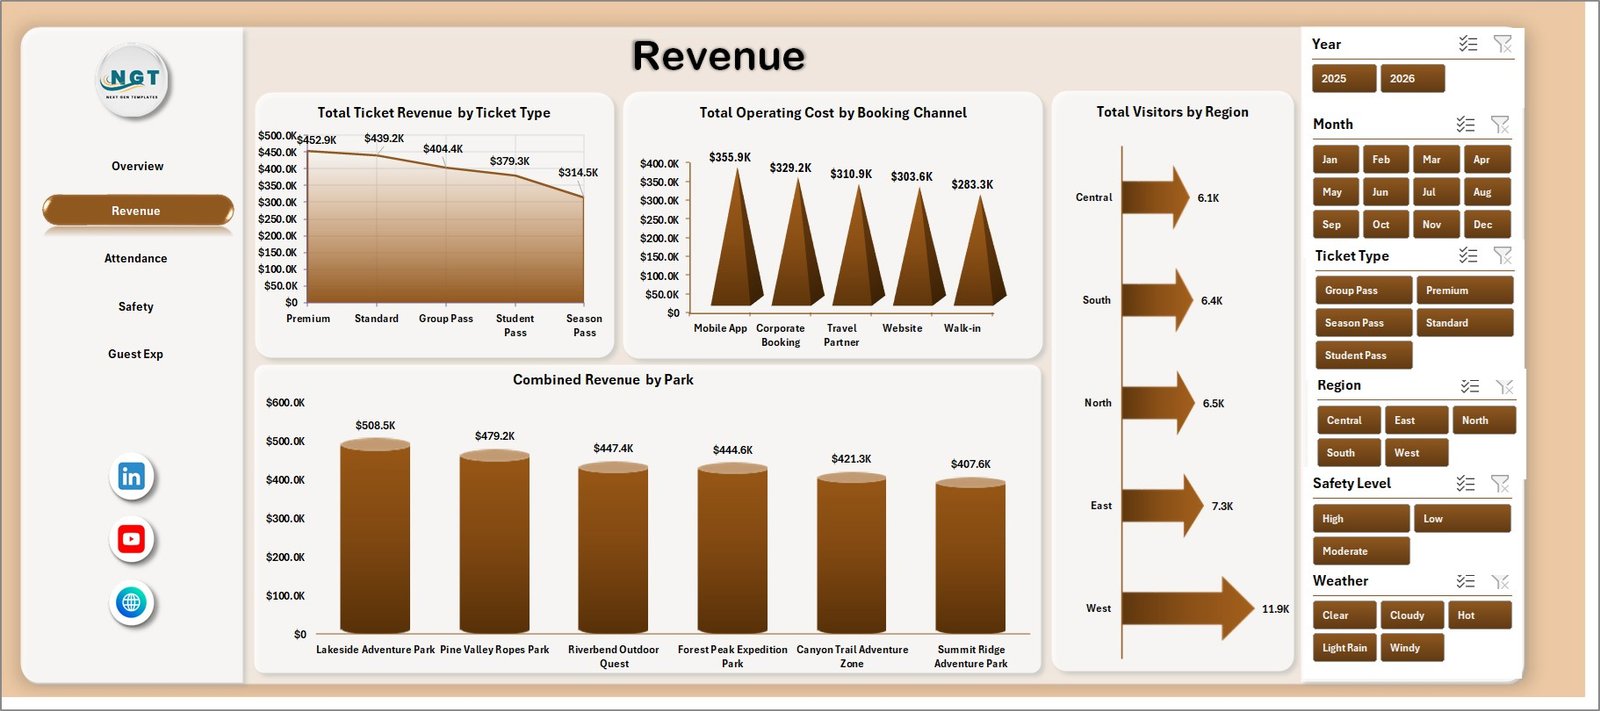
The Revenue sheet focuses on sales, visitors, channels, and parks. Total Ticket Revenue by Ticket Type shows which ticket categories drive admission income. Total Operating Cost by Booking Channel helps teams compare the cost profile of direct, agent, online, and partner bookings. Total Visitors by Region shows demand by visitor geography, while Combined Revenue by Park highlights park-level revenue contribution.
3. Attendance
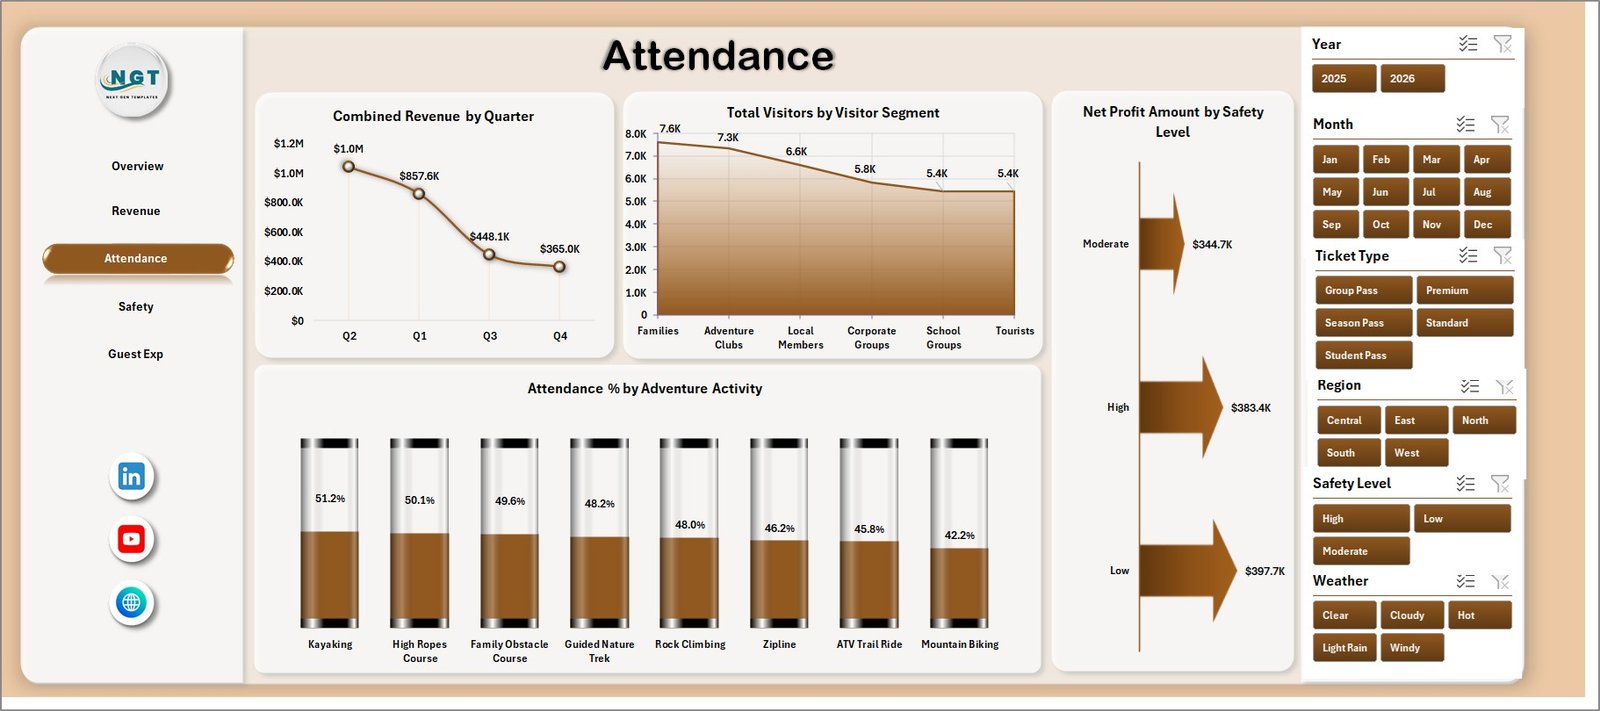
The Attendance sheet helps users understand visitor flow and participation patterns. Combined Revenue by Quarter shows seasonal revenue movement, Total Visitors by Visitor Segment compares customer groups, Net Profit Amount by Safety Level connects safety classification with profit, and Attendance % by Adventure Activity shows which activities attract stronger participation.
4. Safety
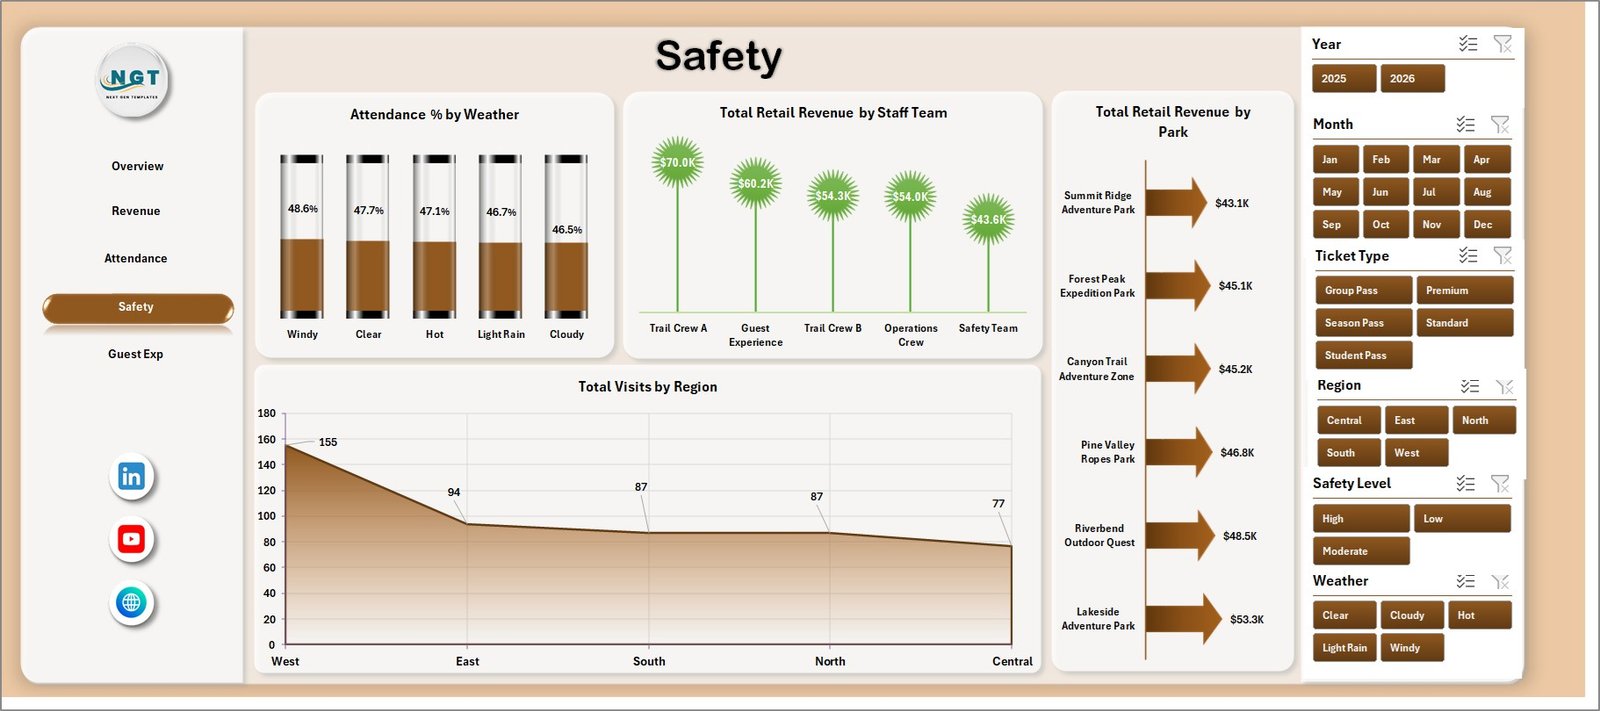
The Safety sheet connects conditions, teams, and location performance. Attendance % by Weather helps operations teams see how conditions affect visitor turnout. Total Retail Revenue by Staff Team and by Park shows where retail sales are strongest, while Total Visits by Region helps plan regional promotions and capacity.
5. Guest Exp
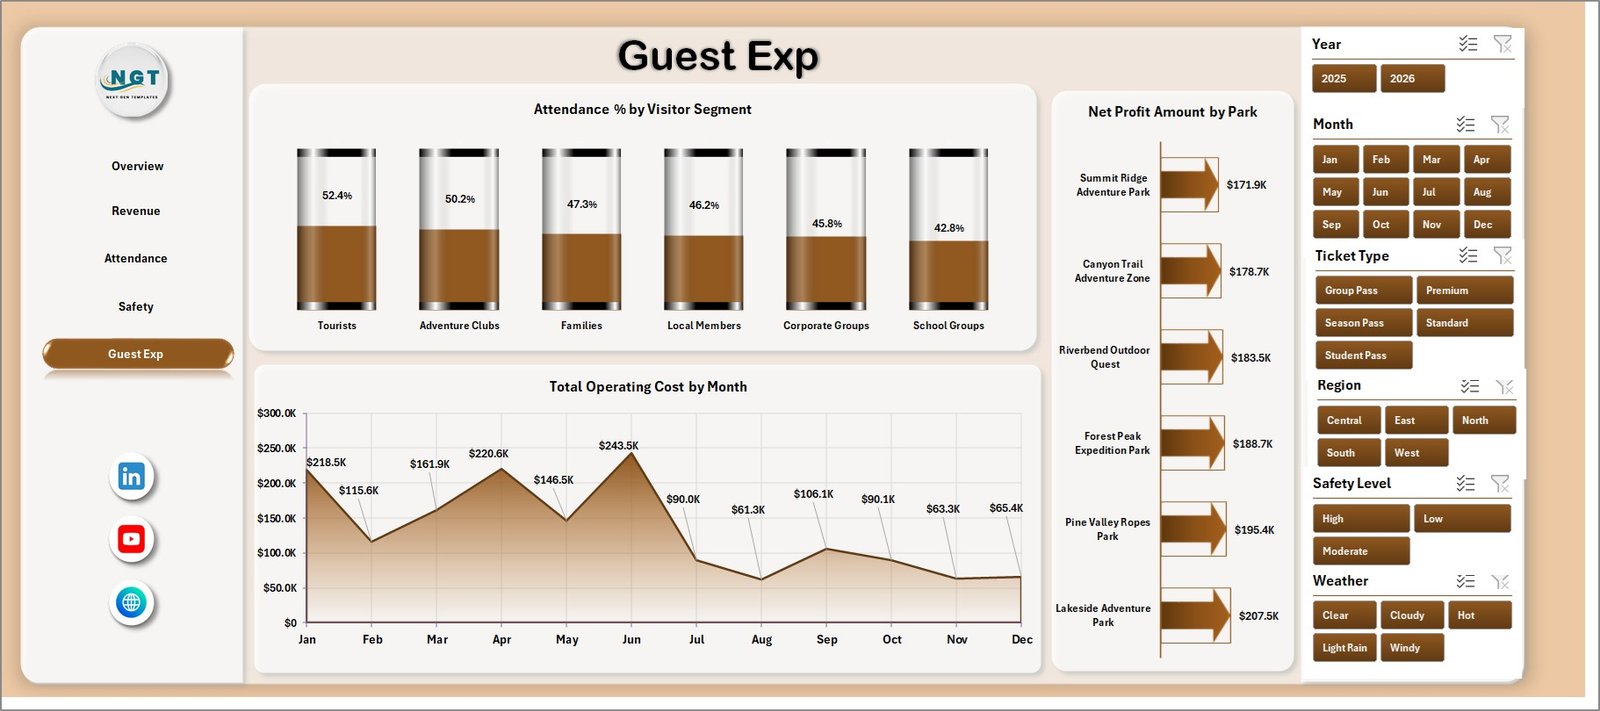
The Guest Exp sheet supports visitor experience and profitability review. Attendance % by Visitor Segment compares engagement by guest group, Total Operating Cost by Month tracks cost movement, and Net Profit Amount by Park shows which parks are producing better financial outcomes.
6. Data Sheet Tab
The Data sheet is where users enter or replace records in the same format as the sample data. After updating this sheet, the workbook can be refreshed so every KPI card, slicer, pivot, and chart reflects the latest park data.

7. Support Sheet
The Support sheet contains the pivot tables that power the dashboard dynamically. After updating the Data sheet, go to the Data tab in the Excel ribbon and click Refresh All. The pivots and dashboard charts refresh together, and this sheet can be hidden during normal use.

Outdoor Adventure Parks Dashboard in Excel vs. Google Sheets vs. Paid CRM/SaaS – Where This Fits
| Feature | This Excel Dashboard | Google Sheets Alternative | Paid Park SaaS |
|---|---|---|---|
| Cost | $17.99 one-time | Low software cost but manual dashboard build | Monthly or annual subscription |
| Platform | Microsoft Excel | Browser spreadsheet | Vendor cloud platform |
| Setup time | Replace data and refresh | Build pivots, formulas, slicers, and charts | Implementation and configuration |
| Collaboration | Available through OneDrive or SharePoint | Native real-time collaboration | Usually included by plan |
| Customizable fields | Edit workbook, data, pivots, and charts | Editable but manually maintained | Depends on vendor permissions |
| Year-1 cost at 5 users | $17.99 plus Microsoft licensing if needed | Low license cost plus build time | Often hundreds or thousands |
| Park analytics | Revenue, visitors, cost, profit, attendance, safety, retail, weather, regions, activities, and parks | Must be designed manually | Depends on vendor reporting module |
Who This Template Is For – and Who It’s Not For
Best for: outdoor adventure park owners, amusement and activity park managers, tourism operators, finance analysts, safety coordinators, guest experience teams, and consultants who use Excel for recurring visitor, revenue, cost, safety, and park performance reporting.
Not for: teams needing live ticket scanning, waiver management, incident reporting workflows, POS integration, reservation automation, CRM email campaigns, or a custom database application.
How to Use the Outdoor Adventure Parks Dashboard in Excel
- Download and unzip the product file.
- Open the workbook in Microsoft Excel.
- Review the sample records in the Data sheet.
- Replace sample records with your park data using the same columns.
- Click Refresh All from the Excel Data ribbon.
- Use slicers to filter by park, month, ticket type, channel, region, activity, visitor segment, weather, or safety level.
- Review the Overview, Revenue, Attendance, Safety, and Guest Exp pages.
- Hide the Support sheet if end users only need the dashboard and Data sheet.
Real-World Use Cases
Priya, park operations manager: reviews monthly revenue, attendance, visitor segments, weather impact, and operating cost before weekly leadership meetings.
Daniel, finance analyst: compares ticket revenue, combined revenue, operating cost, and net profit by park, attraction type, channel, and month.
Meera, guest experience lead: uses attendance and guest segment views to understand which activities and visitor groups need better staffing or promotion.
Frequently Asked Questions
What does this Excel dashboard track?
It tracks combined revenue, net profit, visitors, operating cost, attendance percentage, ticket revenue, retail revenue, visits, parks, booking channels, regions, visitor segments, safety level, weather, and adventure activities.
Do I need advanced Excel skills?
No. Replace the sample data, click Refresh All, and use slicers to analyze the dashboard. Advanced users can also edit pivots, charts, formulas, and layout.
Can I use my own adventure park data?
Yes. Add your records to the Data sheet in the same format and refresh the workbook so every page updates.
Can I hide the Support sheet?
Yes. The Support sheet contains pivot tables and can be hidden after setup.
Is this a ticketing or reservation system?
No. It is an Excel analytics dashboard for reporting and review, not a live ticketing, waiver, POS, booking, or CRM system.
Is this a subscription?
No. It is a one-time downloadable Excel dashboard template purchase.
About the Author
Built by PK – Microsoft Certified Professional with 15+ years of Excel, Google Sheets, and Power BI experience. Founder of NextGenTemplates, reaching 300K+ subscribers across YouTube channels. Every template is hand-built and tested before release.
Explore Related Templates
Pair this workbook with Adventure Tourism Dashboard in Power BI, Eco Lodges Dashboard in Power BI, and Destination Management Companies Dashboard in Power BI. Browse more Excel Dashboard templates and MS Excel templates.
Ready to review adventure park performance in Excel? Download the Outdoor Adventure Parks Dashboard in Excel, replace the sample data, refresh the workbook, and start tracking revenue, visitors, cost, profit, safety, activities, weather, regions, and guest experience in one file.
Last updated: July 19, 2026.