



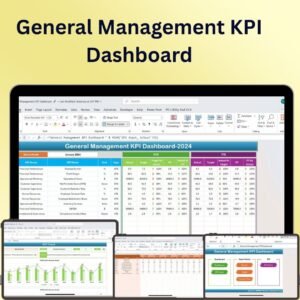
The General Management KPI Dashboard in Excel is a comprehensive and powerful tool designed to help managers and business leaders track key performance indicators (KPIs) across various aspects of their organization. This dynamic dashboard allows you to monitor essential metrics, such as sales, operational efficiency, employee performance, and financial health, all in one central location.
With a clean, user-friendly interface, this Excel-based dashboard is ideal for general managers, department heads, and executives who need a quick overview of their organization’s performance. The dashboard is fully customizable, allowing you to adjust it according to your specific KPIs, organizational goals, and reporting preferences. Whether you are tracking business progress, identifying areas for improvement, or setting new targets, the General Management KPI Dashboard is your go-to tool for strategic decision-making.

Key Features of the General Management KPI Dashboard:
📊 Comprehensive KPI Tracking
Track a wide range of KPIs, including financial performance, employee productivity, operational efficiency, and customer satisfaction, all in one view.
📉 Real-Time Data Updates
The dashboard automatically updates as new data is entered, ensuring that you always have the latest information at your fingertips.
🎨 Customizable Design
Tailor the dashboard to your specific needs by adjusting the KPIs, metrics, and layout. Customize the chart types, colors, and data labels to align with your business or organizational goals.
📈 Visual Data Representation
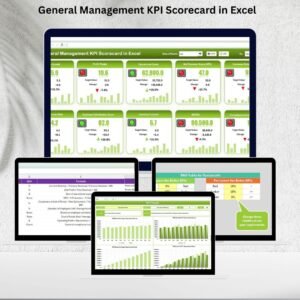
The dashboard uses clear and intuitive charts, graphs, and progress indicators to represent your data, making it easy to identify trends and performance gaps.
🛠️ User-Friendly Interface
Designed with ease of use in mind, this dashboard is suitable for both beginners and advanced Excel users, with no complex formulas required.
Why You’ll Love the General Management KPI Dashboard:
✅ Centralized Data Overview – Get a comprehensive snapshot of all key business metrics in one central location, helping you make better decisions quickly and effectively. ✅ Real-Time Monitoring – Stay on top of your organization’s performance with real-time data updates and visual progress tracking. ✅ Fully Customizable – Adjust the dashboard to fit your unique KPIs, goals, and industry-specific requirements. ✅ Easy to Use – The user-friendly interface makes it simple to input data and interpret the results, even if you don’t have advanced Excel skills. ✅ Make Data-Driven Decisions – Visualize performance trends and key metrics to guide strategic business decisions and operational improvements.
What’s Inside the General Management KPI Dashboard:
- Comprehensive KPI Metrics – A collection of essential business metrics, including sales, productivity, financial health, and customer satisfaction.
- Real-Time Data Integration – Automatically updates as you enter new data, providing an up-to-date view of your business performance.
- Customizable Charts and Graphs – Visual representations of KPIs, including bar charts, line graphs, and progress indicators.
- User-Friendly Interface – A simple, intuitive layout that makes it easy for anyone to use, regardless of Excel experience.
- Performance Tracking – Use the dashboard to monitor the status of individual and team performance, ensuring that goals are being met.
How to Use the General Management KPI Dashboard:
1️⃣ Download the Template – Get instant access to the Excel dashboard after purchase. 2️⃣ Input Your Data – Enter your key performance metrics and data into the template. 3️⃣ Customize the Layout – Tailor the dashboard to suit your specific KPIs and business goals. 4️⃣ Analyze the Data – Use the dynamic charts and visual indicators to track progress, identify trends, and pinpoint areas for improvement. 5️⃣ Make Informed Decisions – Use the dashboard insights to guide your strategic decisions, operational adjustments, and business development.
Who Can Benefit from the General Management KPI Dashboard:
- General Managers
- Business Executives
- Department Heads
- Project Managers
- Sales Managers
- Operations Managers
- Anyone looking to track business performance and make data-driven decisions
The General Management KPI Dashboard is the ideal solution for managers and leaders who need a clear, real-time overview of their organization’s performance. With its customizable design, easy-to-read visuals, and real-time updates, this dashboard empowers decision-makers to track and improve key business metrics.
Click here to read the Detailed blog post
https://www.pk-anexcelexpert.com/general-management-kpi-dashboard/
Visit our YouTube channel to learn step-by-step video tutorials
Compatibility and Requirements
- Works in Microsoft Excel desktop (Excel 2016 or later, or Microsoft 365).
- The KPI views and charts are built into the workbook. Microsoft explains Excel charts in Create a chart from start to finish.
Frequently Asked Questions
Which KPIs does the dashboard cover?
Financial performance, sales, employee productivity, operational efficiency and customer satisfaction.
Does it update when I add data?
Yes. The dashboard refreshes as you enter new data, so the figures stay current.
Can I change the charts?
Yes. You can adjust the KPIs, chart types, colors and data labels to fit your goals.
Do I need advanced Excel skills?
No. It suits beginners and advanced users, with no complex formulas to write.
Is it available for other platforms?
Yes. The same dashboard is available in Google Sheets and Power BI.
Related General Management Templates
- General Management KPI Dashboard in Google Sheets: the same KPIs in Google Sheets
- General Management KPI Dashboard in Power BI: the same KPIs in Power BI
- General Management KPI Scorecard in Excel: a scorecard view in Excel
- General Management KPI Scorecard in Google Sheets: a scorecard view in Google Sheets
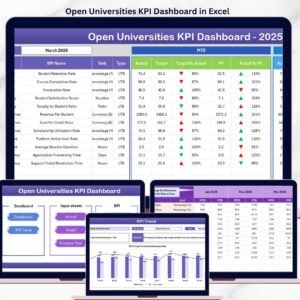
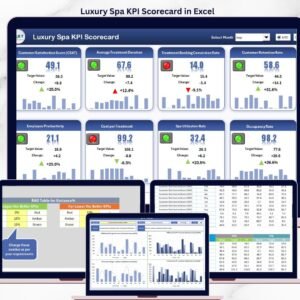
- KPI Dashboard Library (Excel): 15 Excel KPI dashboards in one download
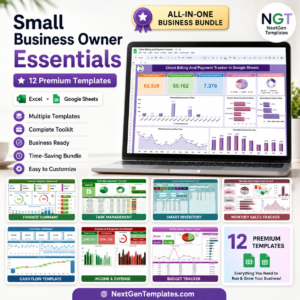
Browse all Excel KPI dashboards or the template bundles.


























Reviews
There are no reviews yet.