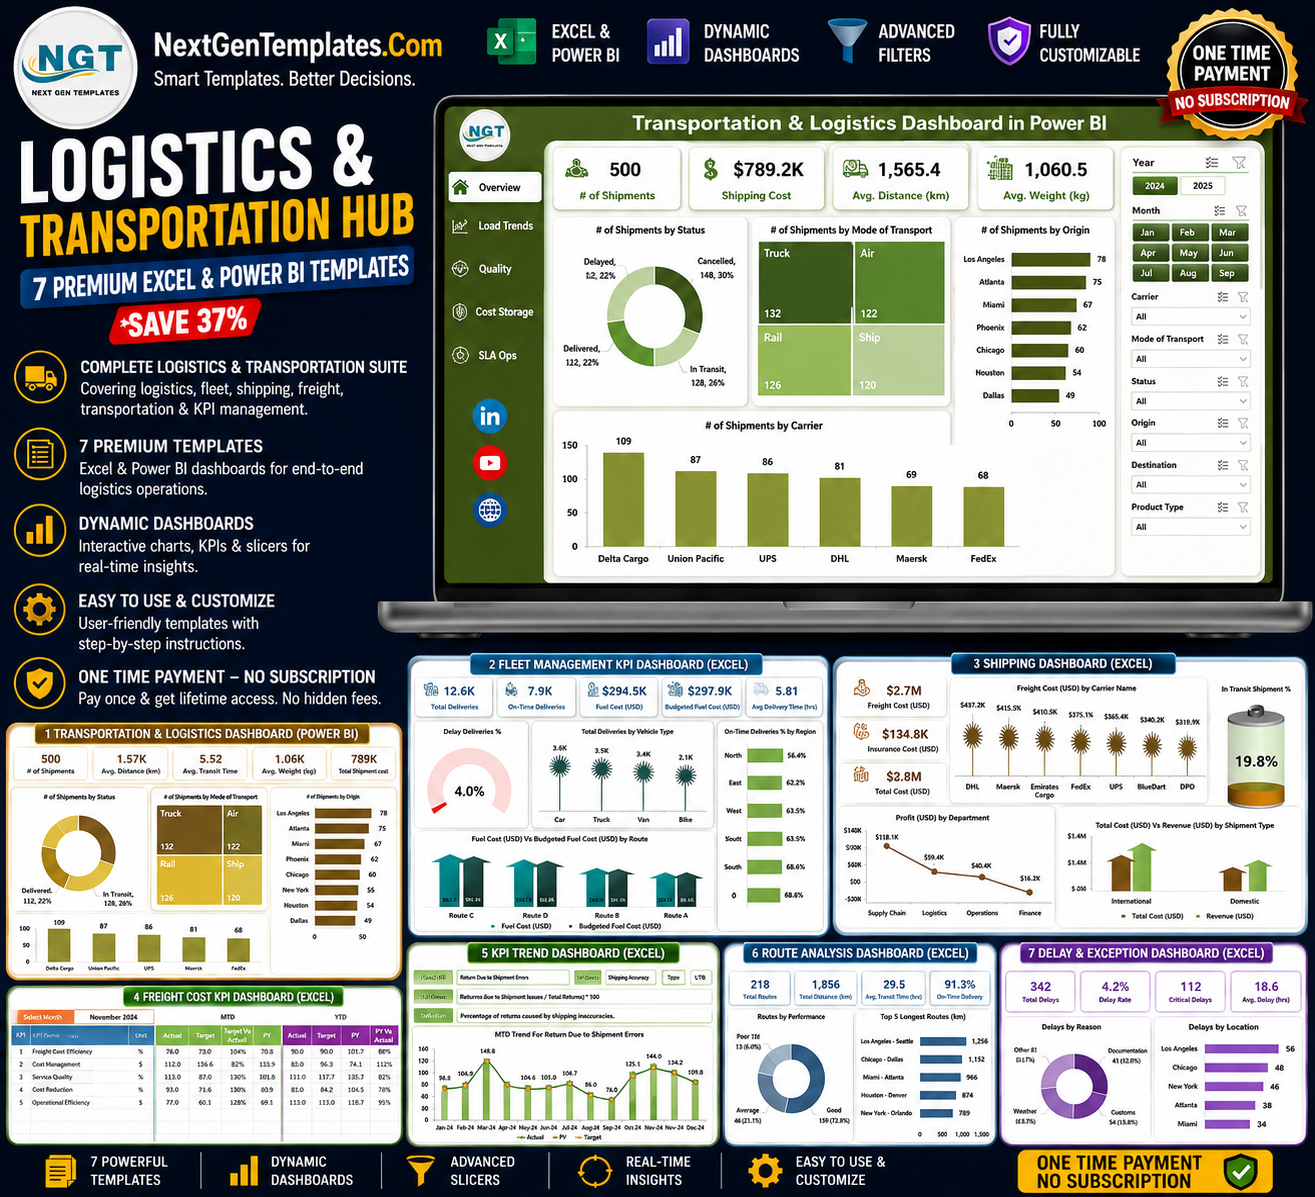
Managing transportation, freight, fleet, and shipping operations across separate spreadsheets is slow, error-prone, and expensive. The Logistics and Transportation Hub solves that in one shot — a complete collection of 7 premium logistics dashboard templates for Excel and Power BI, bundled together so you can manage your entire supply chain from carrier performance to on-time delivery without buying expensive BI software or hiring an analyst.
Buy all 7 individually and you’d pay $110.93. Get them together in this bundle for just $69.99 — that’s 37% off and $40.94 in savings. Every template is plug-and-play: drop in your data, hit refresh, and your KPIs, slicers, and charts update automatically.
🔑 Key Features of the Logistics and Transportation Hub
- 🚛 End-to-End Logistics Coverage – transportation, freight cost, fleet, and shipping analytics in a single pack.
- 📊 Dual Platform – Excel + Power BI – work offline in Excel or build interactive BI reports, your choice.
- 📦 Carrier & Route Optimization – compare carriers, spot inefficient routes, and cut delivery delays.
- 💰 Freight Cost & Spend Tracking – monitor cost per shipment, fuel surcharges, and freight spend by region.
- 🚗 Fleet Utilization & Maintenance – track vehicle performance, mileage, fuel efficiency, and downtime.
- 📈 MTD & YTD Shipping KPIs – actual vs target, on-time delivery %, and variance arrows.
- 🎚️ Interactive Slicers & Filters – drill down by carrier, region, mode of transport, or month.
- ⚡ Zero Coding, No Macros – 100% formula and PivotTable driven, beginner-friendly.
- 🧾 Auto-Updating KPI Cards & Charts – refresh once and every visual recalculates.
- 💼 Built for Every Team Size – from small fleets to enterprise logistics networks.
📦 What’s Inside the Logistics and Transportation Hub
- Transportation & Logistics Dashboard in Excel ($17.99) – 5 analytical pages covering carrier performance, route analysis, product shipment, and time-based trends with slicers and KPI cards.
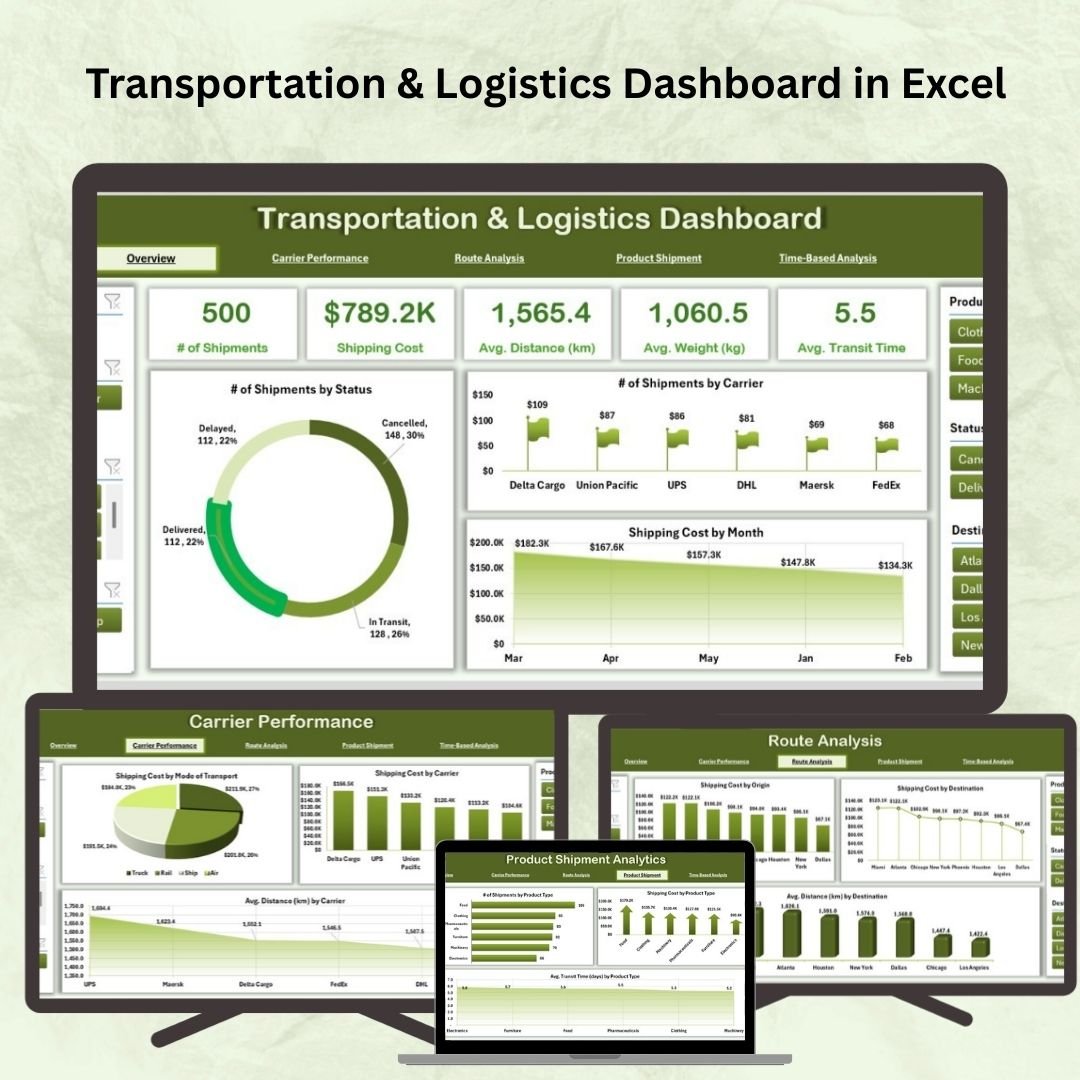
Transportation & Logistics Dashboard in Excel
- Transportation & Logistics Dashboard in Power BI ($17.99) – the same powerful logistics analytics rebuilt in Power BI with 5 interactive pages and 8 slicers per page for dynamic reporting.

Transportation & Logistics Dashboard in Power BI
- Transportation Dashboard in Excel ($17.99) – region, vehicle, and route analysis with fuel cost budget tracking and monthly trend monitoring across 5 pages.
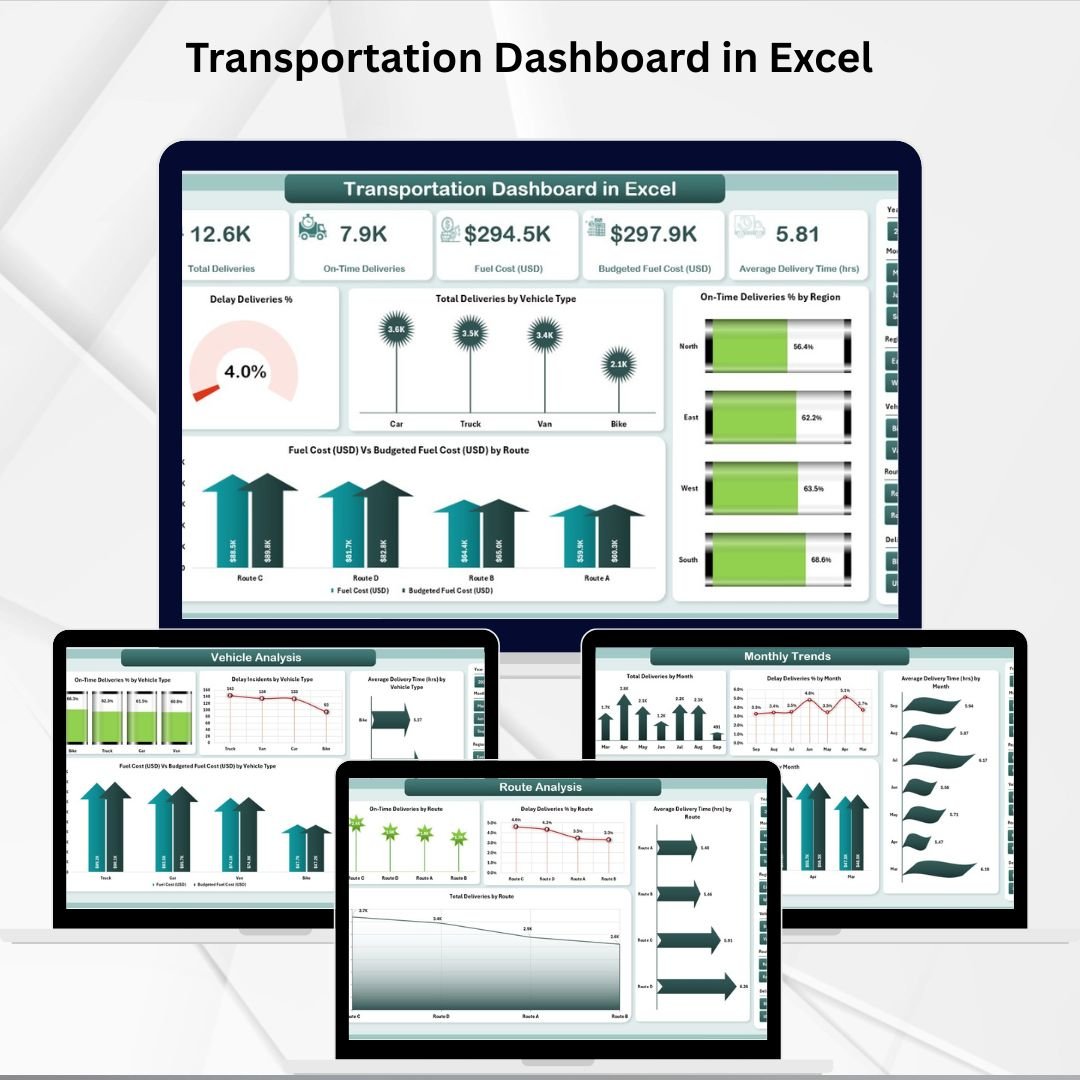
Transportation Dashboard in Excel
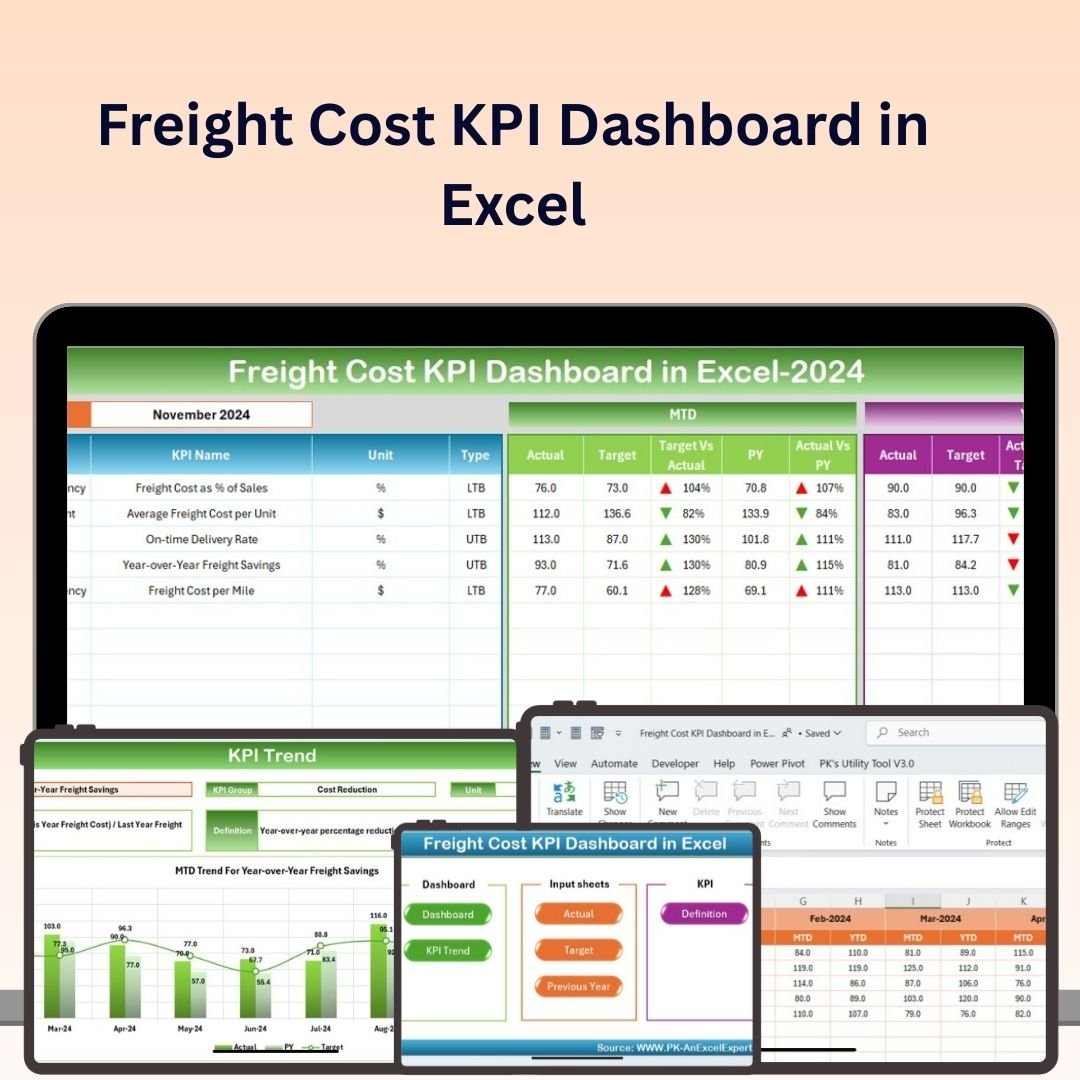
- Freight Cost KPI Dashboard in Excel ($12.99) – track total freight cost, cost per shipment, delivery time, and carrier comparison with a clear freight spend breakdown.

Freight Cost KPI Dashboard in Excel
- Shipping Dashboard in Excel ($17.99) – 5 analytical pages tracking freight cost, profit, in-transit %, and cost-vs-revenue by department, region, and mode of transport.
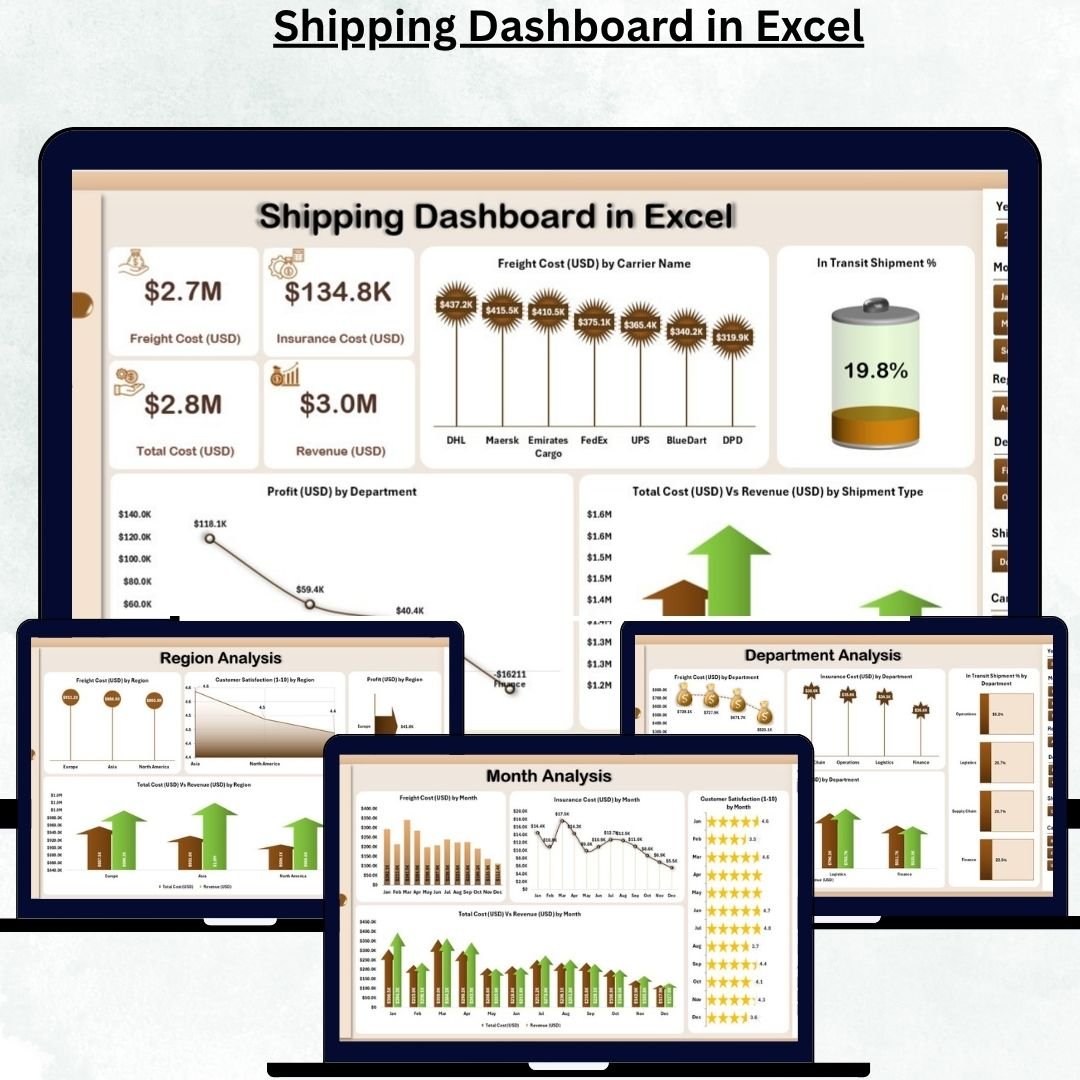
Shipping Dashboard in Excel
- Fleet Management KPI Dashboard in Excel ($12.99) – monitor vehicle performance, fuel efficiency, maintenance schedules, utilization, and total fleet cost against budget.

Fleet Management KPI Dashboard in Excel
- Shipping KPI Dashboard in Excel ($12.99) – MTD & YTD performance with actual vs target, previous-year comparison, KPI trend charts, and a full KPI definition library.
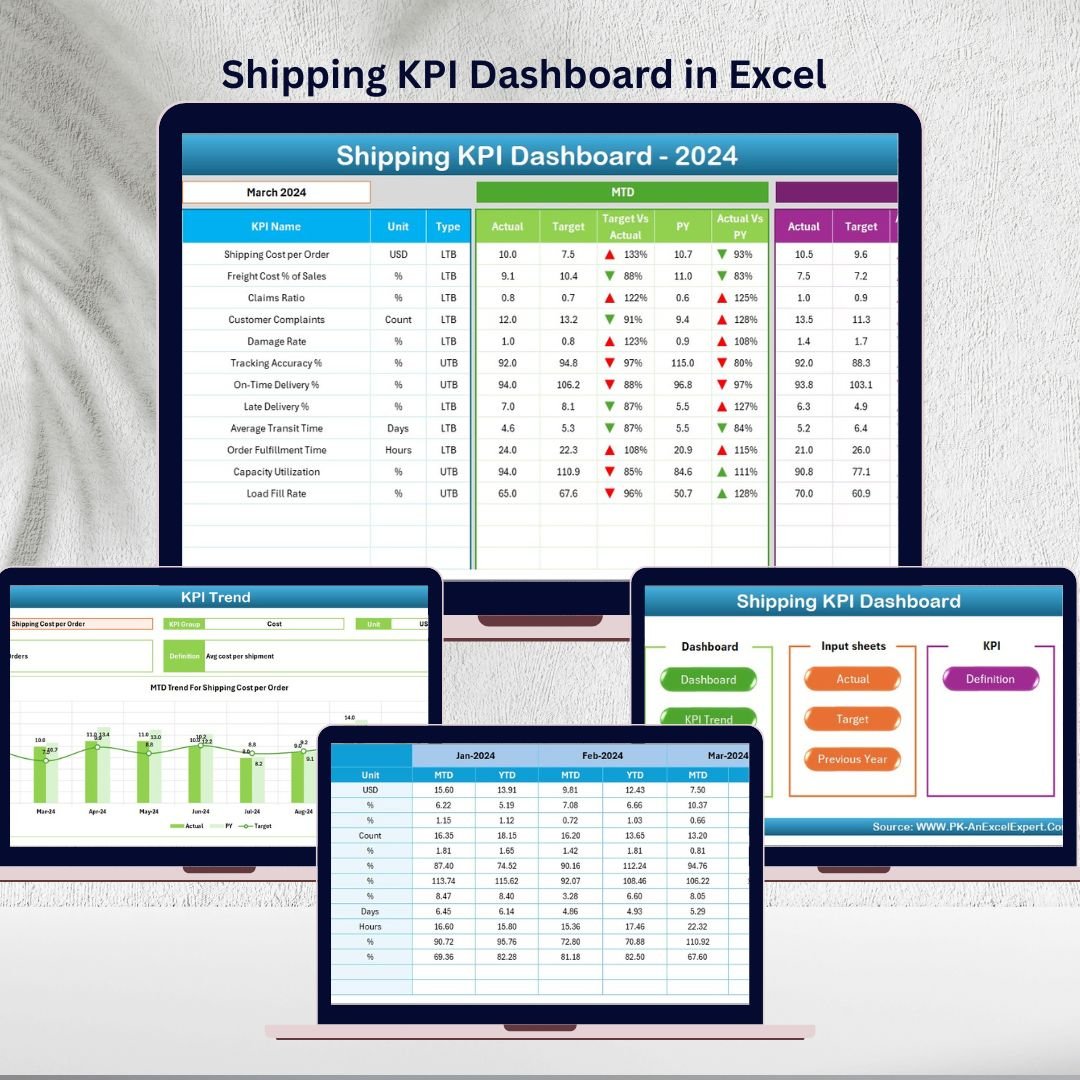
Shipping KPI Dashboard in Excel
💡 Smart Comparison — Individual vs Bundle
| Option | Templates | Price | You Pay | Best Value |
|---|---|---|---|---|
| Buying Individually | 7 | $110.93 | $110.93 | ❌ |
| Logistics & Transportation Hub Bundle | 7 | $69.99 | ✅ Save 37% ($40.94) |
📝 Product Breakdown
| # | Template | Platform | Individual Price |
|---|---|---|---|
| 1 | Transportation & Logistics Dashboard | Excel | $17.99 |
| 2 | Transportation & Logistics Dashboard | Power BI | $17.99 |
| 3 | Transportation Dashboard | Excel | $17.99 |
| 4 | Freight Cost KPI Dashboard | Excel | $12.99 |
| 5 | Shipping Dashboard | Excel | $17.99 |
| 6 | Fleet Management KPI Dashboard | Excel | $12.99 |
| 7 | Shipping KPI Dashboard | Excel | $12.99 |
| Total Individual Value | $110.93 | ||
| Bundle Price | $69.99 | ||
⚙️ How to Use the Logistics and Transportation Hub
- Download & Unzip – extract the bundle to access all 7 Excel and Power BI files.
- Enter Your Data – replace the sample data in each template’s data sheet with your shipment, fleet, and freight records.
- Refresh – click Data → Refresh All in Excel (or refresh your Power BI dataset) to update all KPIs and charts.
- Filter & Analyze – use slicers to drill into specific carriers, routes, regions, modes, or months.
- Act on Insights – renegotiate carrier contracts, optimize routes, control fuel spend, and improve on-time delivery.
👥 Who Can Benefit from This Bundle
- 🚛 Logistics Managers – monitor end-to-end delivery performance and cost efficiency.
- 🚗 Fleet Managers – optimize vehicle utilization, fuel efficiency, and maintenance.
- 📊 Transportation Directors – align logistics strategy with measurable KPIs.
- 🏭 Supply Chain & Operations Teams – reduce bottlenecks and freight spend.
- 🛒 E-commerce & Retail Businesses – track last-mile and on-time delivery.
🚀 Get the Complete Logistics and Transportation Hub
7 premium Excel + Power BI templates — $110.93 $69.99
🔥 Save 37% ($40.94) — Limited-Time Bundle Deal


Reviews
There are no reviews yet.