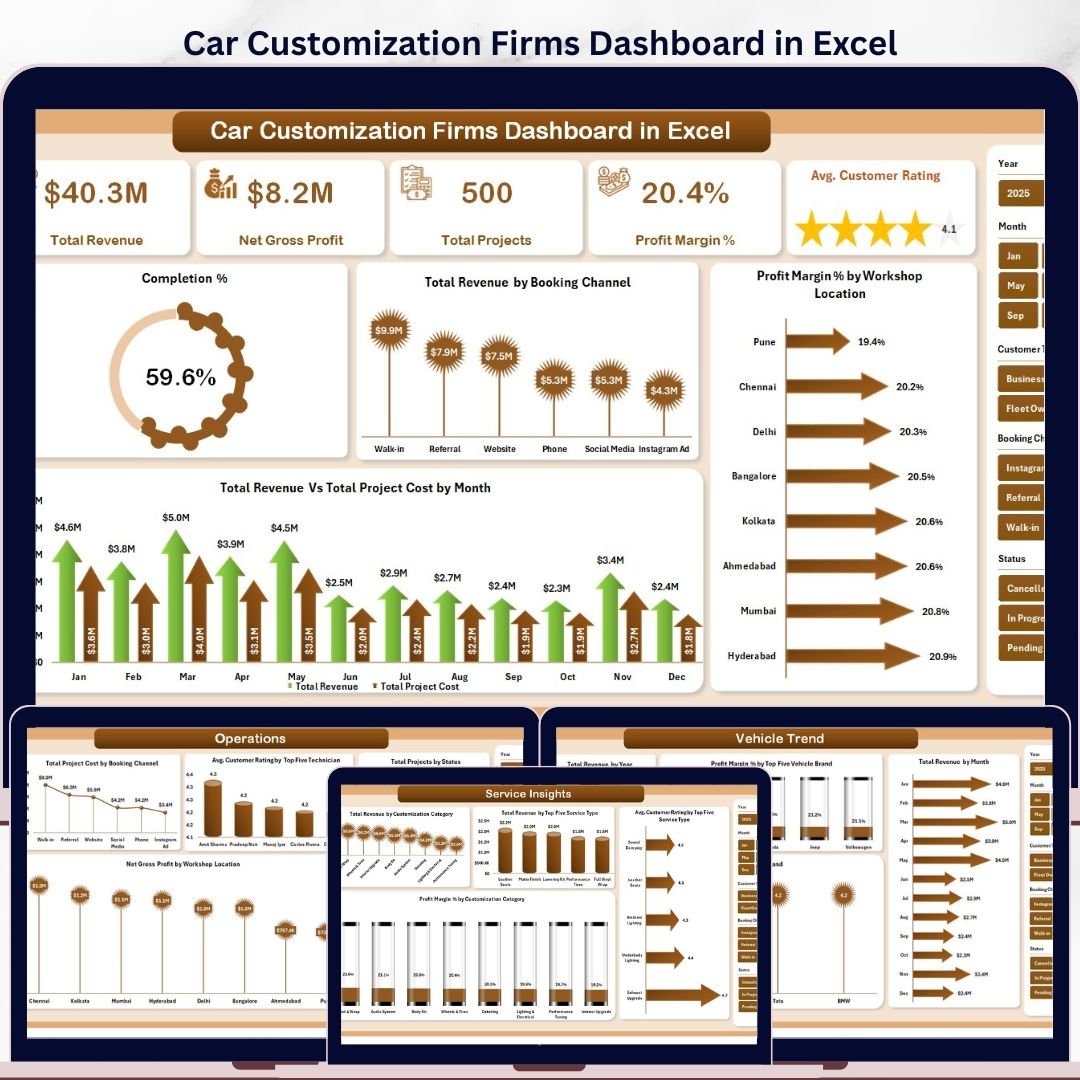


The Car Customization Firms Dashboard in Excel is a fully dynamic, pivot-driven analytics tool built for automotive customization workshops, detailing studios, and vehicle modification businesses. It consolidates project data, revenue streams, customer ratings, technician performance, and booking channel metrics into a single interactive Excel workbook—refreshable with one click. Whether you manage a boutique wrap shop or a large-scale performance modification center, this dashboard gives you the clarity to make faster, data-backed decisions.
Built with native Excel pivot tables and slicers, this template requires no macros and works on Excel 2016 and above. Just update your data, hit Refresh All, and every KPI card, chart, and slicer updates instantly.
What’s Inside This Excel Dashboard?
This dashboard spans 7 structured sheet tabs covering every operational dimension of a car customization business:
1. Overview Page
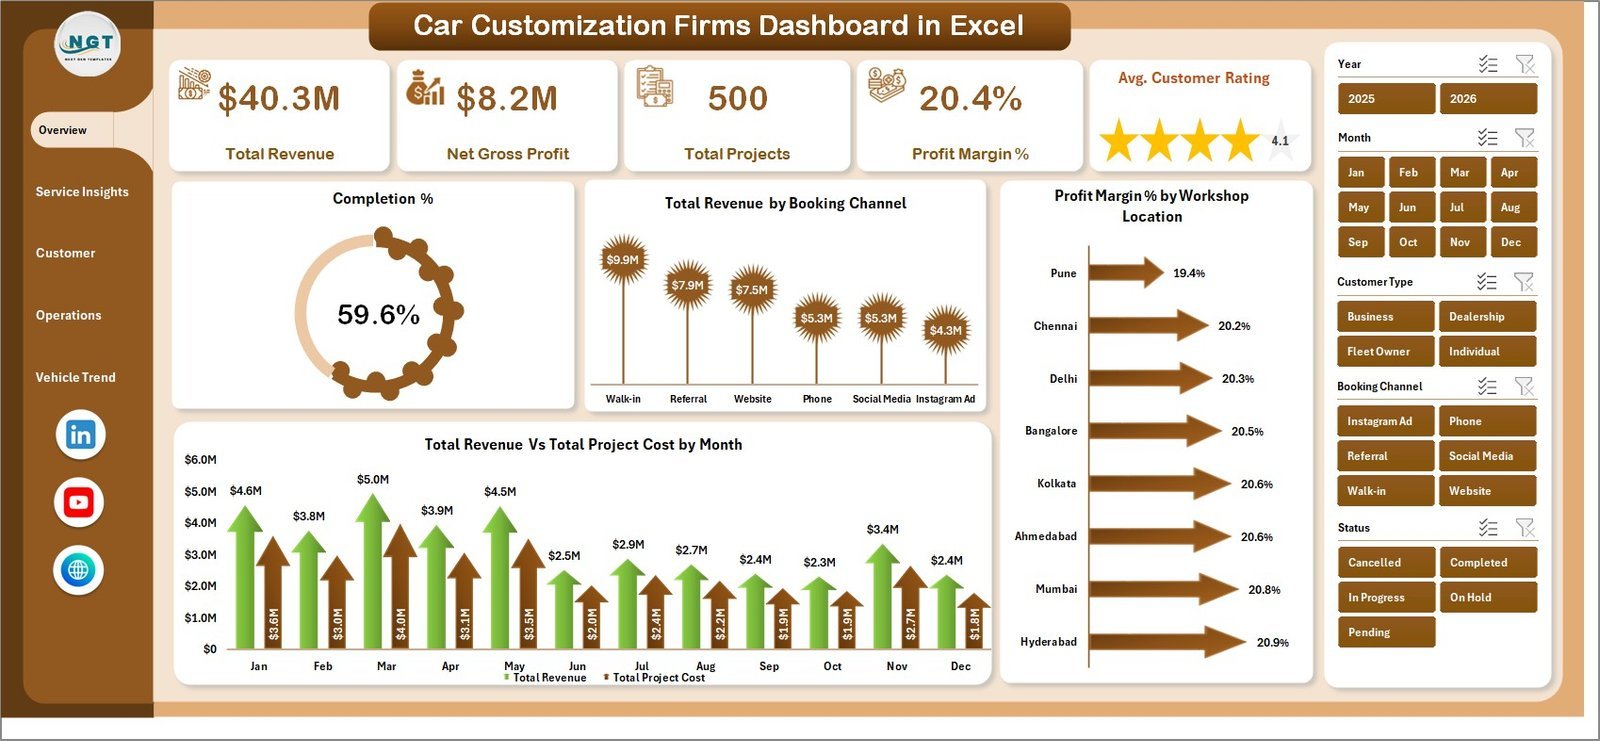
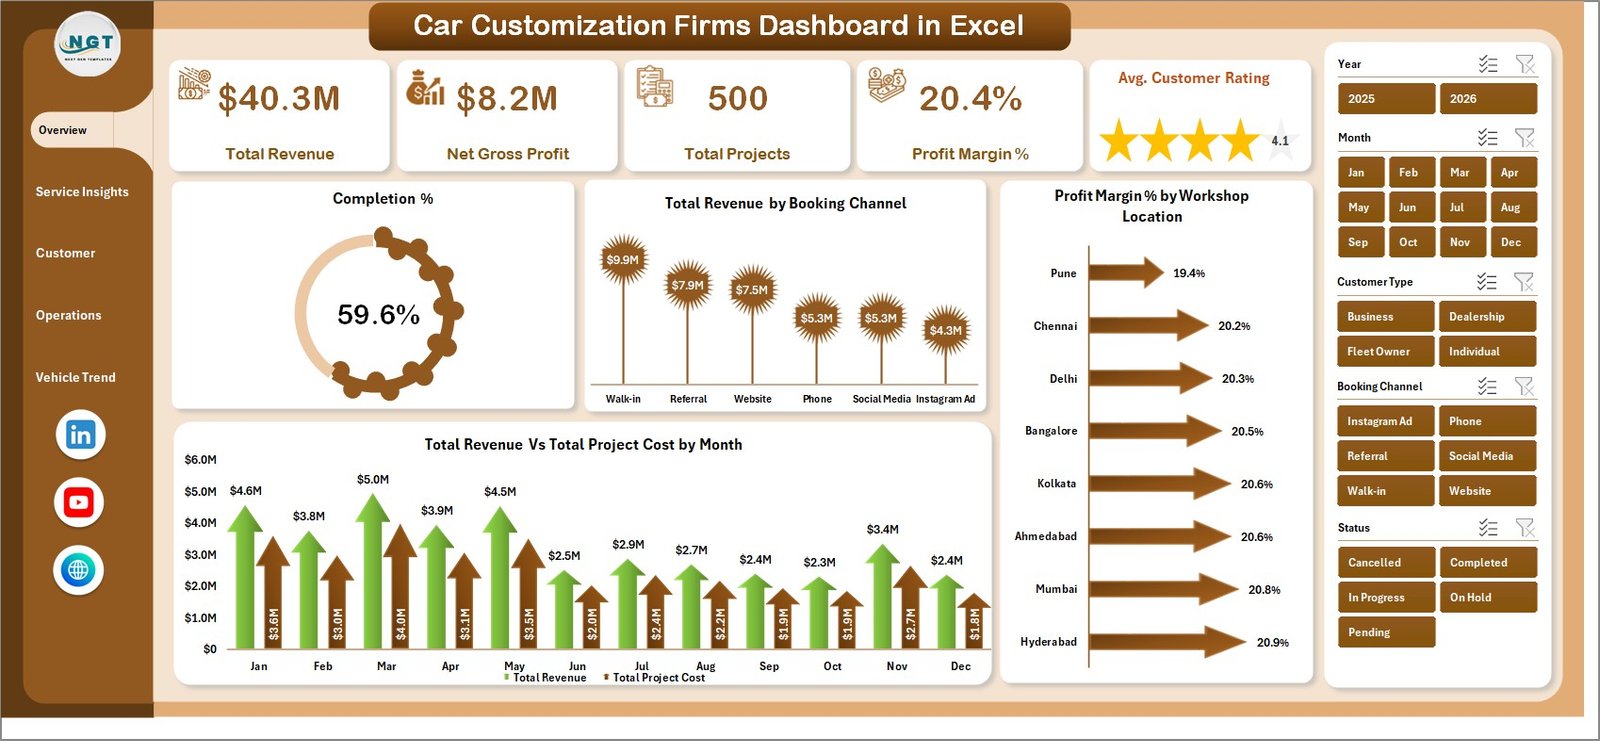
The Overview page delivers a high-level snapshot of your business performance with 5 KPI cards and 4 interactive charts. Slicers let you filter the entire page by any dimension in seconds.
KPI Cards on the Overview Page:
- Total Revenue – Total income generated across all customization projects
- Net Gross Profit – Revenue minus project cost, showing overall profitability
- Total Projects – Count of all service orders completed or in-progress
- Profit Margin % – Percentage of revenue retained after costs
- Avg. Customer Rating – Mean satisfaction score across all completed projects
Charts on the Overview Page:
- Completion % – Visual progress indicator showing the share of projects completed vs. open or in-progress
- Total Revenue by Booking Channel – Bar chart comparing revenue contribution from walk-ins, online bookings, referrals, and other channels
- Profit Margin % by Workshop Location – Location-level profitability comparison to identify your highest-margin workshops
- Total Revenue Vs Total Project Cost by Month – Dual-axis trend chart tracking monthly revenue against costs for cash flow visibility
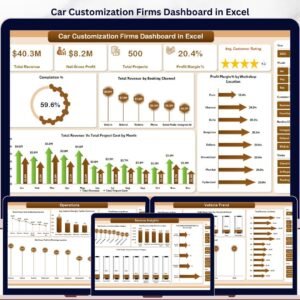
 Car Customization Firms Dashboard in Excel – Overview Page
2. Service Insights
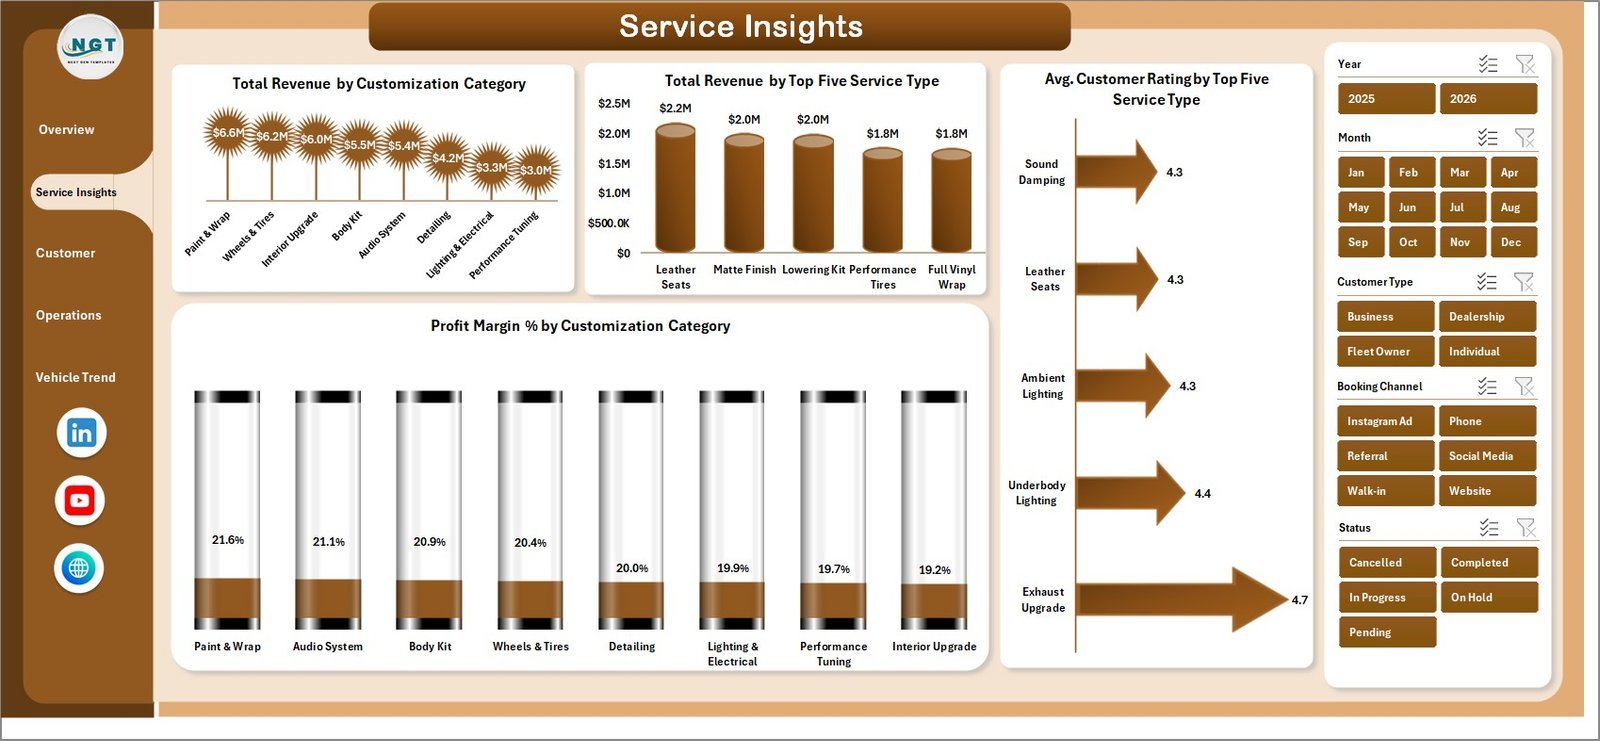
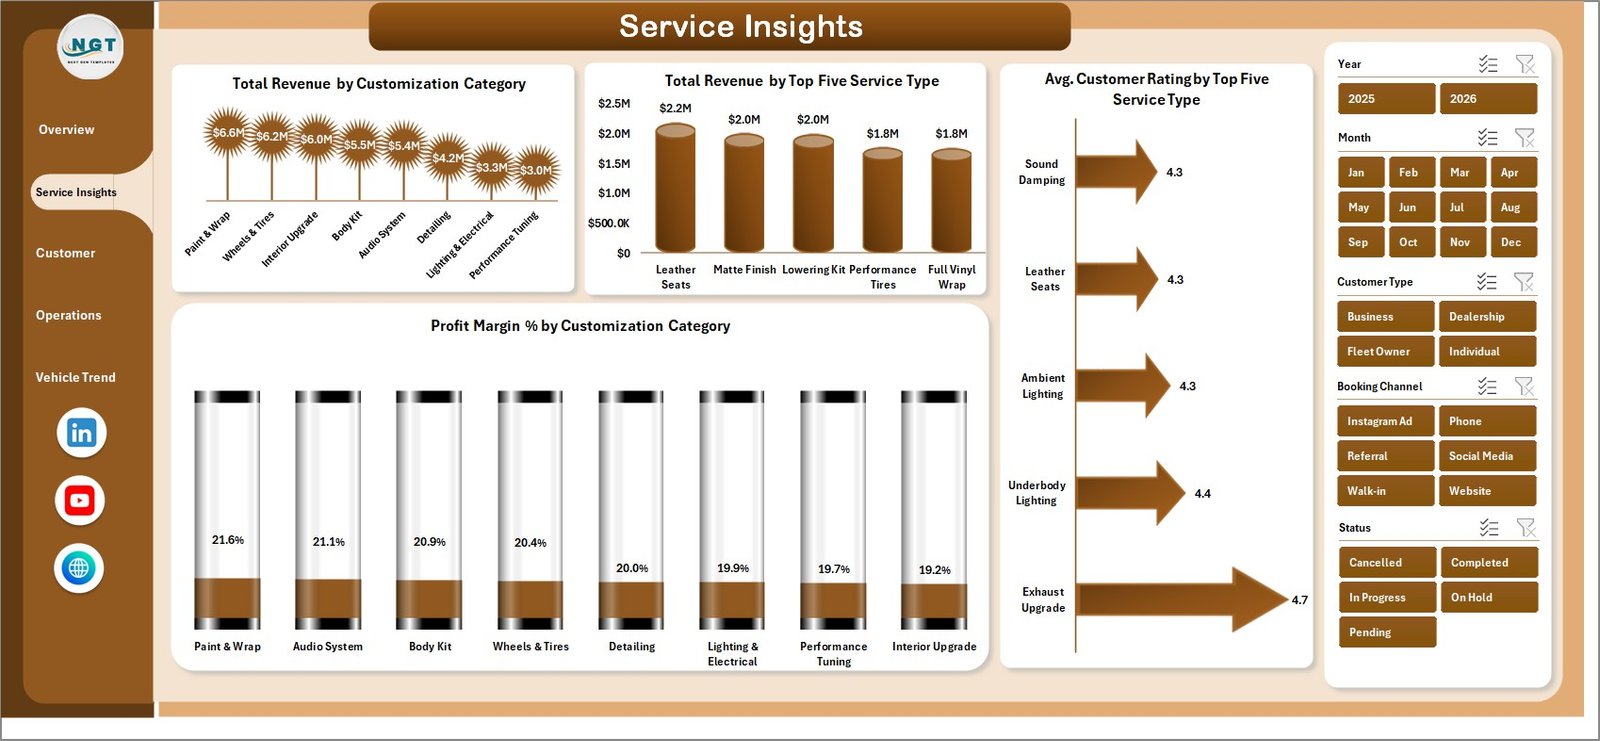
The Service Insights tab breaks down revenue and customer satisfaction by customization category and service type, helping you identify your most profitable and highest-rated offerings.
- Total Revenue by Customization Category – Ranks categories such as wraps, performance tuning, interior, and detailing by revenue
- Total Revenue by Top Five Service Type – Highlights the top 5 revenue-generating individual services
- Avg. Customer Rating by Top Five Service Type – Shows which services earn the highest satisfaction scores
- Profit Margin % by Customization Category – Reveals which service categories deliver the best margins
 Car Customization Firms Dashboard in Excel – Service Insights
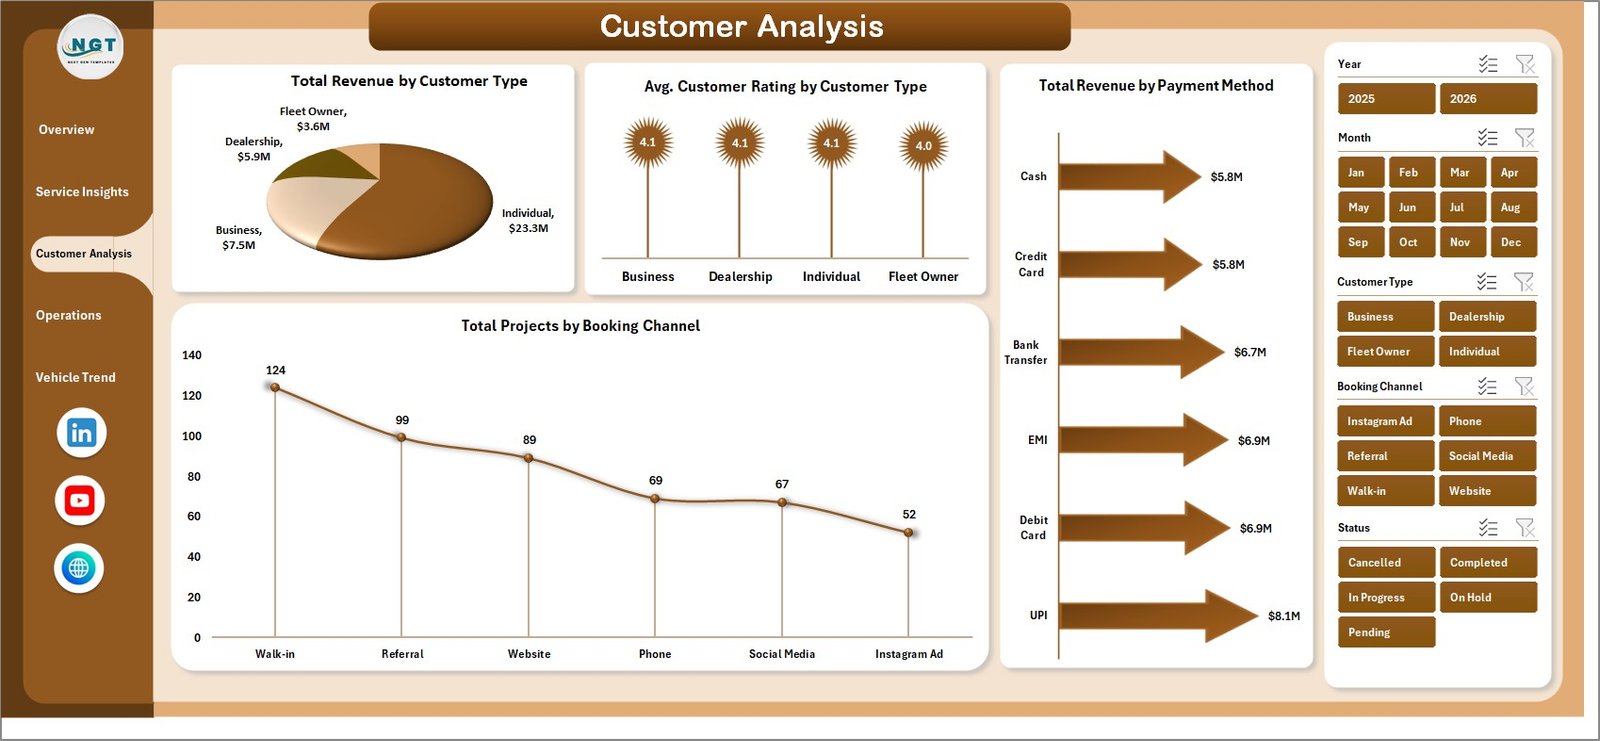
3. Customer Analysis
The Customer Analysis tab segments revenue and project counts by customer type, payment method, and booking channel to support marketing and sales strategy.
- Total Revenue by Customer Type – Compares revenue from new vs. returning vs. corporate clients
- Avg. Customer Rating by Customer Type – Measures satisfaction levels across different customer segments
- Total Revenue by Payment Method – Tracks payment mode preferences (cash, card, EMI, online) by revenue contribution
- Total Projects by Booking Channel – Shows how customers find and book your services
 Car Customization Firms Dashboard in Excel – Customer Analysis
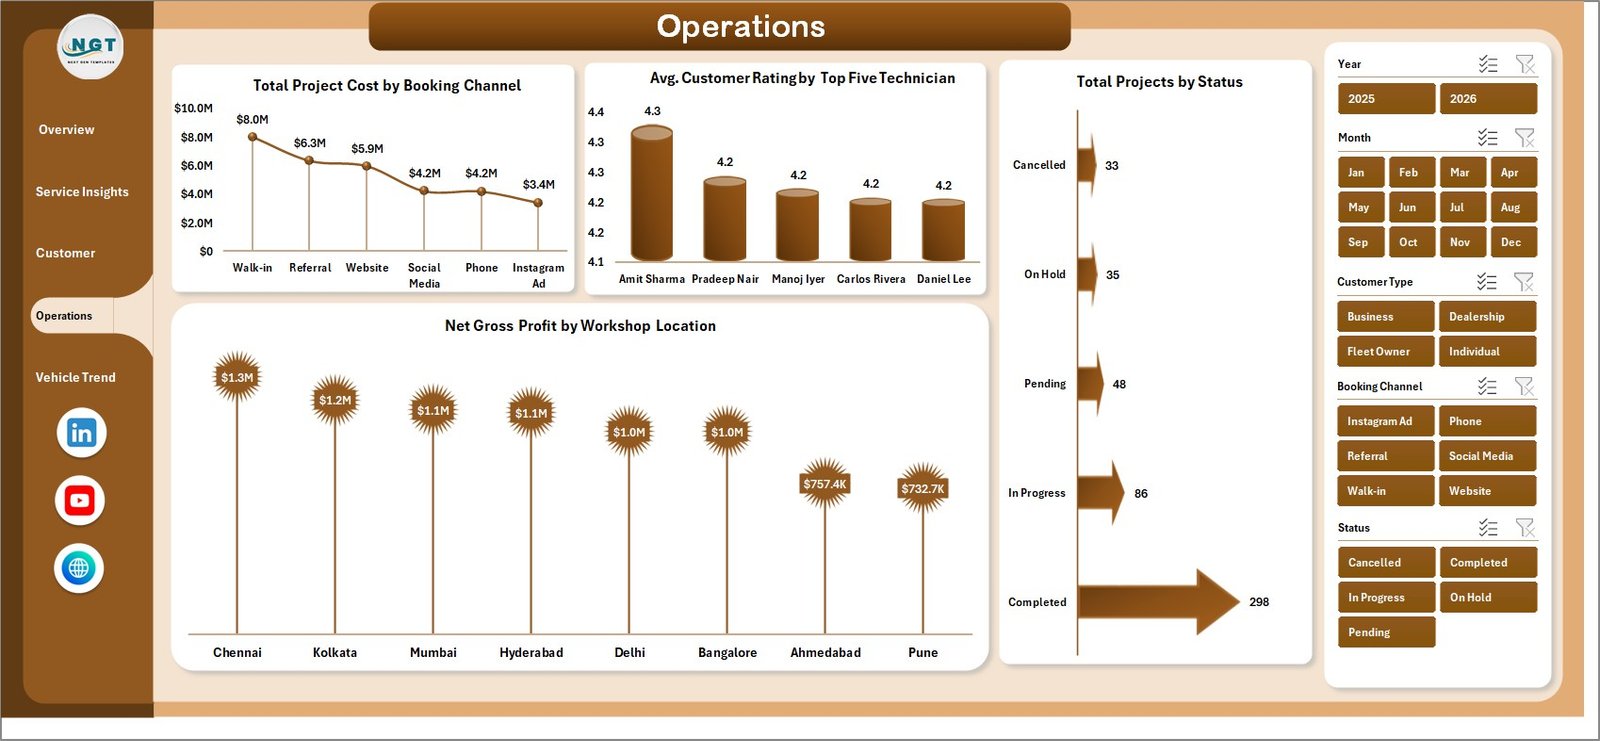
4. Operations
The Operations tab focuses on workflow efficiency, technician performance, and location-level profitability to help you optimize your team and resources.
- Total Project Cost by Booking Channel – Identifies which acquisition channels carry the highest operational cost
- Avg. Customer Rating by Top Five Technician – Ranks your top 5 technicians by customer satisfaction score
- Total Projects by Status – Breakdown of projects by completion stage (completed, in progress, pending)
- Net Gross Profit by Workshop Location – Location-level profitability view to guide resource allocation decisions
 Car Customization Firms Dashboard in Excel – Operations
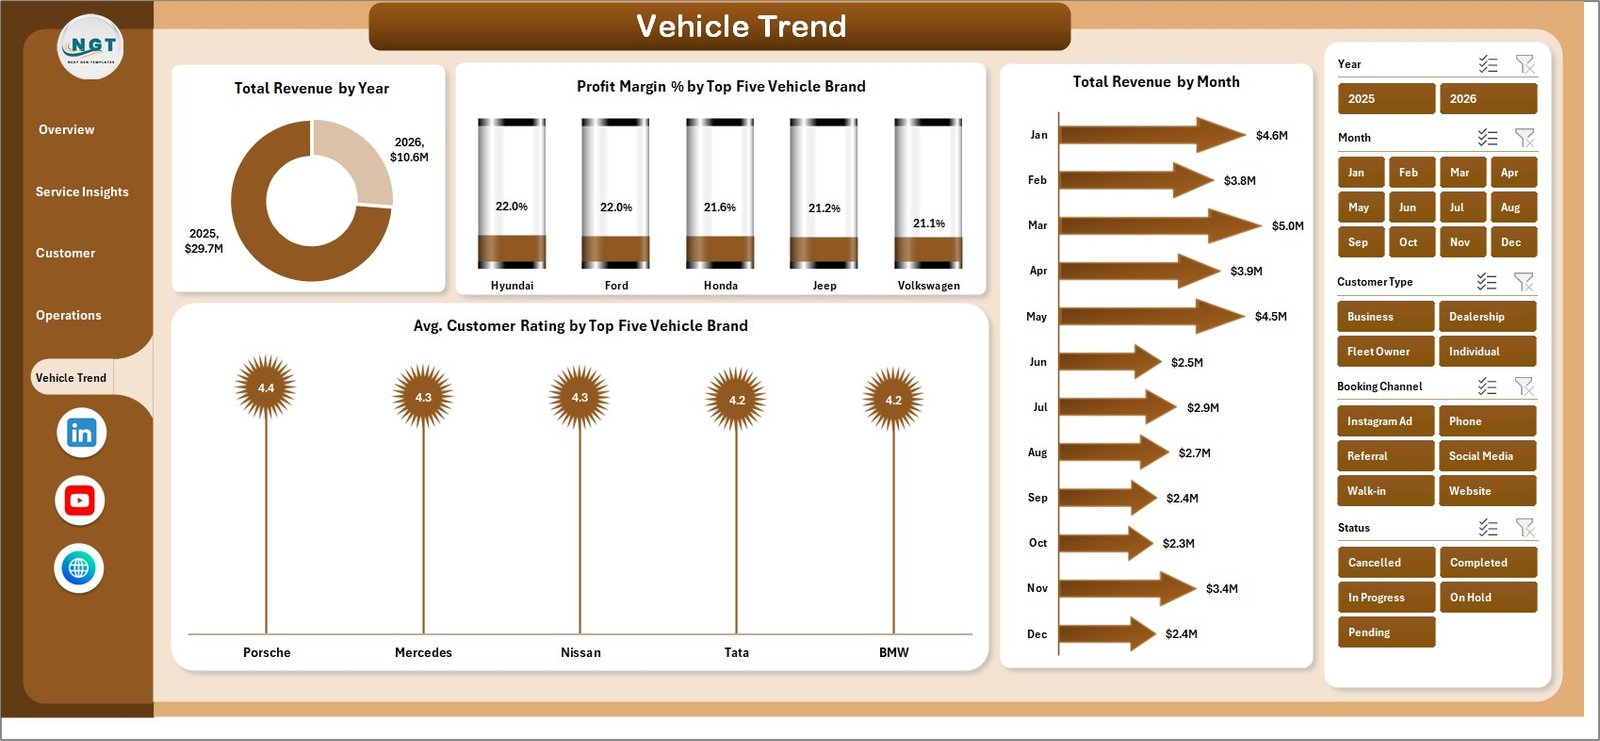
5. Vehicle Trend
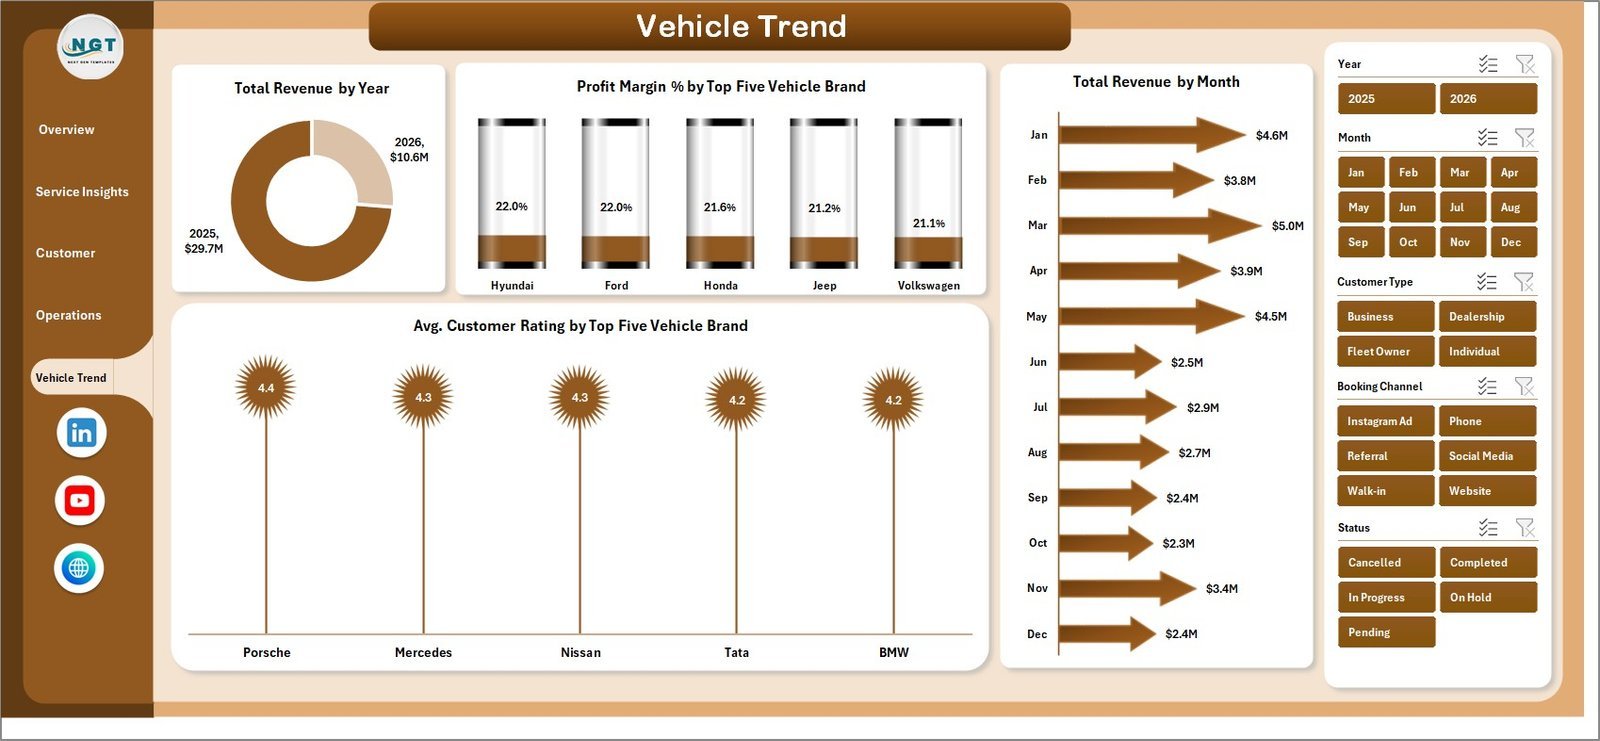
The Vehicle Trend tab analyzes performance data by vehicle brand, year, and month to surface trends in demand and profitability by vehicle type.
- Total Revenue by Year – Year-over-year revenue trend to measure business growth
- Profit Margin % by Top Five Vehicle Brand – Compares margin performance across your most serviced car brands
- Total Revenue by Month – Monthly seasonality view for demand forecasting and staffing planning
- Avg. Customer Rating by Top Five Vehicle Brand – Highlights which vehicle brands are associated with the highest customer satisfaction
 Car Customization Firms Dashboard in Excel – Vehicle Trend
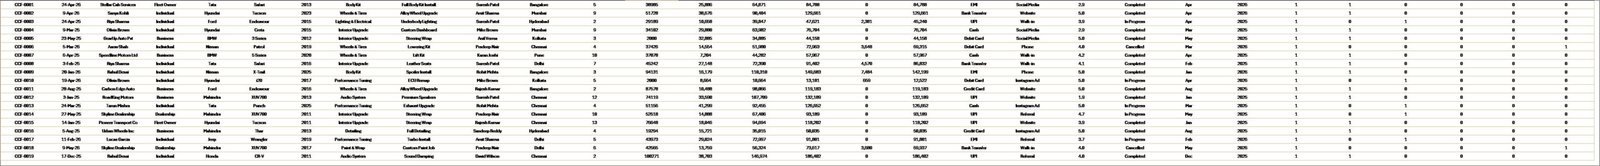
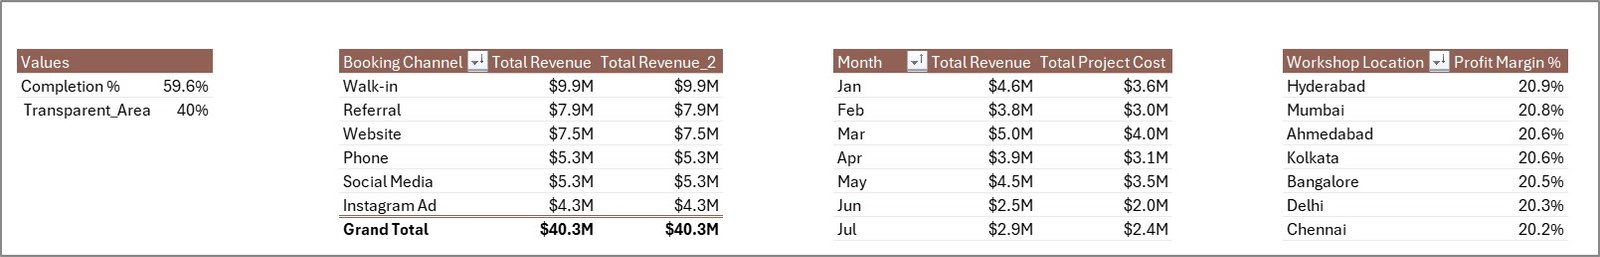
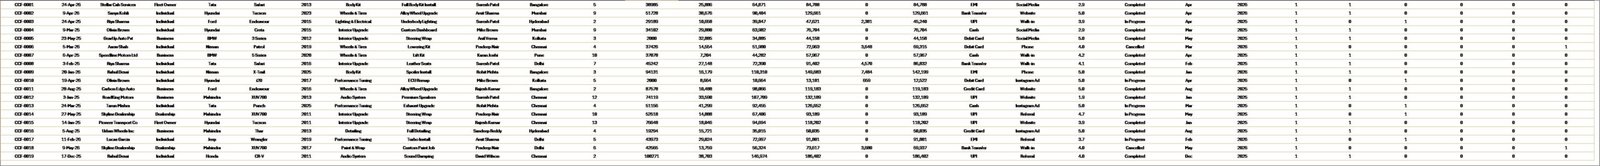
6. Data Sheet Tab
The Data sheet is where you enter all your project records in a structured table format. Each row represents one project/service order. Add your real data here in the same column format as the sample data provided.
 Car Customization Firms Dashboard in Excel – Data Sheet Tab
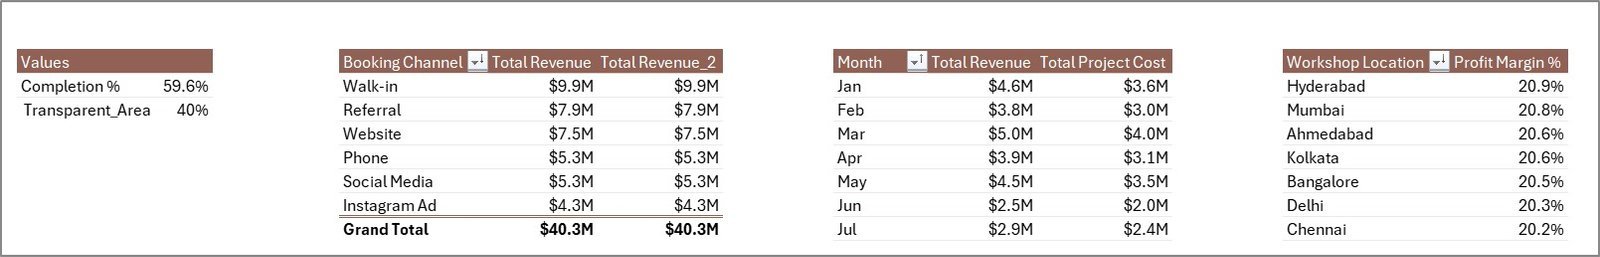
7. Support Sheet Tab
The Support sheet contains all the pivot tables that power every chart and KPI across the dashboard. After updating your data, go to the Excel Ribbon → Data → Refresh All to update everything instantly. You can keep this sheet hidden in your final working file.
 Car Customization Firms Dashboard in Excel – Support Sheet Tab
Key Features
- ✅ 5 analysis pages: Overview, Service Insights, Customer Analysis, Operations, Vehicle Trend
- ✅ 20+ charts covering revenue, profit, ratings, and project metrics
- ✅ Interactive slicers for instant multi-dimensional filtering
- ✅ Pivot-driven: refresh all data with one click (Data → Refresh All)
- ✅ No macros required – works on Excel 2016 and above
- ✅ Structured data sheet with clearly labeled columns for fast data entry
- ✅ Workshop-level, technician-level, and brand-level breakdowns
- ✅ Booking channel and payment method analysis for sales strategy
Who Should Use This Dashboard?
- Car customization shops and detailing studios
- Vehicle wrapping and paint protection businesses
- Performance modification and tuning workshops
- Auto accessory retailers with installation services
- Multi-location automotive service operators
- Business analysts and operations managers in the automotive sector
How to Use This Excel Dashboard
- Download and open the Excel file – enable editing if prompted
- Navigate to the Data Sheet and replace the sample data with your own project records
- Go to Data → Refresh All in the Excel Ribbon to update all pivot tables and charts
- Use the slicers on each page to filter by date range, location, booking channel, or other dimensions
- Hide the Support Sheet if preferred – it does not affect dashboard functionality
Technical Specifications
| Attribute | Details |
|---|---|
| Format | Microsoft Excel (.xlsx) |
| Compatibility | Excel 2016, 2019, 2021, Microsoft 365 |
| Macros Required | No |
| Pivot Tables | Yes – native Excel pivot tables |
| Slicers | Yes – interactive multi-dimension filters |
| Pages | 7 sheet tabs |
| Sample Data | Included |
Car Customization Dashboard vs. Generic Business Dashboard
| Feature | Car Customization Firms Dashboard | Generic Business Dashboard |
|---|---|---|
| Industry-specific KPIs | ✅ Revenue, Profit Margin, Avg. Rating | ❌ Generic metrics |
| Vehicle Brand Analytics | ✅ Top 5 brands by revenue and rating | ❌ Not available |
| Technician Performance | ✅ Rating by top 5 technicians | ❌ Not available |
| Booking Channel Analysis | ✅ Revenue and projects by channel | ❌ Not available |
| Workshop Location Breakdown | ✅ Profit margin by location | ❌ Not available |
| Pivot-Driven Refresh | ✅ One-click Data → Refresh All | ❌ Manual updates |
Frequently Asked Questions
Does this dashboard require any macros or VBA?
No. The Car Customization Firms Dashboard in Excel is built entirely with native pivot tables and slicers. No macros or VBA knowledge is required to use it.
Can I add more data rows beyond the sample data?
Yes. Simply add new rows below the existing data in the Data Sheet in the same column format. Then go to Data → Refresh All to update the dashboard.
Will this work on Excel 2016?
Yes. This dashboard is compatible with Excel 2016, 2019, 2021, and Microsoft 365 on both Windows and Mac.
Can I add my own workshop locations, technicians, or service categories?
Yes. Just enter the new values in your data rows and the pivot tables will pick them up automatically after a refresh.
What file format is included in the download?
The download contains a .xlsx file (Excel Workbook). No installation is needed – simply open it in Microsoft Excel.
Can I use this for multiple branches or locations?
Yes. The Operations tab includes a Net Gross Profit by Workshop Location chart, and slicers allow you to filter all pages by location independently.
Related Templates You May Like
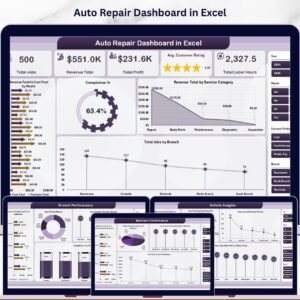
- Auto Repair Dashboard in Excel
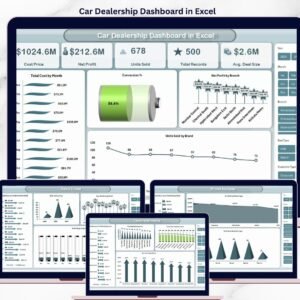
- Car Dealership Dashboard in Google Sheets
- Autonomous Vehicles Dashboard in Excel
- Fleet Management Dashboard in Google Sheets
📖 Click here to read the Detailed Blog Post
🎥 Visit our YouTube channel for step-by-step video tutorials
👉 YouTube.com/@NextGenTemplates
Watch the step-by-step video tutorial:
YouTube


Reviews
There are no reviews yet.