
SaaS Customer Success Dashboard in Excel gives SaaS founders, CSM leaders, and RevOps teams a ready-made workbook for tracking MRR, contract value, support tickets, customer health, renewals, and at-risk accounts in one place. Customer success teams often lose hours every month stitching together CRM exports, billing files, and support reports. This Excel dashboard turns that scattered data into 5 analysis pages, 5 executive KPI cards, pivot-powered charts, and slicers that update after a simple Refresh All. You get instant download, lifetime access, no subscription, and full control of your own data.
Key Features of SaaS Customer Success Dashboard in Excel
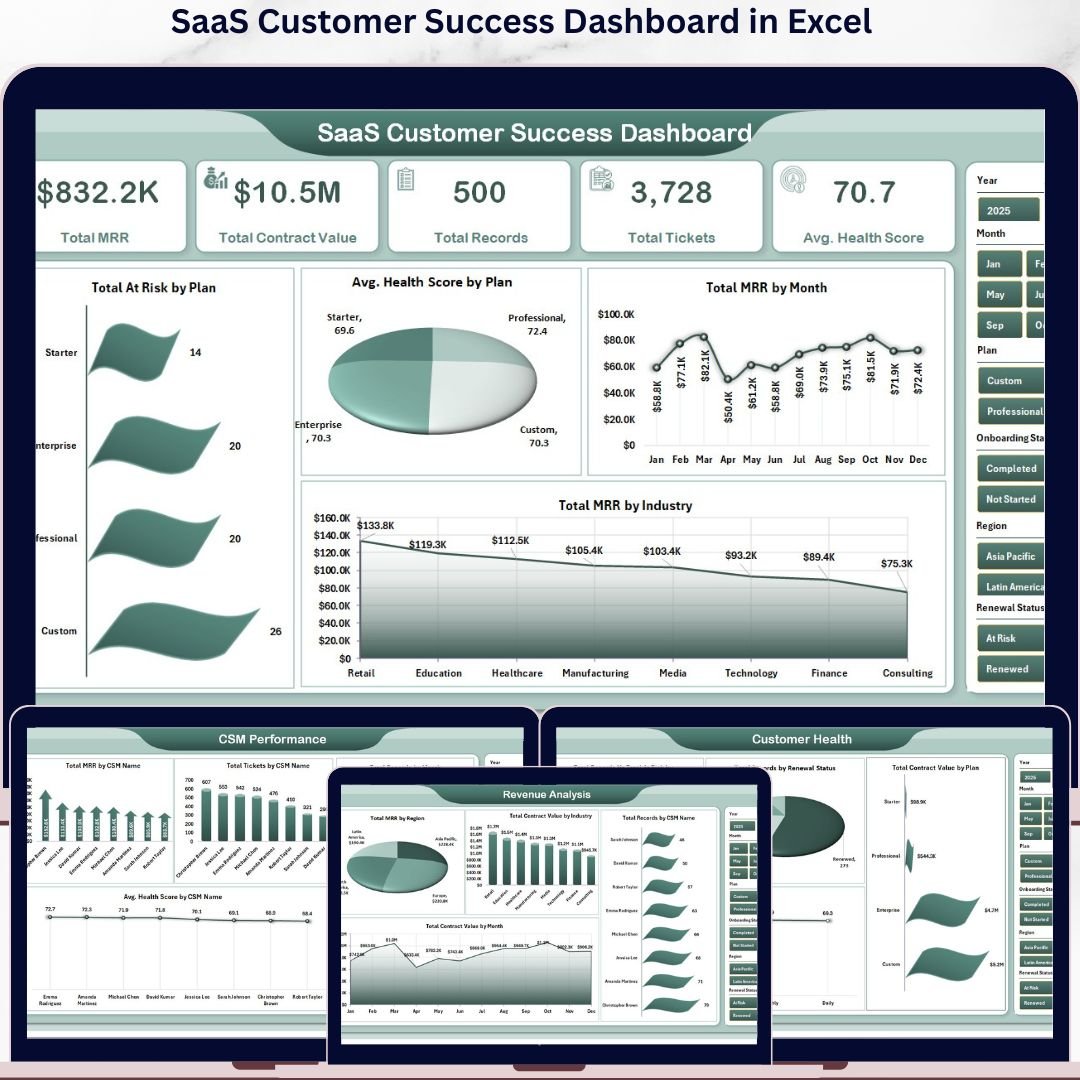
This dashboard is built for recurring-revenue teams that need clear customer visibility without paying for an enterprise customer success platform. The Overview page includes 5 headline cards: Total MRR, Total Contract Value, Total Records, Total Tickets, and Avg. Health Score. These cards help leaders check revenue scale, account volume, support pressure, and customer health at a glance.
The workbook includes multiple slicers so you can filter the dashboard quickly by plan, industry, CSM, region, renewal status, login frequency, onboarding status, and month. Every page is powered by pivot tables, which means the visuals refresh dynamically when you update the Data sheet.
Charts include Total At Risk by Plan, Avg. Health Score by Plan, Total MRR by Month, Total MRR by Industry, Total Contract Value by Plan, Total MRR by Region, Total Tickets by CSM Name, Total Renewed by Month, and more. These views make the dashboard useful for weekly CS standups, renewal reviews, support escalation meetings, and executive reporting.
What’s Inside the SaaS Customer Success Dashboard in Excel
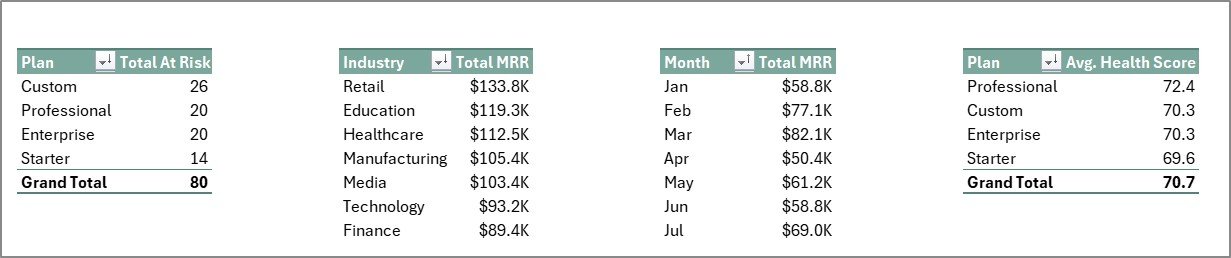
Overview Page: The main summary page displays Total MRR, Total Contract Value, Total Records, Total Tickets, and Avg. Health Score. The Total At Risk by Plan chart shows which pricing tiers carry the most customer risk. Avg. Health Score by Plan helps you compare customer quality across subscription levels. Total MRR by Month reveals recurring revenue movement over time. Total MRR by Industry identifies which customer segments contribute the strongest revenue base.
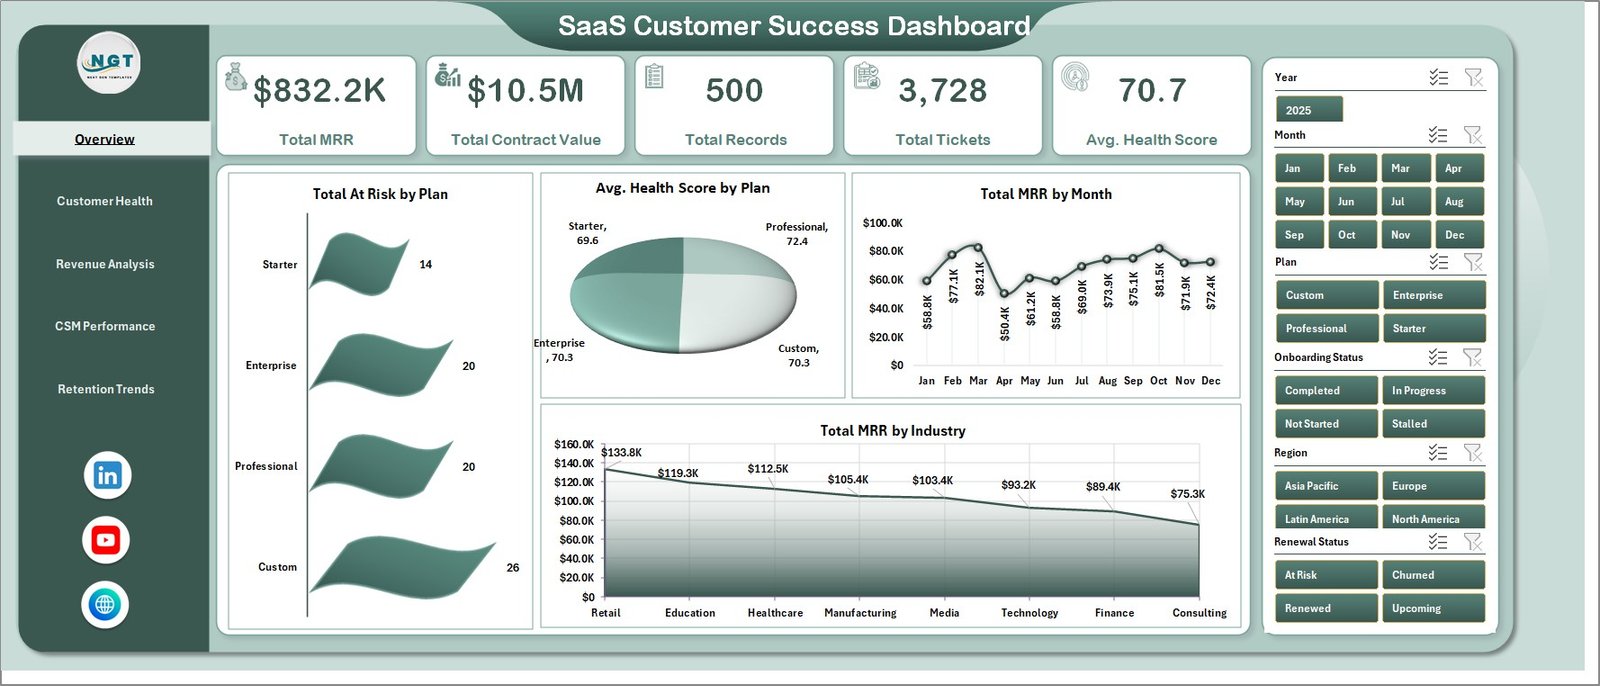
SaaS Customer Success Dashboard in Excel
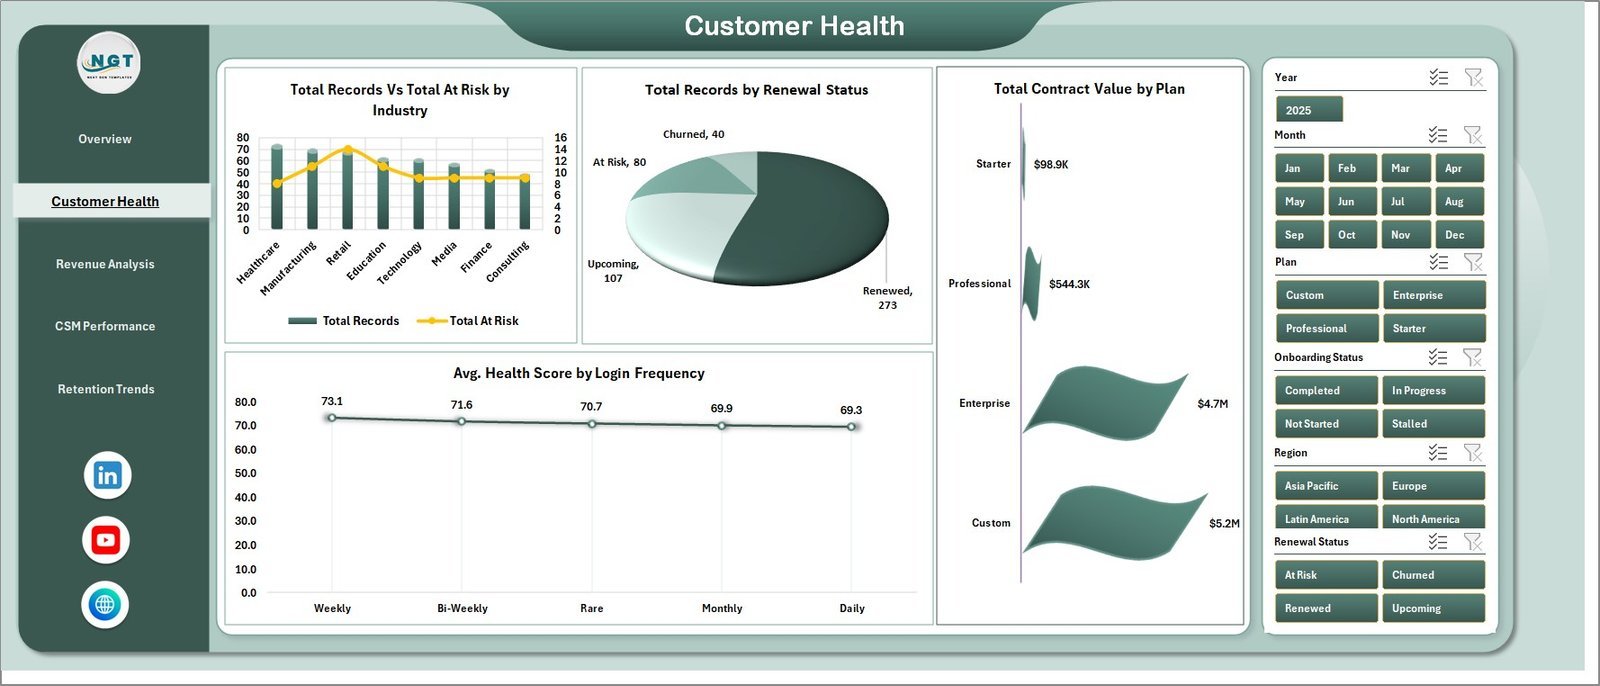
Customer Health: This sheet focuses on account quality and risk. Total Records vs Total At Risk by Industry helps you see where customer issues are concentrated. Total Records by Renewal Status shows how many accounts are renewed, pending, or at risk. Total Contract Value by Plan connects risk analysis with revenue impact. Avg. Health Score by Login Frequency shows whether product engagement is translating into healthier accounts.
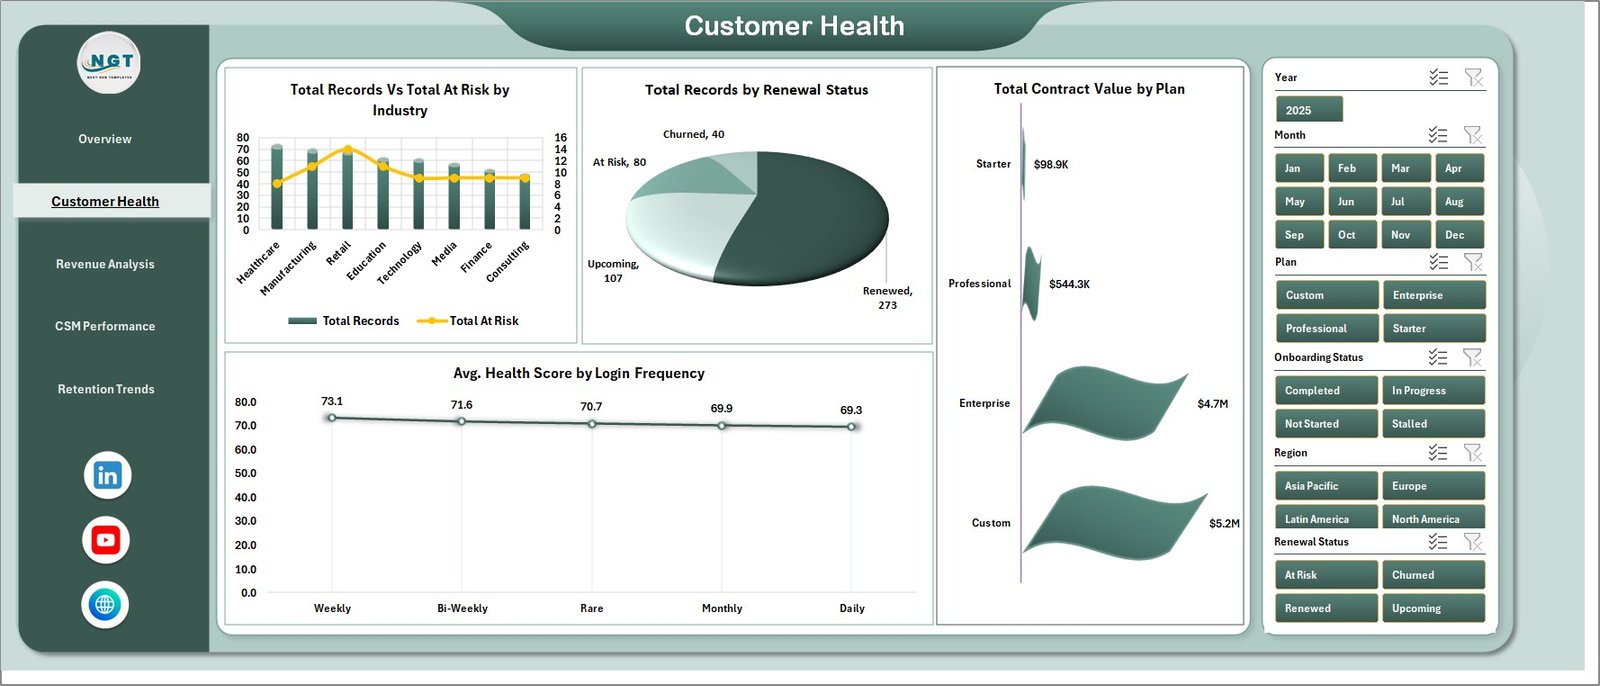
Customer Health
Revenue Analysis: This page helps finance and CS teams understand where revenue is coming from. Total MRR by Region highlights geographic revenue distribution. Total Contract Value by Industry shows which segments carry the largest commitments. Total Records by CSM Name compares account ownership. Total Contract Value by Month helps leadership monitor contract-value movement over time.
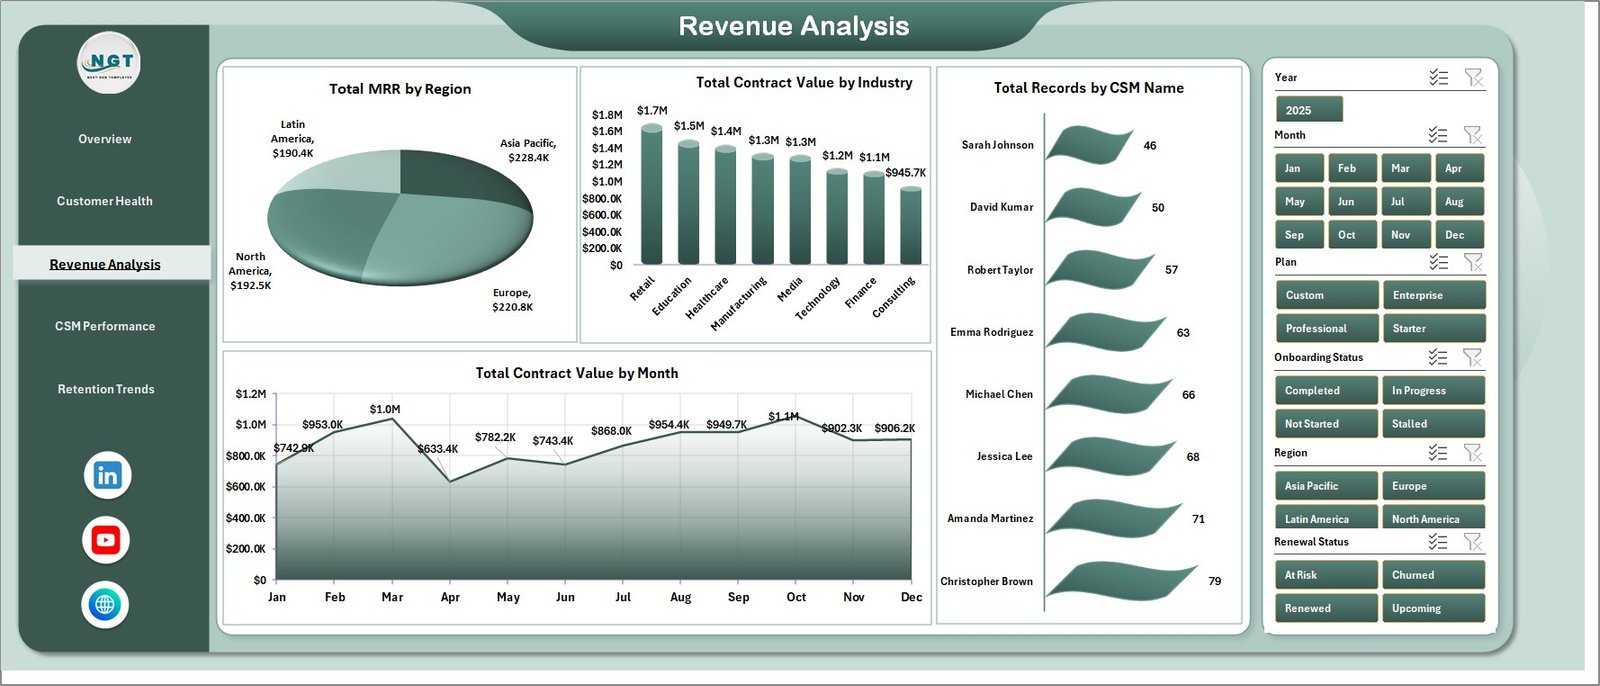
Revenue Analysis
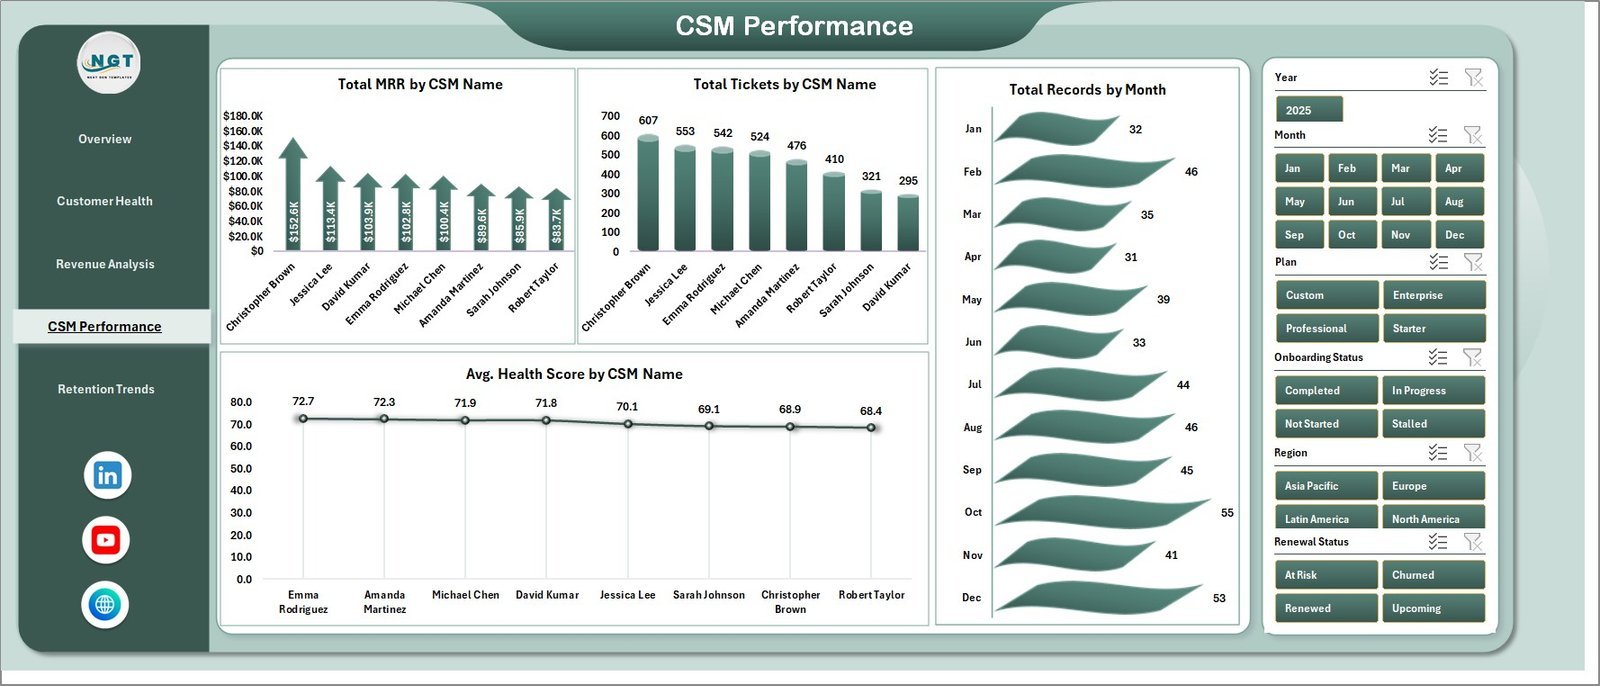
CSM Performance: This tab gives managers a coaching view. Total MRR by CSM Name compares portfolio value. Total Tickets by CSM Name reveals workload and support pressure. Total Records by Month tracks account volume trends. Avg. Health Score by CSM Name helps spot which portfolios need extra attention.
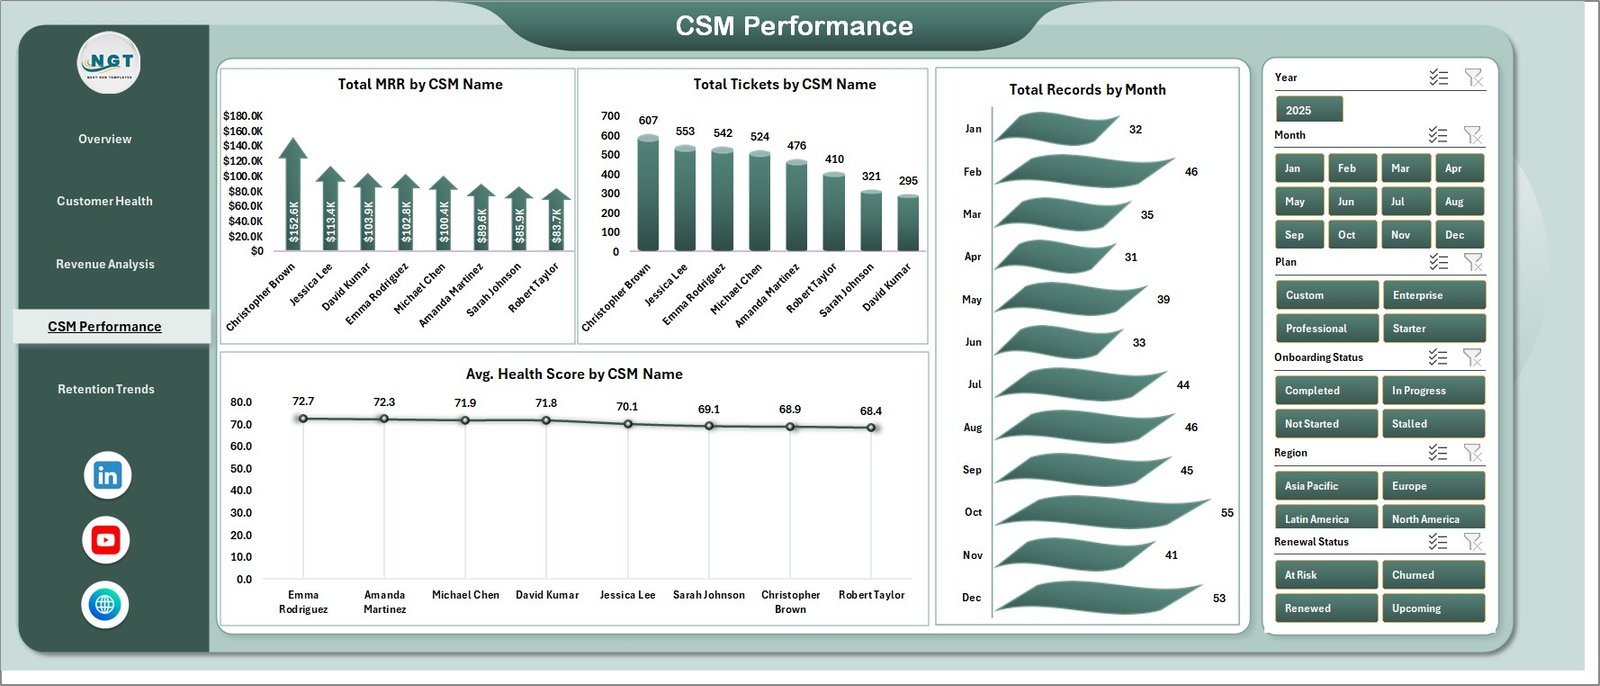
CSM Performance
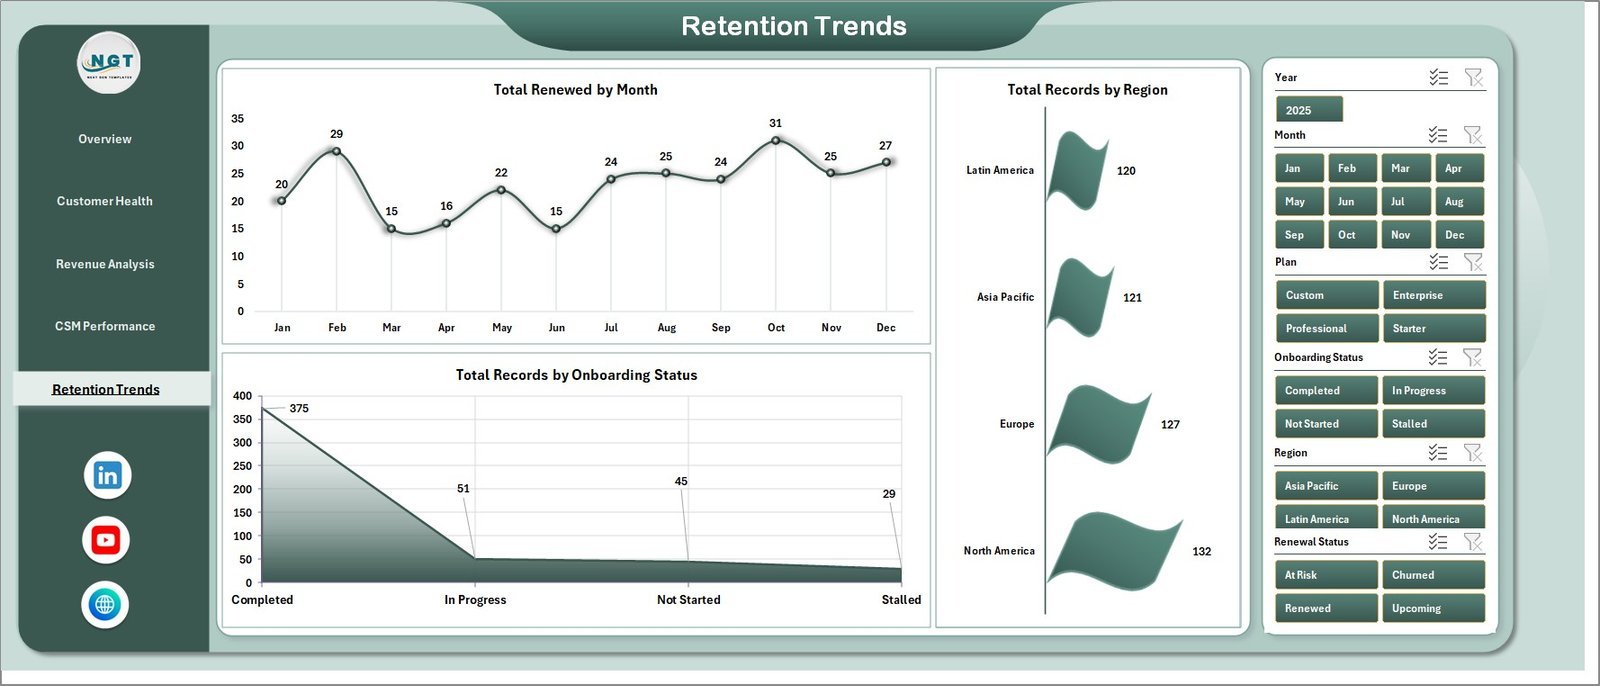
Retention Trends: This sheet focuses on renewal and retention movement. Total Renewed by Month shows renewal progress over time. Total Records by Region explains where the account base is concentrated. Total Records by Onboarding Status connects onboarding completion with the wider customer success process.
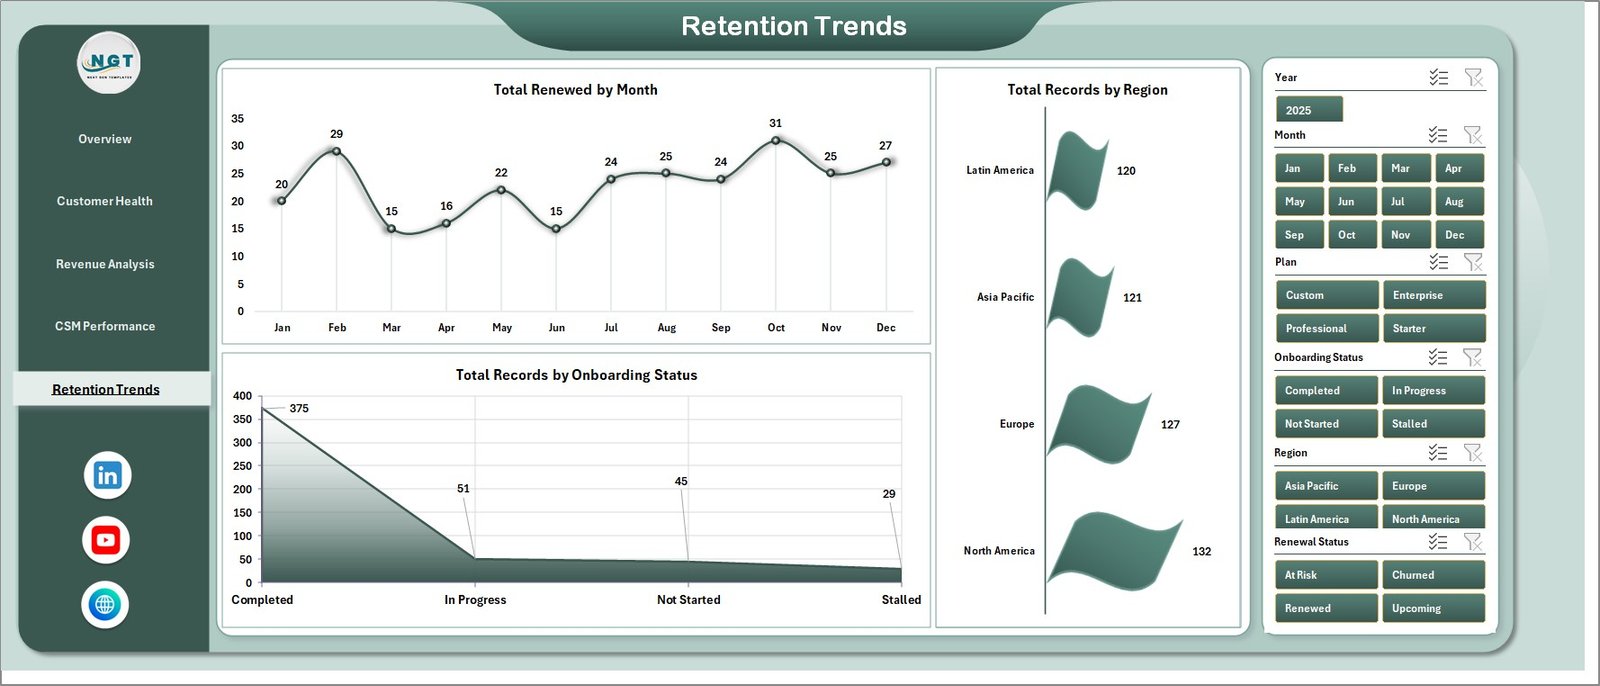
Retention Trends
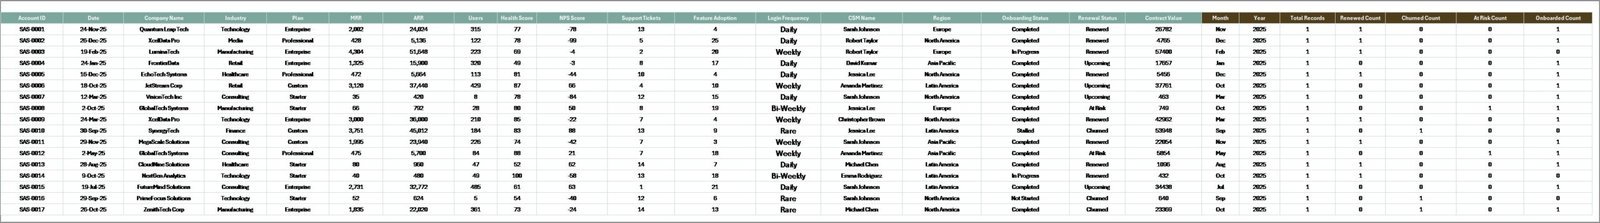
Data Sheet: Add your customer success records in the same structure as the sample data. Keep the headers consistent, paste or replace the rows, then refresh the workbook.

Data Sheet tab
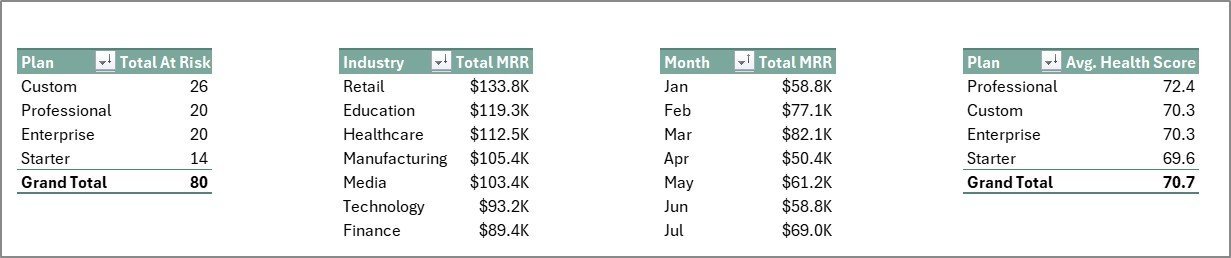
Support Sheet: This sheet contains the pivot tables used to build the dashboard. After updating the Data sheet, go to the Data tab in Excel and click Refresh All. You can keep this sheet hidden when sharing the dashboard with stakeholders.
Support sheet tab
SaaS Customer Success Dashboard in Excel vs. Google Sheets vs. Paid CRM/SaaS – Where This Fits
| Feature | SaaS Customer Success Dashboard in Excel | Google Sheets Alternative | Paid CS Platform |
|---|---|---|---|
| Cost | $17.99 one-time | Lower one-time cost, browser based | Often $2,500+ per year |
| Platform | Microsoft Excel desktop workbook | Google Sheets cloud file | Hosted SaaS platform |
| Setup time | Under 10 minutes | Under 10 minutes | Several weeks of onboarding |
| Customizable fields | Fully editable Excel data and pivots | Editable sheet and formulas | Depends on vendor configuration |
| Refresh method | Data tab, Refresh All | Formula and chart recalculation | Automated integrations |
| Year-1 cost at 5 users | $17.99 total | Typically under $20 total | Often $2,500 to $10,000+ |
Who This Template Is For – and Who It’s Not For
This template is ideal for SaaS founders, Customer Success Managers, RevOps analysts, account managers, and CS consultants who need a practical customer success reporting workbook. It is especially useful for teams tracking 50 to 5,000 accounts from exports rather than real-time API feeds.
It is not the right fit if you need automated playbooks, customer emails triggered by health score rules, SOC 2 audit logs, SSO, or live sync from Salesforce, HubSpot, Zendesk, Stripe, or product analytics tools. In those cases, a paid platform such as Gainsight, ChurnZero, Totango, HubSpot, or Salesforce may be better.
How to Use the SaaS Customer Success Dashboard in Excel
- Download and unzip the product file.
- Open the Excel workbook in Microsoft Excel 2016 or later.
- Go to the Data Sheet tab and replace the sample rows with your customer success data.
- Keep the same column headers and data structure.
- Open the Excel Data ribbon and click Refresh All.
- Use the slicers on each dashboard page to filter by plan, region, industry, renewal status, CSM, and month.
- Hide the Support Sheet before sharing if you want a cleaner stakeholder view.
Real-World Use Cases
Anita, Head of Customer Success at a 75-person SaaS company, uses the Overview and Customer Health pages before weekly renewal meetings. She filters by plan and renewal status to find accounts with low health scores and high contract value.
Marco, a RevOps analyst, uses the Revenue Analysis page for monthly leadership reporting. Total MRR by Region and Total Contract Value by Industry help him explain where revenue concentration is rising.
Priya, a fractional CS consultant, duplicates the workbook for each client and uses the CSM Performance page to compare portfolio load, ticket volume, and average health score across account owners.
Frequently Asked Questions
What KPIs are included in the SaaS Customer Success Dashboard in Excel?
The Overview page includes Total MRR, Total Contract Value, Total Records, Total Tickets, and Avg. Health Score.
Can I update the dashboard with my own data?
Yes. Replace the sample rows in the Data Sheet, keep the same headers, and click Refresh All from the Excel Data ribbon.
Does this dashboard use macros?
No. The dashboard is designed around Excel tables, pivot tables, charts, and slicers, so it does not require VBA macros.
Can I customize the charts?
Yes. You can edit chart formatting, adjust pivot fields, add slicers, and extend the workbook as needed.
Is this a replacement for Gainsight or ChurnZero?
It replaces many manual reporting needs, but it is not a full customer success automation platform. It is best for reporting, analysis, and account review workflows.
Will it work on Excel for Mac?
Yes, it works in modern Excel versions on Windows and Mac. Pivot refresh is most reliable in the desktop Excel app.
About the Author
Built by PK – Microsoft Certified Professional with 15+ years of Excel, Google Sheets, and Power BI experience. Founder of NextGenTemplates, reaching 300K+ subscribers across YouTube channels. Every template is hand-built and tested before release.
Explore Related Templates
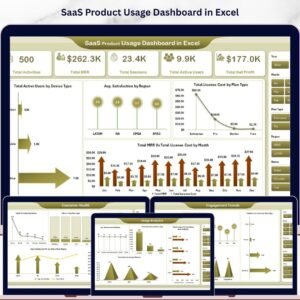
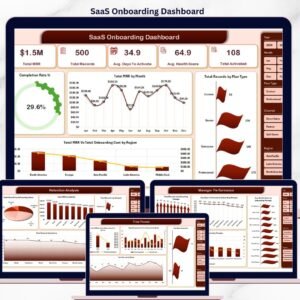
Pair this workbook with the SaaS Customer Success Dashboard in Google Sheets for browser-based team collaboration, the SaaS Onboarding Dashboard in Excel for activation tracking, and the SaaS Product Usage Dashboard in Excel for product adoption analytics. You can also browse more Excel Dashboard Templates.
Download the SaaS Customer Success Dashboard in Excel today and start reviewing customer health, renewals, MRR, tickets, and CSM performance in one workbook.
Last updated: May 2026


Reviews
There are no reviews yet.