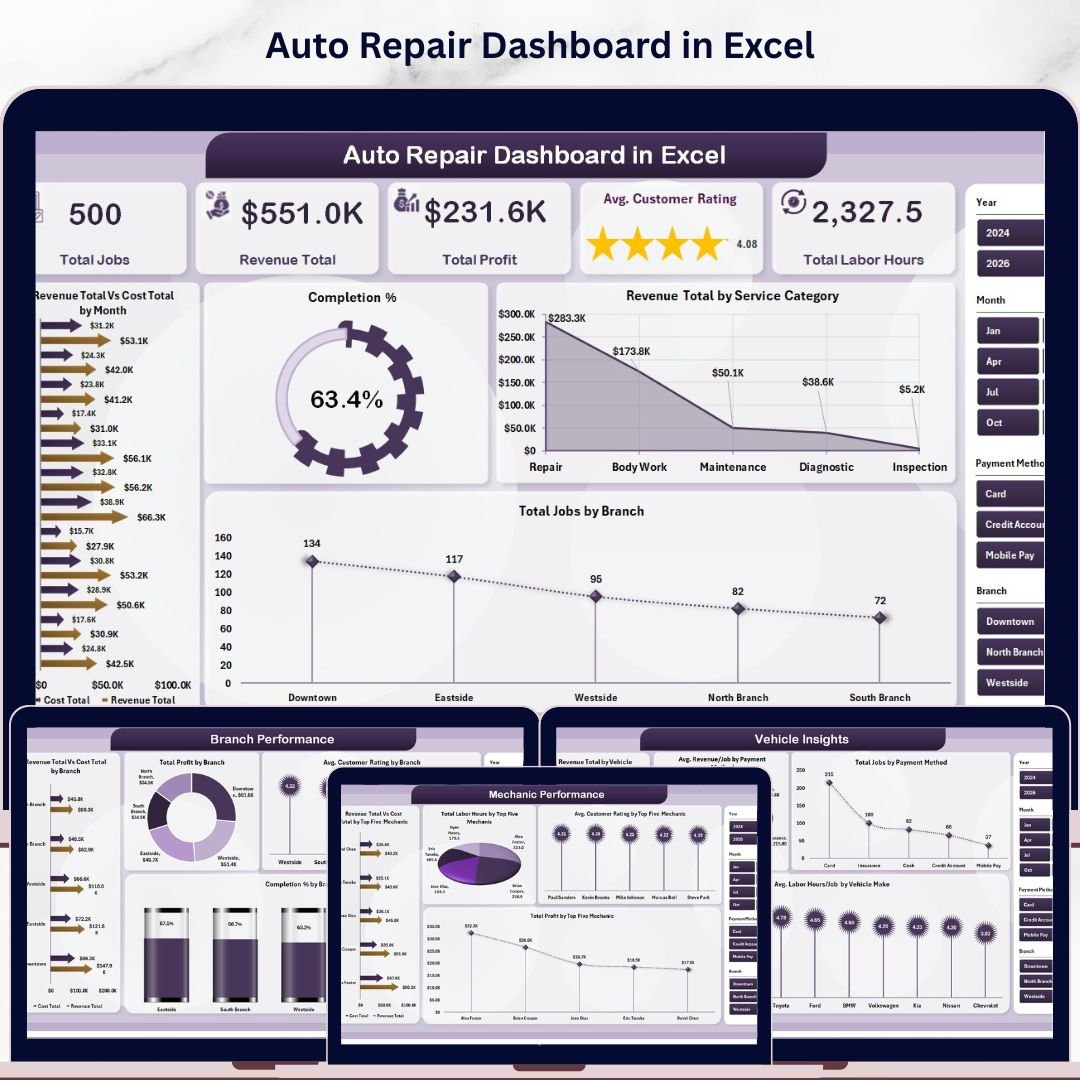
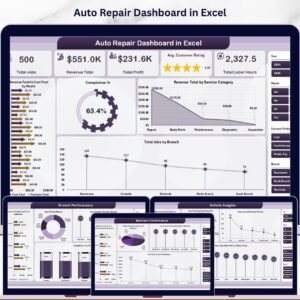
The Auto Repair Dashboard in Excel tracks 5 high-level KPIs — Total Jobs, Revenue Total, Total Profit, Avg. Customer Rating, and Total Labor Hours — across 5 interactive pages with 17 pre-built charts and slicers for branch, service category, and mechanic. Setup takes under 10 minutes: replace the sample data on the Data sheet, click Refresh All, and every chart, KPI card, and pivot updates automatically.
🌍 Join 8,400+ teams in 40+ countries using NextGenTemplates to replace paid SaaS tools with one-time-purchase Excel Dashboard Templates built for real-world service business operations.
✅ Instant download · One-time payment · No subscription · No per-user fees · Lifetime access
🔑 Key Features of Auto Repair Dashboard in Excel
🔹 5-KPI Overview Page – See Total Jobs, Revenue Total, Total Profit, Avg. Customer Rating, and Total Labor Hours at a glance. Every card recalculates instantly when you change the slicers for branch, service category, or month — giving owners a live snapshot of shop performance without opening pivot tables.
🔹 17 Pre-Built Charts Across 5 Pages – The Auto Repair Dashboard in Excel ships with revenue-vs-cost trends, completion percentages, service category breakdowns, mechanic leaderboards, branch P&L views, and vehicle-make analytics. All visuals are wired to the Support sheet’s pivot tables and refresh together.
🔹 Top-Five Mechanic Performance Tracking – A dedicated Mechanic Performance page ranks your top five mechanics on Revenue, Cost, Total Labor Hours, Avg. Customer Rating, and Total Profit. Identify which technicians drive margin and which need coaching — without manual VLOOKUPs.
🔹 Branch & Service Category P&L Views – Compare Revenue Total vs. Cost Total by branch, see Profit Margin % by service category (oil change, brake repair, transmission, diagnostics, etc.), and surface which lines are subsidising which. Built for multi-location auto repair shops.
🔹 Vehicle Insights & Payment Mix – Track Revenue by Vehicle Make, Total Jobs by Payment Method (cash, card, insurance, fleet), and Avg. Labor Hours per vehicle make. Helpful for shops deciding which makes to specialise in or which payment terms to push.
🔹 Slicer-Driven Filtering – Multiple slicers on every page let you filter by month, branch, service category, mechanic, and payment method in one click. No formulas to edit, no charts to redraw.
🔹 Data + Support Sheet Architecture – Paste your job records into the Data sheet (same column structure as the sample), hit Data → Refresh All, and the hidden Support sheet pivots regenerate every chart automatically. Standard Excel — no macros, no add-ins, no Power Query required.
📦 What’s Inside the Auto Repair Dashboard in Excel
🔹 Overview Page – Five KPI cards (Total Jobs, Revenue Total, Total Profit, Avg. Customer Rating, Total Labor Hours) plus four charts: Revenue Total vs. Cost Total by Month, Completion %, Revenue Total by Service Category, and Total Jobs by Branch.
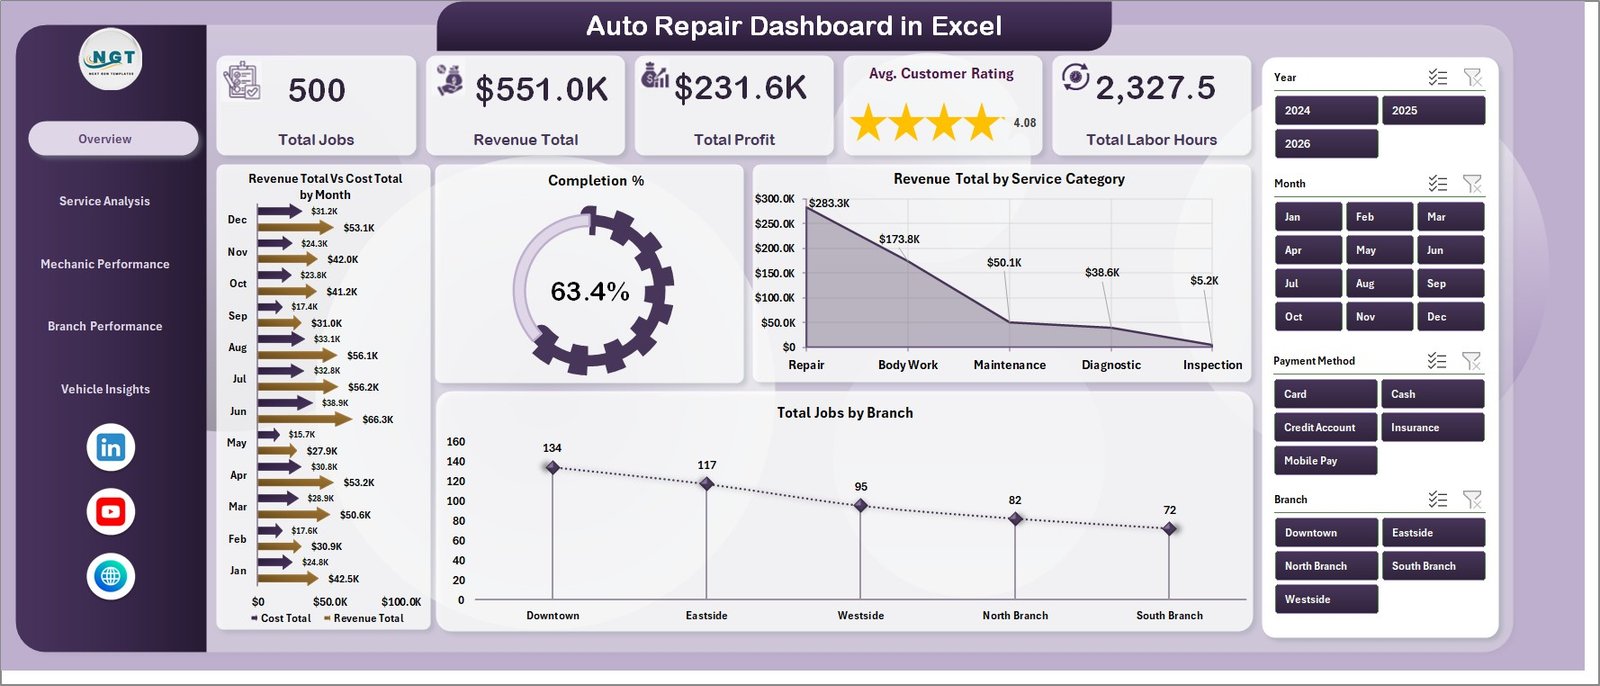 Auto Repair Dashboard in Excel
🔹 Service Analysis Page – Four service-mix charts: Revenue Total vs. Cost Total by Service Category, Profit Margin %, Avg. Revenue/Job by Service Category, and Total Jobs by Service Category. Tells you which services pay the bills and which barely break even.
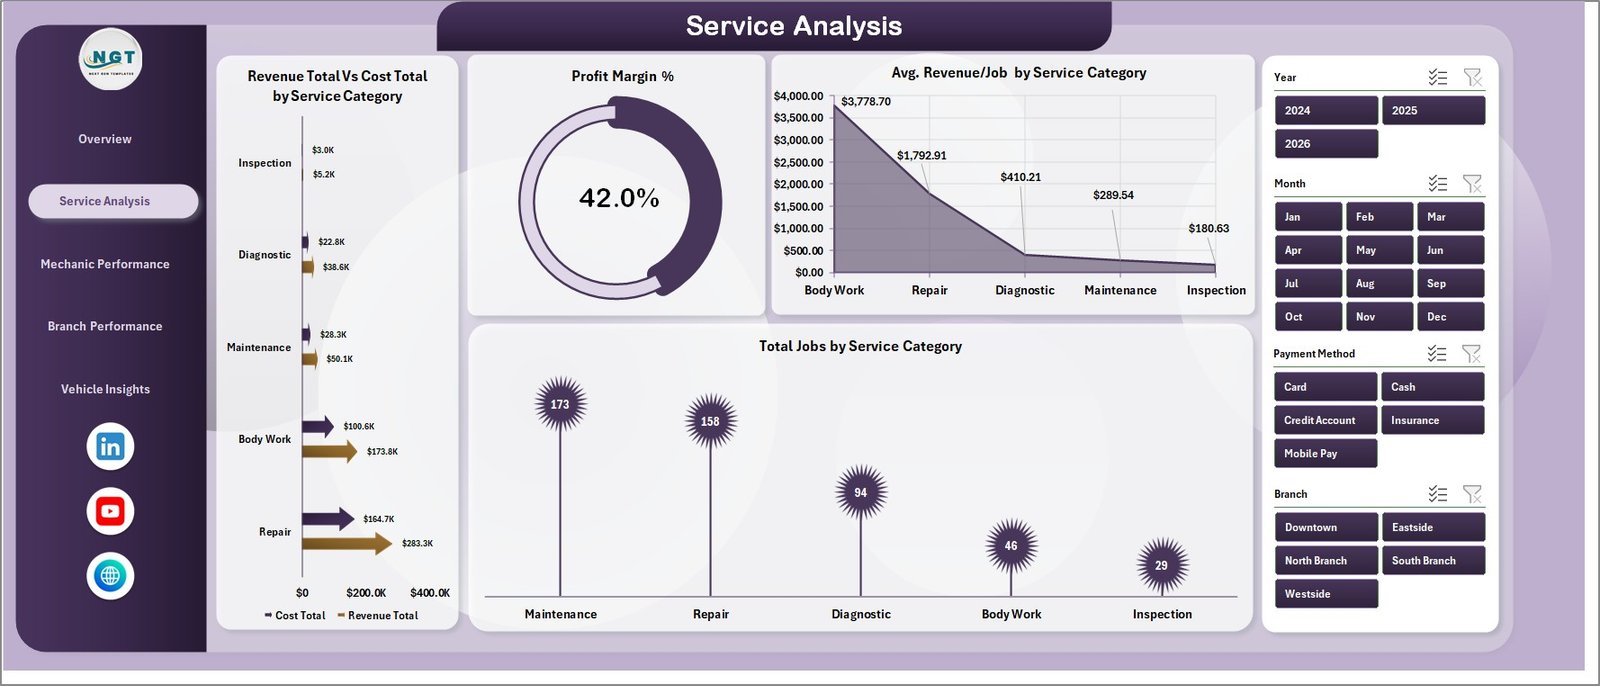 Service Analysis
🔹 Mechanic Performance Page – Top-five mechanic leaderboards on Revenue Total vs. Cost Total, Total Labor Hours, Avg. Customer Rating, and Total Profit. Ideal for monthly performance reviews and bonus calculations.
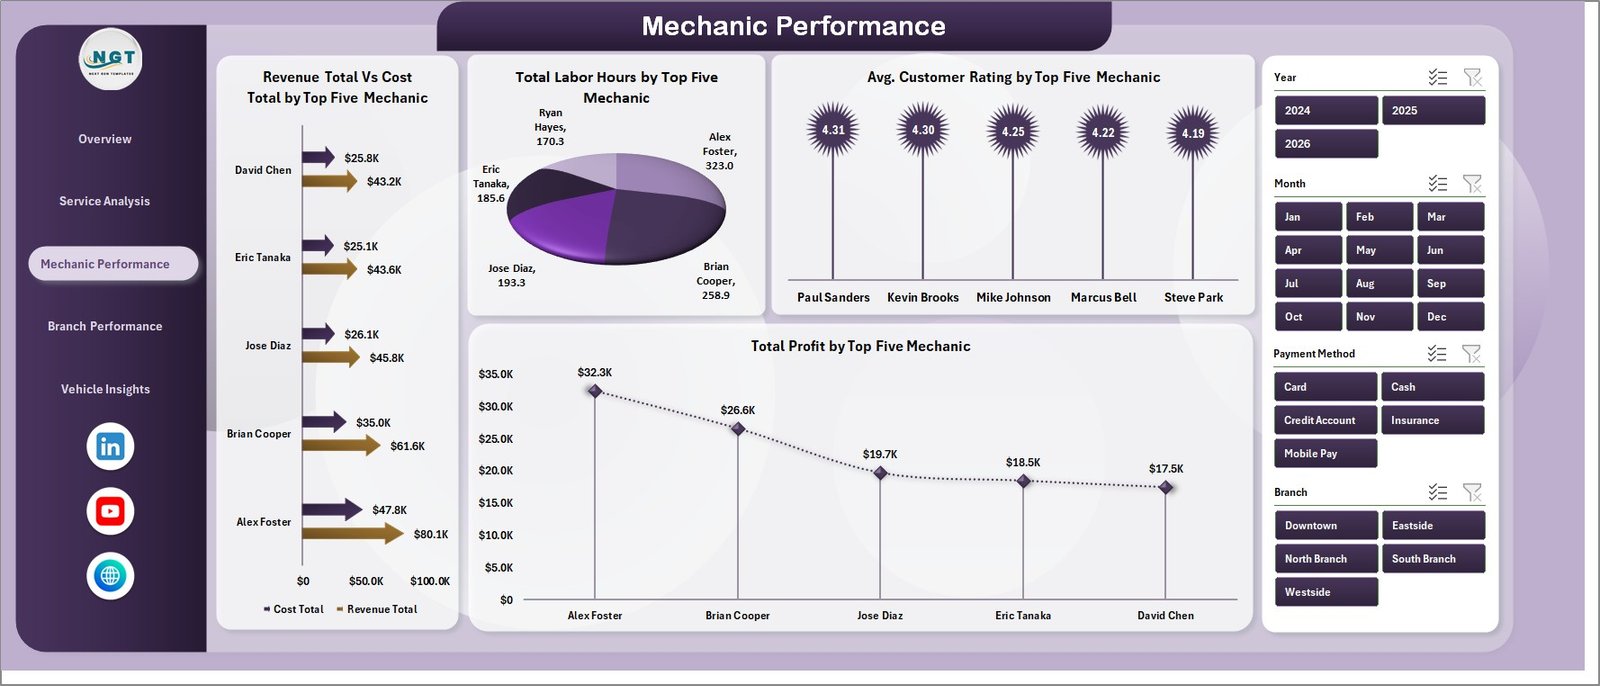 Mechanic Performance
🔹 Branch Performance Page – Revenue vs. Cost by Branch, Total Profit by Branch, Avg. Customer Rating by Branch, and Completion % by Branch. Multi-location operators can spot the strongest and weakest shops at a glance.
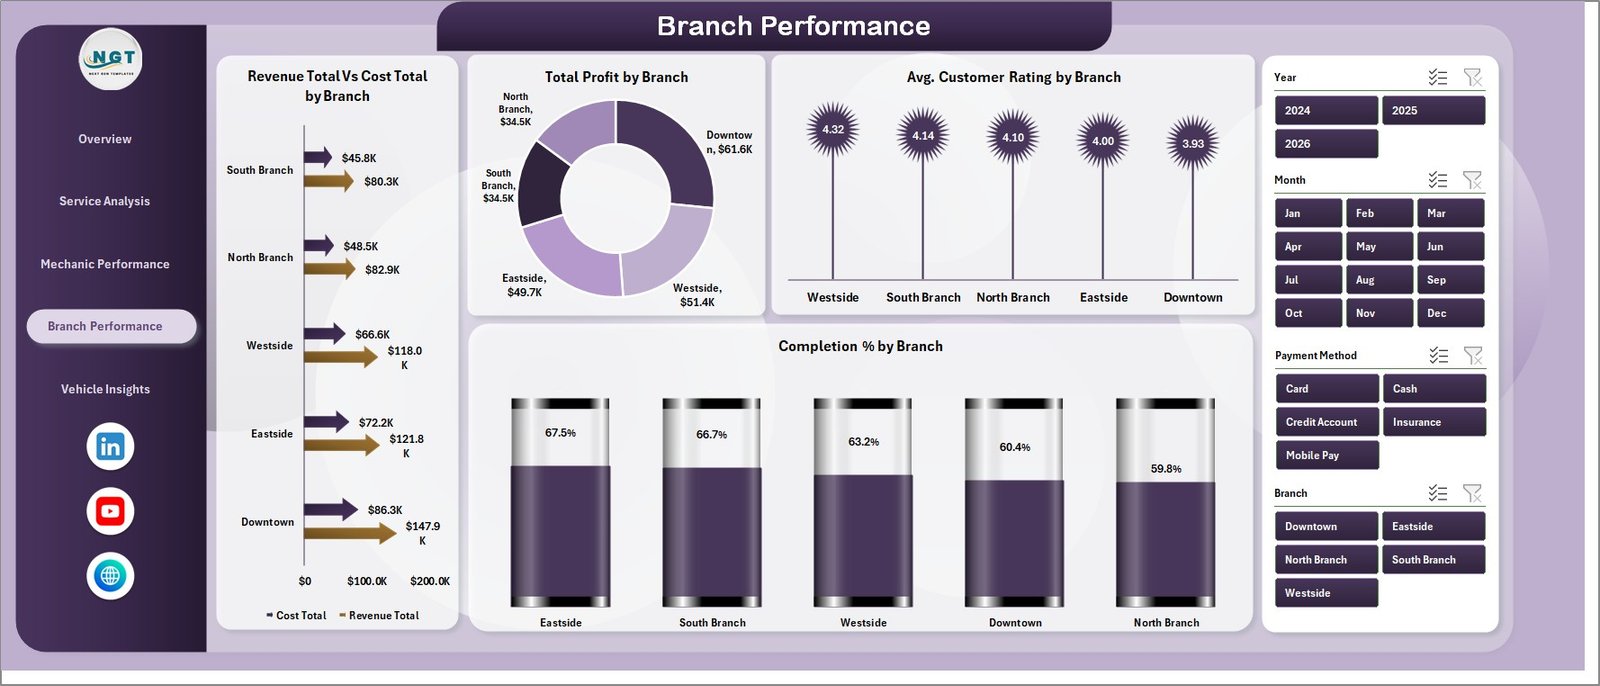 Branch Performance
🔹 Vehicle Insights Page – Revenue by Vehicle Make, Avg. Revenue per Job by Payment Method, Total Jobs by Payment Method, and Avg. Labor Hours per Job by Vehicle Make.
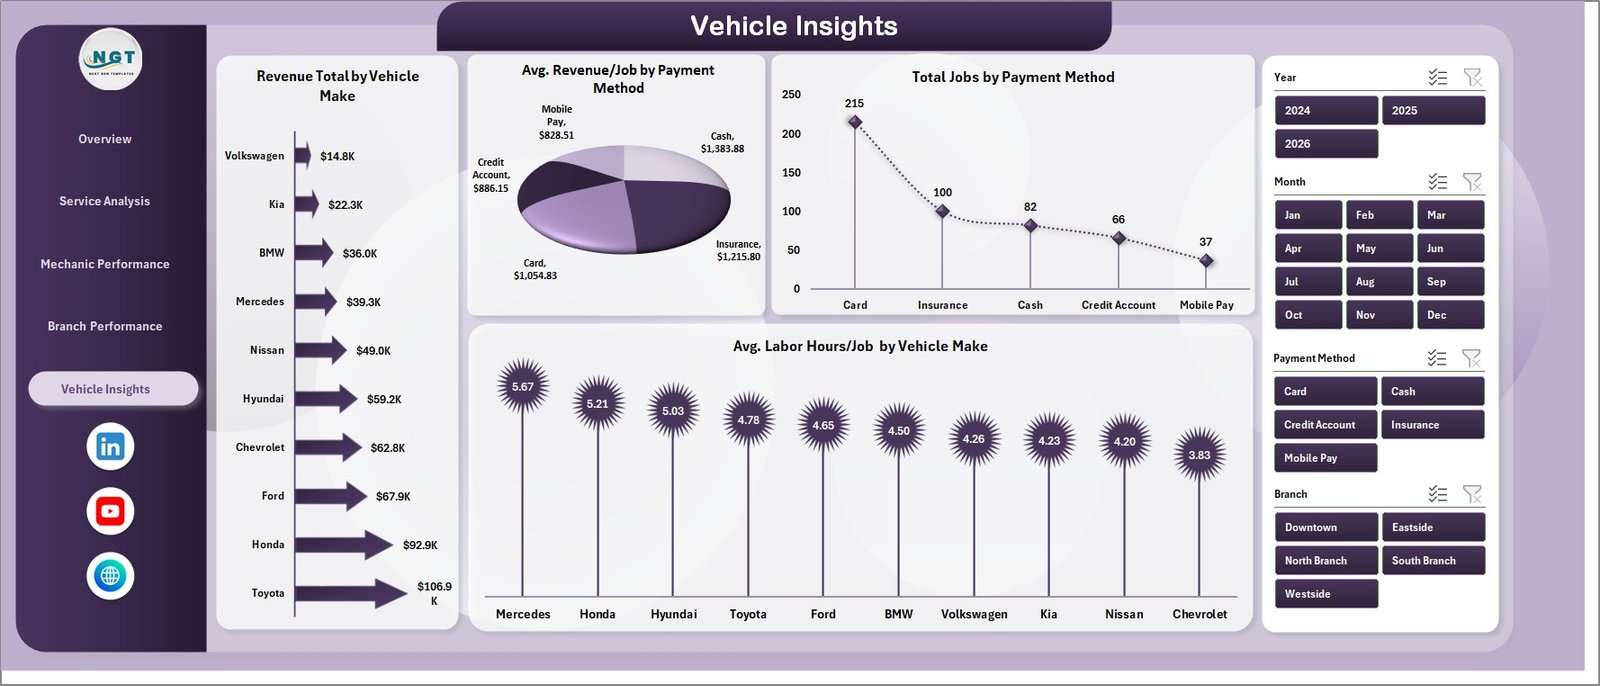 Vehicle Insights
🔹 Data Sheet – The single source of truth. Add new jobs in the same column format and the dashboard pulls them in on the next refresh.
 Data Sheet tab
🔹 Support Sheet – Hidden pivot tables that drive every chart. Click Data → Refresh All after updating the Data sheet and the entire dashboard rebuilds itself. Keep this sheet hidden in production.
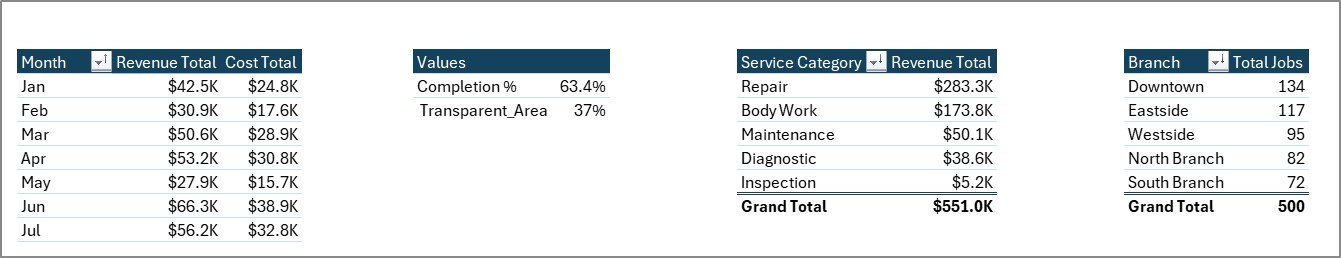 Support sheet tab
📊 Auto Repair Dashboard in Excel vs. Google Sheets Equivalent vs. Paid Shop Management Software — Where This Fits
| Feature | Auto Repair Dashboard in Excel | Google Sheets Equivalent | Shop-Ware / Tekmetric / Mitchell 1 |
|---|---|---|---|
| Cost | $17.99 one-time | $8 – $15 one-time | $129 – $379 / shop / month |
| Platform | Microsoft Excel (.xlsx) | Google Sheets (cloud) | Cloud SaaS |
| Setup time | Under 10 minutes | 10 – 15 minutes | 2 – 6 weeks (onboarding) |
| Works offline | ✅ Yes | ❌ No (needs internet) | ❌ No (needs internet) |
| Per-user fees | ✅ None | ✅ None (within Workspace) | ❌ $30 – $80 per user / mo |
| Customisable charts & columns | ✅ Fully editable | ✅ Fully editable | ⚠️ Limited to vendor templates |
| Mechanic & branch P&L views | ✅ Built-in | ⚠️ DIY | ✅ Built-in (premium tier) |
| Year-1 cost at 5 users | $17.99 total | ~$10 total | $7,740 – $22,740 |
| Lifetime access | ✅ Yes | ✅ Yes | ❌ No (subscription) |
For independent and multi-branch auto repair shops that want clear KPI reporting without paying $150+ per month for shop management software, the Auto Repair Dashboard in Excel sits in the sweet spot.
👥 Who This Template Is For — and Who It’s Not For
✅ This template is built for:
- Independent auto repair shop owners with 1–10 mechanics tracking jobs in spreadsheets or paper logs
- Multi-branch repair chain operators who need branch-vs-branch revenue, cost, and profit comparisons
- Service managers preparing monthly KPI reviews on mechanic productivity, customer ratings, and labor hours
- Franchise owners (oil change, tire centres, brake shops) wanting consistent reporting across locations
- Small-business accountants and bookkeepers building monthly P&L reports for repair shop clients
❌ This template is NOT for:
- Shops needing live VIN decoding, parts ordering, or OEM repair information (use Mitchell 1 / ALLDATA)
- Operations requiring text-message customer approvals or digital vehicle inspections (use Tekmetric / Shop-Ware)
- Teams that want a phone app for technicians on the shop floor — this is a desktop Excel file
- Shops needing real-time multi-user concurrent editing (use the Google Sheets version instead)
⚙️ How to Use the Auto Repair Dashboard in Excel
- Download and unzip the Auto Repair Dashboard in Excel file from your purchase email or account.
- Open the .xlsx file in Microsoft Excel 2016 or later (works on Windows and Mac).
- Go to the Data sheet and replace the sample job records with your own — keep column headers and order intact.
- Click Data → Refresh All on the Excel ribbon. Every chart, KPI card, and pivot rebuilds automatically.
- Use the slicers on each page to filter by branch, month, service category, mechanic, or payment method.
- Hide the Support sheet before sharing with clients or owners — right-click the tab and choose Hide.
💼 Real-World Use Cases
Marcus runs a 3-bay independent shop in Phoenix. He uses the Auto Repair Dashboard in Excel to track which service categories — brakes, transmission, oil changes — actually drive monthly profit. Last quarter he found his $39 oil change promotion was running at a 4% margin, dropped it from the front page, and shifted advertising dollars to brake jobs running at 38% margin. No SaaS bill required.
Linda manages 4 franchise tire centres across Texas. Each Monday her store managers email her last week’s job log. She pastes the four Data sheets together, hits Refresh All, and within five minutes has a Branch Performance page ready for her franchise call — Revenue vs. Cost by branch, Avg. Customer Rating by branch, and Completion % by branch all in one view.
Raj is the bookkeeper for two family-owned auto shops. He uses the dashboard’s Mechanic Performance page during quarterly reviews to recommend bonus payouts based on Revenue, Total Profit, and Avg. Customer Rating per top-five mechanic. The owners pay him for the analysis — the dashboard does the heavy lifting.
❓ Frequently Asked Questions
What KPIs does the Auto Repair Dashboard in Excel track?
The Auto Repair Dashboard in Excel tracks 5 high-level KPIs — Total Jobs, Revenue Total, Total Profit, Avg. Customer Rating, and Total Labor Hours — plus 17 deep-dive charts covering service category, mechanic, branch, vehicle make, and payment method analytics across 5 interactive pages.
How long does setup take?
Setup of the Auto Repair Dashboard in Excel takes under 10 minutes. Open the .xlsx file, paste your job records into the Data sheet using the same column order as the sample, then click Data → Refresh All. Every chart, KPI card, and slicer recalculates automatically — no formulas to edit.
Do I need macros, VBA, or Power Query?
No. The Auto Repair Dashboard in Excel is built on standard Excel pivot tables and pivot charts. There are no macros, no VBA code, no Power Query connections, and no external add-ins required. It works in any installation of Microsoft Excel 2016 or later on Windows or Mac.
How does this compare to Tekmetric or Shop-Ware?
Tekmetric and Shop-Ware are full shop management systems with VIN decoding, parts ordering, and digital inspections — costing $129 to $379 per shop per month. The Auto Repair Dashboard in Excel is a one-time $17.99 reporting layer for shops that already track jobs elsewhere and just want clean KPI reporting and branch comparisons.
Can I track multiple branches in one file?
Yes. The Auto Repair Dashboard in Excel includes a dedicated Branch Performance page that compares Revenue vs. Cost by branch, Total Profit by branch, Avg. Customer Rating by branch, and Completion % by branch. Add a Branch column value for each job in the Data sheet and the page populates automatically.
Is the file editable, and can I add my logo?
Yes. The Auto Repair Dashboard in Excel is fully editable — you can change colors, fonts, KPI card labels, chart types, add your shop logo, and rename pages. Hide the Support sheet before sharing with clients to keep the pivot tables out of view.
Will I get future updates?
Your purchase of the Auto Repair Dashboard in Excel includes lifetime access to the version you download. We also publish free improvements and walkthroughs on the NextGenTemplates YouTube channel — subscribe to be notified when new versions ship.
👤 About the Author
Built by PK — Microsoft Certified Professional with 15+ years of Excel, Google Sheets, and Power BI experience. Founder of Nextgen Templates, reaching 300K+ subscribers across YouTube channels (@PK-AnExcelExpert, @NextGenTemplates, @NeoTechNavigators). Every template is hand-built and tested before release.
🔗 Explore Related Templates
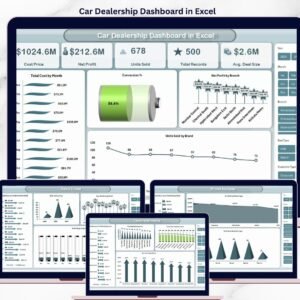
🔹 Car Dealership Dashboard in Excel — sister template for the sales side of automotive (vehicle inventory, leads, deals).
🔹 Automotive Parts Manufacturing Dashboard in Excel — for parts suppliers feeding repair shops.
🔹 Vehicle Reservation Tracker in Excel — pairs well for shops offering loaner cars.
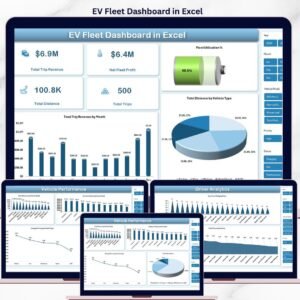
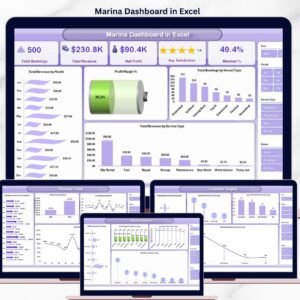
🔹 Marina Dashboard in Excel — same service-business architecture for boat repair operators.
Also available as: Car Dealership Dashboard in Power BI for teams already on Power BI. Browse the full Power BI Dashboard Templates collection too.
📖 Click here to read the Detailed Blog Post
🎥 Visit our YouTube channel for step-by-step video tutorials
👉 YouTube.com/@NextGenTemplates
📅 Last updated: May 2026
Watch the step-by-step video tutorial:
YouTube


Reviews
There are no reviews yet.