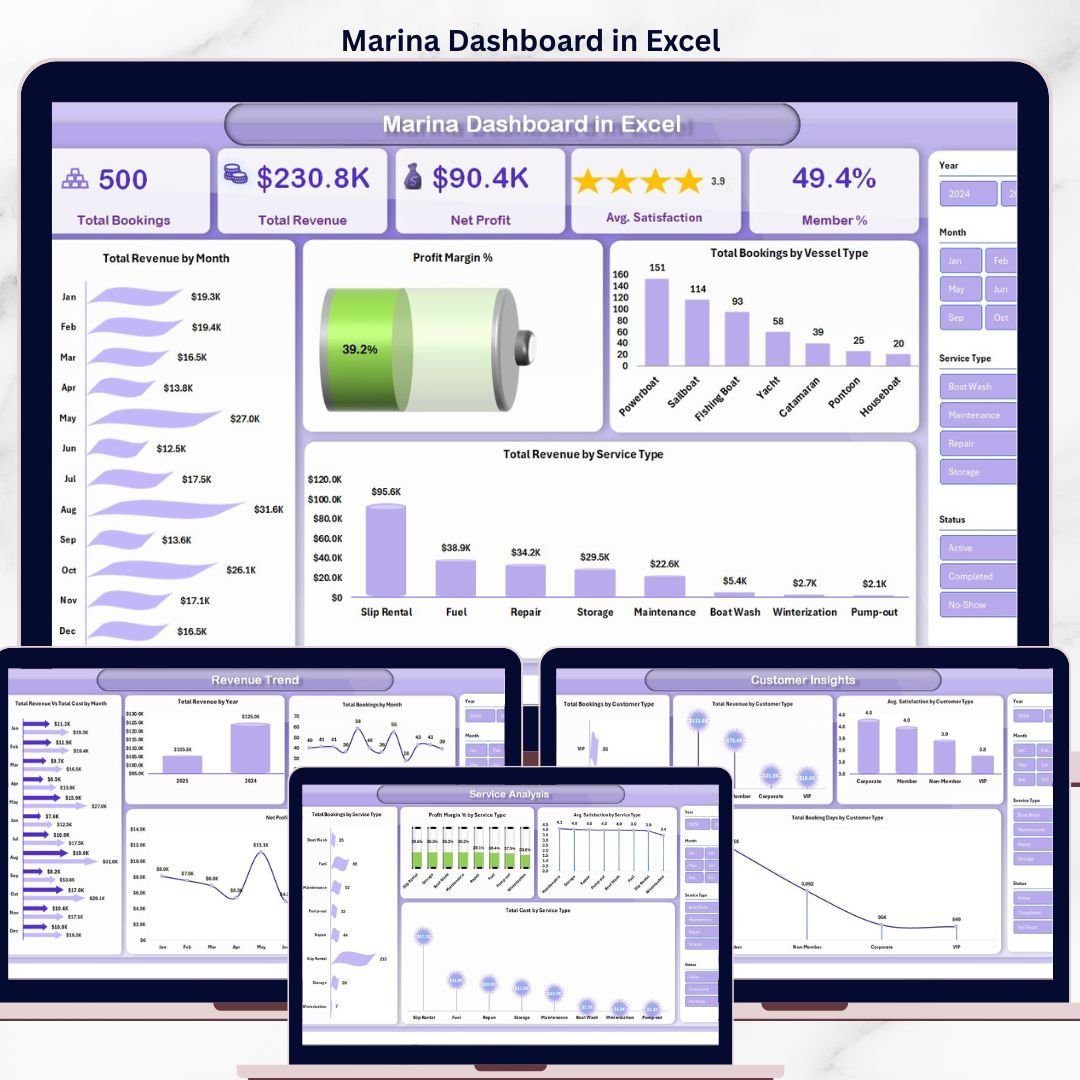
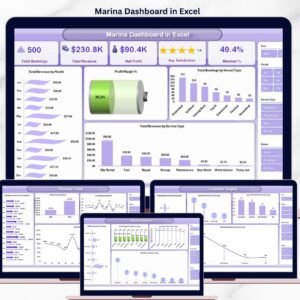
The Marina Dashboard in Excel tracks 5 high-level KPIs across 5 interactive analysis pages, with 19 pre-built charts and slicers for vessel type, service type, customer type, and marina section. Setup takes under 10 minutes — paste your booking data into the Data sheet, hit Refresh All, and every chart updates automatically through native Excel pivot tables.
🌍 Join 8,400+ teams in 40+ countries using NextGenTemplates to replace paid SaaS tools with one-time-purchase Excel, Google Sheets, Power BI, and HTML templates.
✅ Instant download · One-time payment · No subscription · No per-user fees · Lifetime access
Marina Dashboard in Excel
This Excel Marina Management Dashboard is built for harbor masters, marina operators, yacht club managers, and small-boat-yard owners who need a single workbook to track slip occupancy, fuel sales, mooring revenue, repair-service profitability, and member retention — without paying $99 to $499 per month for marina-management SaaS like DockMaster, MarinaOffice, or Molo. Every sheet is unlocked, fully editable, and works on both Windows and Mac without add-ins or macros.
🔑 Key Features of the Marina Dashboard in Excel
📊 5 KPI cards on the Overview page — Total Bookings, Total Revenue, Net Profit, Average Satisfaction Score, and Member Percentage update instantly the moment you change a slicer or refresh the data.
⛵ 4-way slicer filtering — Filter by Vessel Type, Service Type, Customer Type, and Marina Section to drill into yacht-club members, transient day-trippers, dry-storage tenants, or specific dock zones (A-Dock, B-Dock, fuel pier, repair yard).
📈 19 pre-built pivot charts across 5 pages — Revenue by Month, Profit Margin %, Total Cost vs Revenue trends, Service Type profitability, Customer Type satisfaction comparison, and Marina Section performance — all driven by hidden pivot tables on the Support Sheet.
🔄 Refresh-All workflow, no formulas to break — Replace the sample data on the Data sheet with your own bookings export from your POS or marina-management system, click Data → Refresh All in the Excel ribbon, and the entire dashboard rebuilds in seconds.
💼 Designed for marinas of any size — Whether you operate a 50-slip family marina, a 300-slip yacht club, or a multi-section commercial harbor, the template scales without performance issues up to 50,000 booking rows.
🖨️ Print-ready and presentation-friendly — Each page is sized for A4/Letter landscape and exports cleanly to PDF for monthly board reports or owner reviews.
📦 What’s Inside the Marina Dashboard in Excel
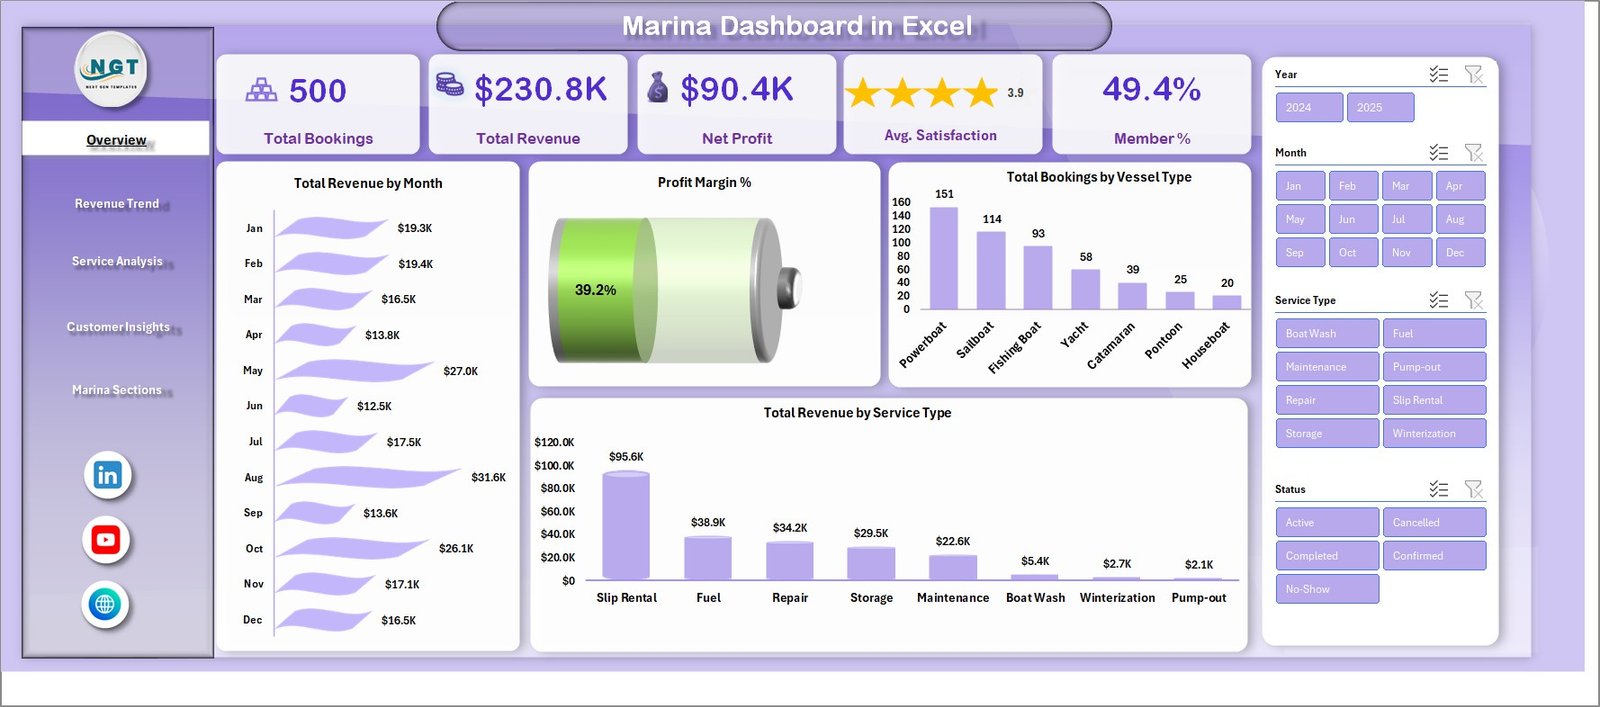
Page 1 — Overview Page
The Overview page presents the marina’s full performance picture in a single screen. Five KPI cards at the top display Total Bookings, Total Revenue, Net Profit, Average Satisfaction, and Member %. Four charts beneath them visualize Total Revenue by Month (the year’s revenue cycle including peak boating season), Profit Margin % (profitability trendline), Total Bookings by Vessel Type (sailboat vs powerboat vs personal watercraft mix), and Total Revenue by Service Type (mooring, fuel, repair, storage breakdown). Slicers above the cards let you filter the entire page by Vessel Type, Service Type, Customer Type, or Marina Section.
Revenue Trend
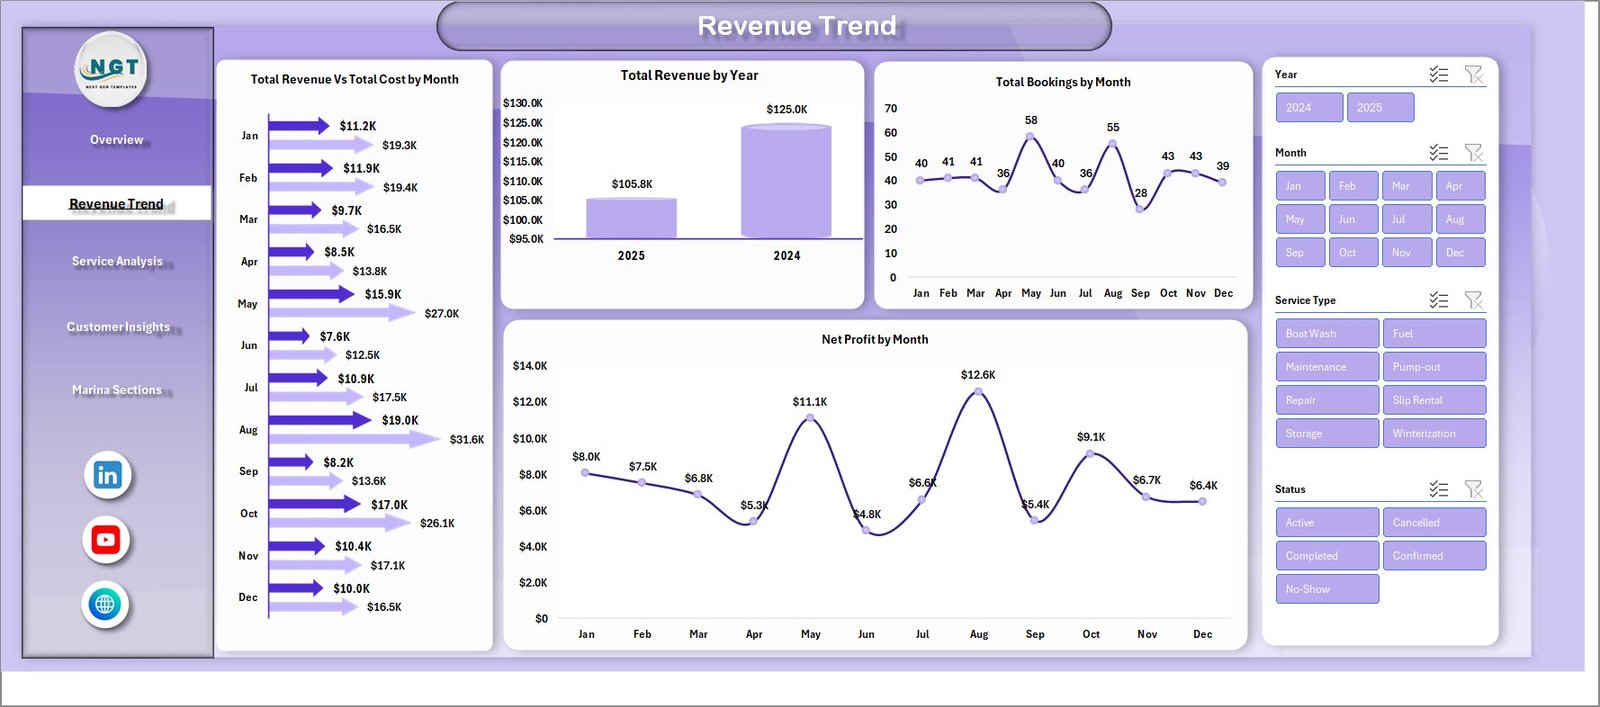
Page 2 — Revenue Trend
The Revenue Trend page focuses on financial momentum across time. It shows Total Revenue vs Total Cost by Month (margin gap visualization), Total Revenue by Year (multi-year growth), Total Bookings by Month (seasonality patterns), and Net Profit by Month (bottom-line monthly health). This page is ideal for board meetings and lender reviews where year-over-year financial trends matter most.
Service Analysis
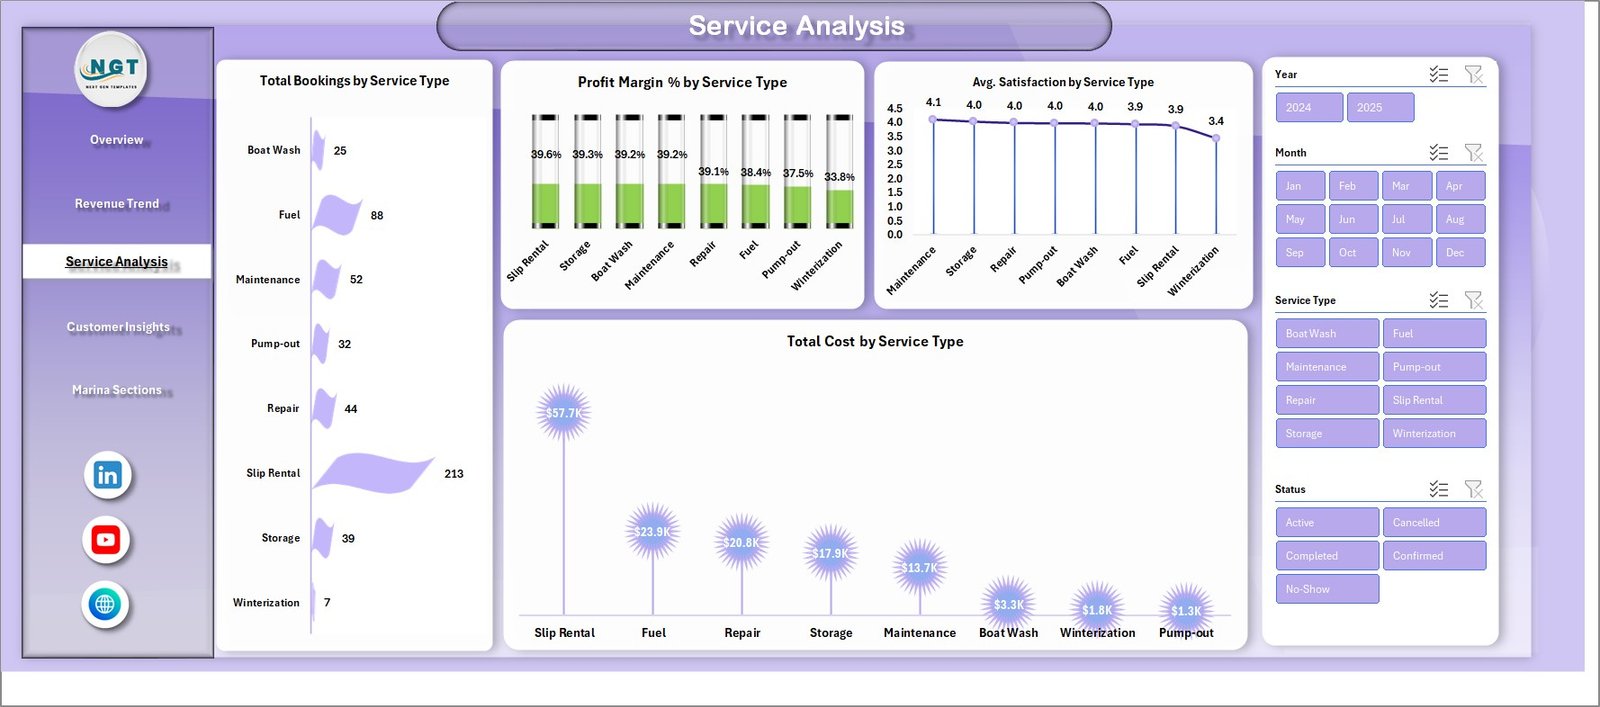
Page 3 — Service Analysis
The Service Analysis page breaks down performance by service line. Charts include Total Bookings by Service Type, Profit Margin % by Service Type, Average Satisfaction by Service Type, and Total Cost by Service Type. Use this page to identify which services (mooring, fuel sales, hull cleaning, winter storage, engine repair) deliver the highest margins and the best customer experience — and which to renegotiate or drop.
Customer Insights
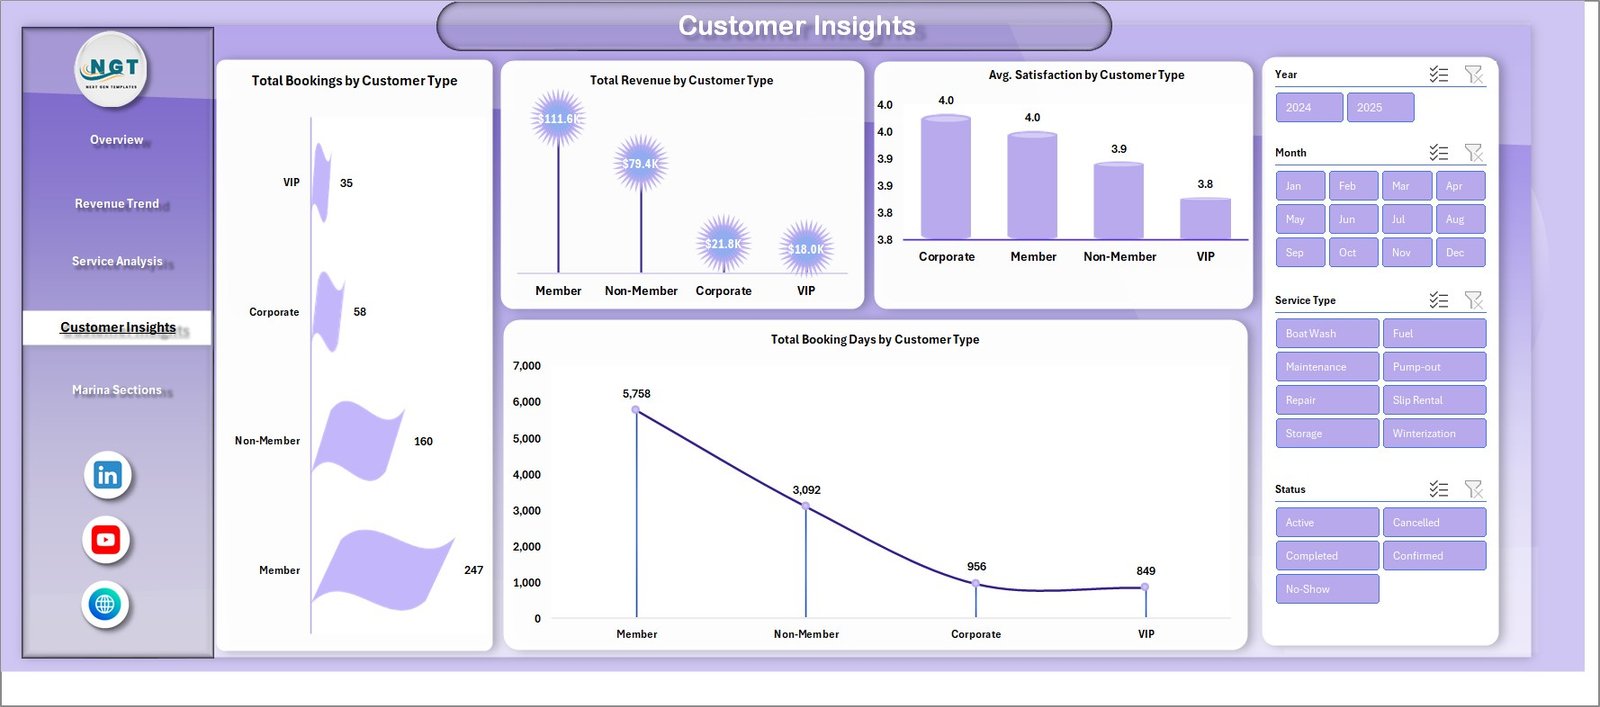
Page 4 — Customer Insights
The Customer Insights page profiles your customer mix. Charts cover Total Bookings by Customer Type, Total Revenue by Customer Type, Average Satisfaction by Customer Type, and Total Booking Days by Customer Type. Compare annual members against transient visitors, charter operators against private owners — and see which segment generates the most lifetime value per booking.
Marina Sections
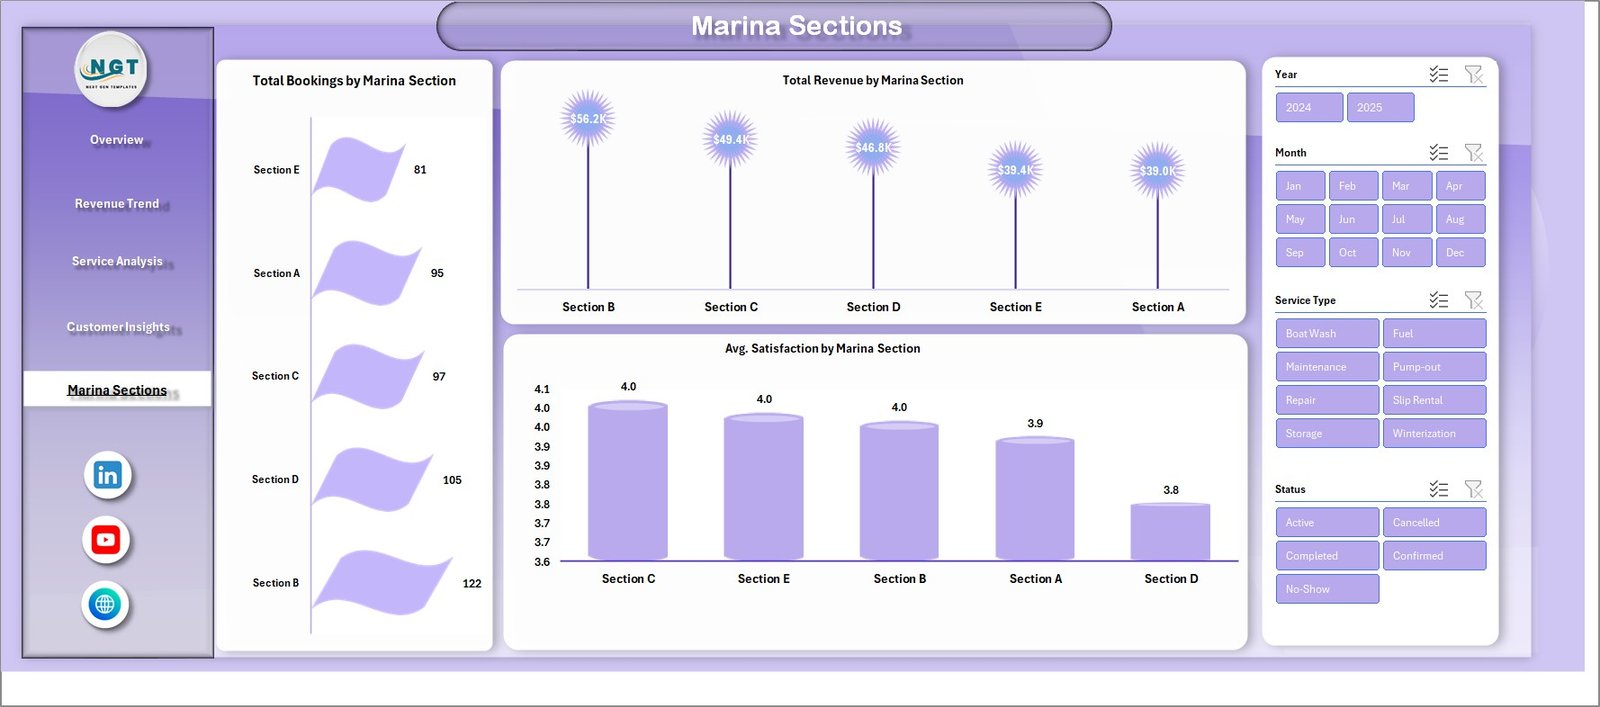
Page 5 — Marina Sections
The Marina Sections page maps performance to physical zones in the harbor. Charts show Total Bookings by Marina Section, Total Revenue by Marina Section, and Average Satisfaction by Marina Section. Spot which docks are running at capacity, which are underutilized, and where customer satisfaction is slipping — useful for renovation budgeting and slip-rate adjustments.
Data Sheet tab
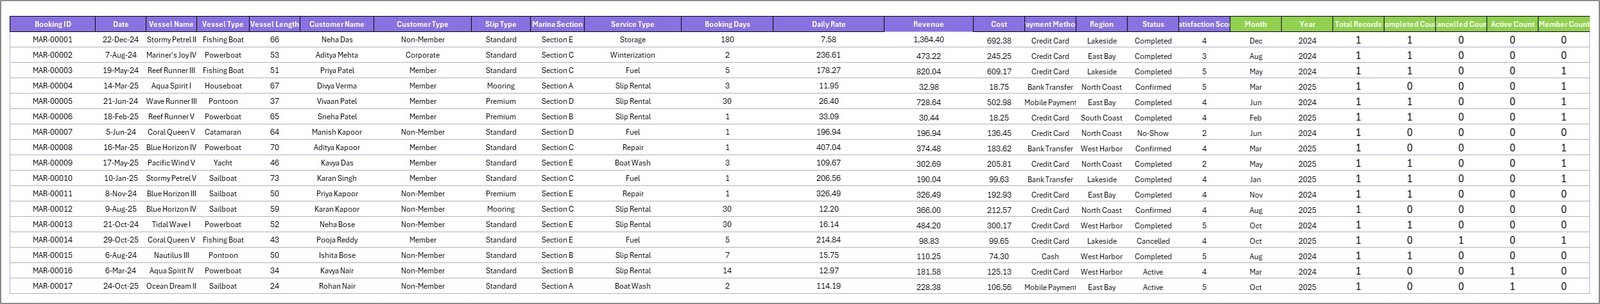
Data Sheet Tab
This is the Data sheet — the only tab you need to edit. Add or paste your booking records in the same column format (Date, Customer, Vessel Type, Service Type, Marina Section, Booking Days, Revenue, Cost, Satisfaction Score, Membership Flag). All charts and KPIs reference this sheet through pivot tables.
Support sheet tab
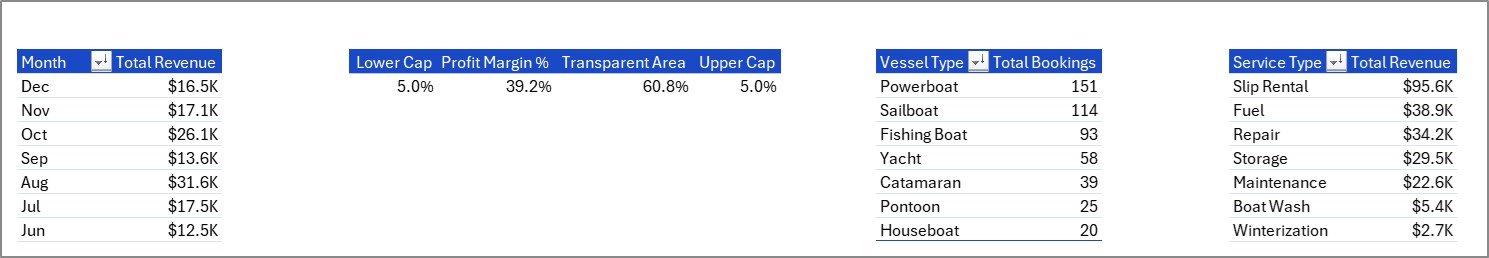
Support Sheet
The Support sheet contains all the pivot tables that drive the dashboard charts dynamically. After updating data on the Data sheet, go to the Data tab in the Excel Ribbon and click Refresh All — every pivot and every chart refreshes automatically. You can keep this sheet hidden in production use.
📊 Marina Dashboard in Excel vs. Google Sheets vs. DockMaster / Molo SaaS — Where This Fits
| Feature | Marina Dashboard in Excel | Google Sheets equivalent | DockMaster / Molo / MarinaOffice SaaS |
|---|---|---|---|
| Cost | $17.99 one-time | $0 (DIY, no template) | $99 – $499 / month + setup |
| Platform | Microsoft Excel (Win + Mac) | Google Sheets (browser) | Cloud SaaS (browser + mobile app) |
| Setup time | Under 10 minutes | 2-4 hours to recreate manually | 1-4 weeks onboarding |
| Slicer filtering (Vessel, Service, Customer, Section) | ✅ Native Excel slicers | Filter Views only | ✅ Built-in filters |
| Works offline | ✅ Yes | ❌ Internet required | ❌ Cloud-only |
| Customizable charts and KPIs | ✅ Fully editable | ✅ Editable | ❌ Vendor-controlled |
| Year-1 cost at 5 users | $17.99 total | $0 | $1,188 – $5,988 |
| Lifetime ownership | ✅ Yes | ✅ Yes | ❌ Subscription only |
| POS / payment integration | ❌ Manual data import | ❌ Manual | ✅ Built-in |
For marina operators who want fast, customizable financial visibility without paying $1,200+/year for a SaaS subscription, the Marina Dashboard in Excel sits in the sweet spot.
👥 Who This Template Is For — and Who It’s Not For
✅ This template is built for:
- Independent marina owners and harbor masters managing 30 – 500 slips
- Yacht club managers preparing monthly board reports and member updates
- Boat-yard operators tracking repair-service profitability against mooring income
- Marina franchise regional managers comparing performance across 2 – 10 sites
- Small-business consultants delivering financial reviews to marina clients
❌ This template is NOT for:
- Large commercial ports needing real-time AIS vessel tracking and customs integration
- Marinas requiring built-in credit-card processing or payment-gateway integration
- Operators wanting mobile-first dock-staff apps (use a SaaS like Molo or DockMaster)
- Teams needing automated reservations and dock-cam streaming inside one tool
⚙️ How to Use the Marina Dashboard in Excel
- Download and unzip the Marina Dashboard in Excel file from your purchase confirmation email.
- Open in Microsoft Excel on Windows or Mac (works in Excel 2016+, 365, and Excel for the web with minor chart fidelity loss).
- Go to the Data sheet and replace the sample bookings with your own export from your booking system or POS, keeping the same column structure.
- Click Data → Refresh All in the Excel ribbon to rebuild every pivot table and chart with your live data.
- Use the slicers on the Overview page to filter by Vessel Type, Service Type, Customer Type, or Marina Section to instantly see segmented performance.
- Export to PDF via File → Export for monthly owner or board reports.
💼 Real-World Use Cases
Marcus owns a 120-slip marina on the Chesapeake Bay. Each month he pastes his Square POS export and dock-software booking log into the Data sheet, refreshes, and exports the Overview and Revenue Trend pages to PDF for his lender review. He used to pay $249/month for a marina-management dashboard he barely used — now he spends $17.99 once and 5 minutes a month.
Helena runs operations for a 4-location yacht-club group in Florida. She duplicates the Marina Dashboard for each location, then maintains a master rollup workbook that links to all four. The Marina Sections page helps her board decide which site needs the next dock-renovation budget by showing slip-level revenue and satisfaction side-by-side.
Diego is a fractional CFO consulting for three small marinas. He uses the Customer Insights page to coach owners on shifting their mix toward annual members (higher LTV, lower acquisition cost) versus transient day visitors. The template paid for itself the first time he used it in a client engagement.
❓ Frequently Asked Questions
What KPIs does the Marina Dashboard in Excel track?
The Marina Dashboard in Excel tracks 5 headline KPIs — Total Bookings, Total Revenue, Net Profit, Average Satisfaction Score, and Member Percentage — plus 19 supporting charts across Revenue Trend, Service Analysis, Customer Insights, and Marina Sections pages. All KPIs update automatically when you replace the sample data with your own.
How does the Marina Dashboard in Excel compare to DockMaster or Molo?
DockMaster and Molo are full marina-management SaaS platforms costing $99 – $499 per month with built-in reservations and payments. The Marina Dashboard in Excel is a $17.99 one-time analytics layer — ideal for operators who already handle bookings elsewhere and just need a customizable performance dashboard without a subscription.
How long does setup take?
Setup takes under 10 minutes for most marinas. Open the file, paste your booking export into the Data sheet matching the column structure, click Data → Refresh All, and the dashboard is live. No formulas to write, no macros to enable, no add-ins to install.
Will the Marina Dashboard in Excel work on Mac?
Yes — the Marina Dashboard in Excel works on both Windows and Mac in Excel 2016, Excel 2019, Excel 2021, and Microsoft 365. Slicers, pivot tables, and pivot charts all function natively. Excel for the web supports it with minor chart styling differences.
Can I add my own KPIs and charts?
Yes, the Marina Dashboard in Excel is fully unlocked and editable. You can add new KPI cards, modify the slicer fields, create additional pivot charts on the Support sheet, or restyle colors to match your brand. Any new fields you add to the Data sheet automatically become available in the pivot tables.
Does the template include sample marina data?
Yes, the Marina Dashboard in Excel ships with sample data covering bookings, vessel types, service types, customer segments, marina sections, and 12 months of revenue — so you can see the dashboard fully populated before plugging in your own data.
Is the Marina Dashboard in Excel a one-time purchase?
Yes — $17.99 one-time, no subscription, no per-user fees, no recurring charges. You receive instant download access, lifetime use rights, and free updates to the same template version.
👤 About the Author
Built by PK — Microsoft Certified Professional with 15+ years of Excel, Google Sheets, and Power BI experience. Founder of NextGenTemplates, reaching 300K+ subscribers across YouTube channels (@PK-AnExcelExpert, @NextGenTemplates, @NeoTechNavigators). Every template is hand-built and tested before release.
🔗 Explore Related Templates
If the Marina Dashboard in Excel fits your workflow, you may also like these hospitality-adjacent templates from our Excel Dashboard Templates library:
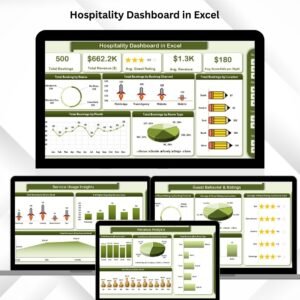
- Hotel and Hospitality Revenue Dashboard in Excel — broader hotel and resort KPI coverage at the same price point.
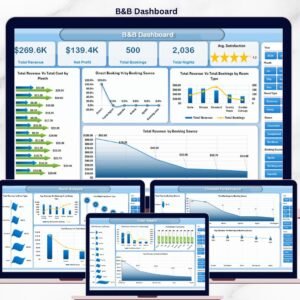
- B&B Dashboard in Excel — purpose-built for bed-and-breakfast operators with similar booking-and-revenue logic.
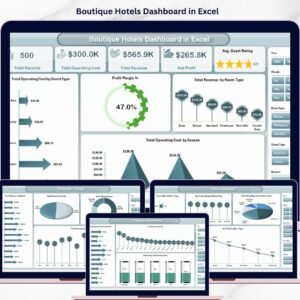
- Boutique Hotels Dashboard in Excel — small-property hospitality analytics with occupancy and ADR tracking.
- Also available as: Need the same data in another platform? Browse our Power BI Dashboards and Google Sheets Dashboards.
📖 Click here to read the Detailed Blog Post
🎥 Visit our YouTube channel for step-by-step video tutorials
👉 YouTube.com/@NextGenTemplates
Watch the step-by-step video tutorial:
YouTube


Reviews
There are no reviews yet.