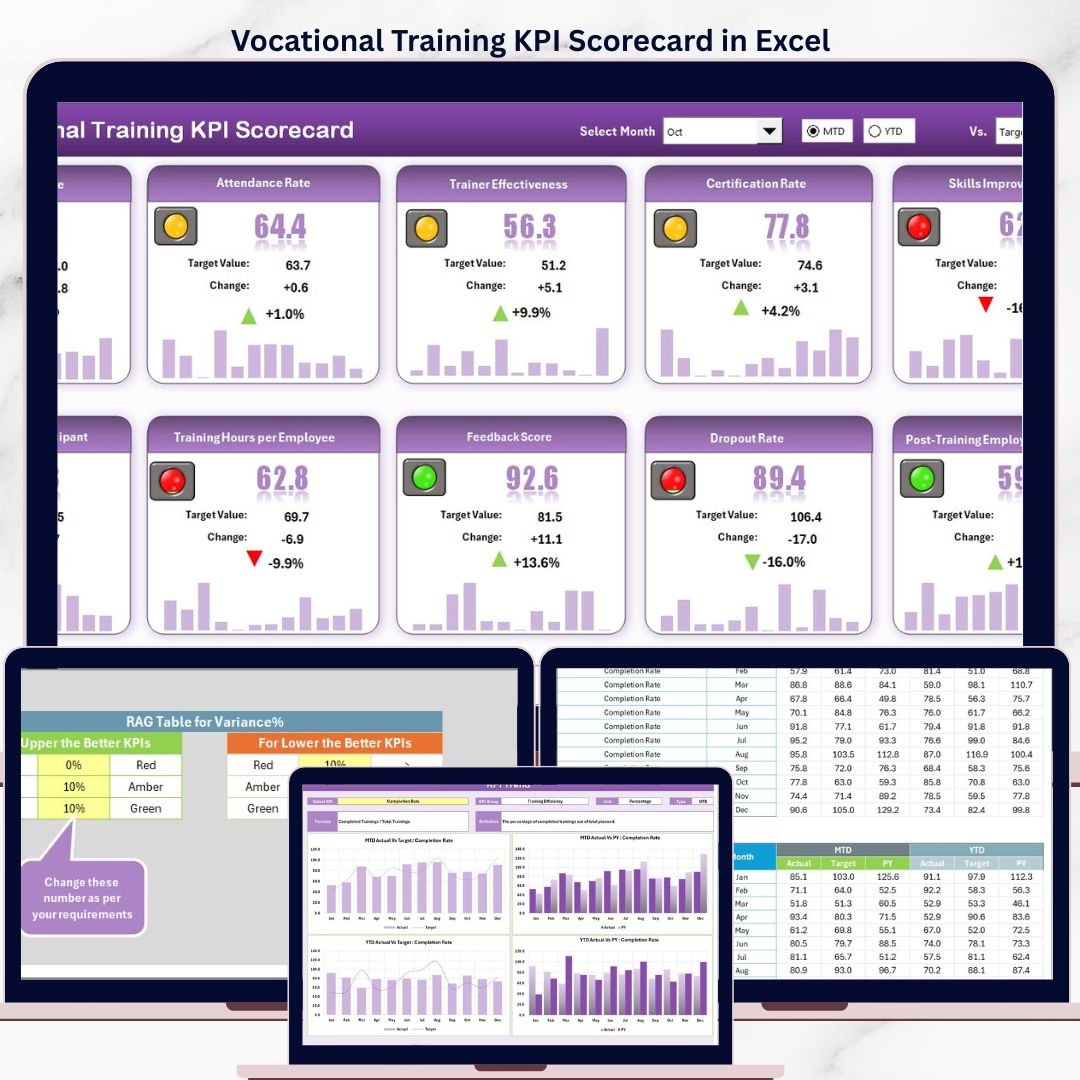


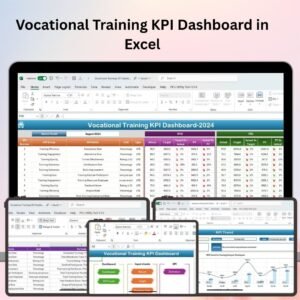
The Vocational Training KPI Scorecard in Excel tracks training performance across 4 structured worksheets, with MTD and YTD trend charts comparing Actual, Target, and Prior Year (PY) data. Setup takes under 10 minutes — enter your KPI definitions and monthly actuals, and every scorecard view updates automatically.
🌍 Join 8,400+ teams in 40+ countries using NextGenTemplates to replace costly SaaS tools with one-time-purchase Excel Dashboard Templates.
✅ Instant download · One-time payment · No subscription · No per-user fees · Lifetime access
🔑 Key Features of Vocational Training KPI Scorecard in Excel
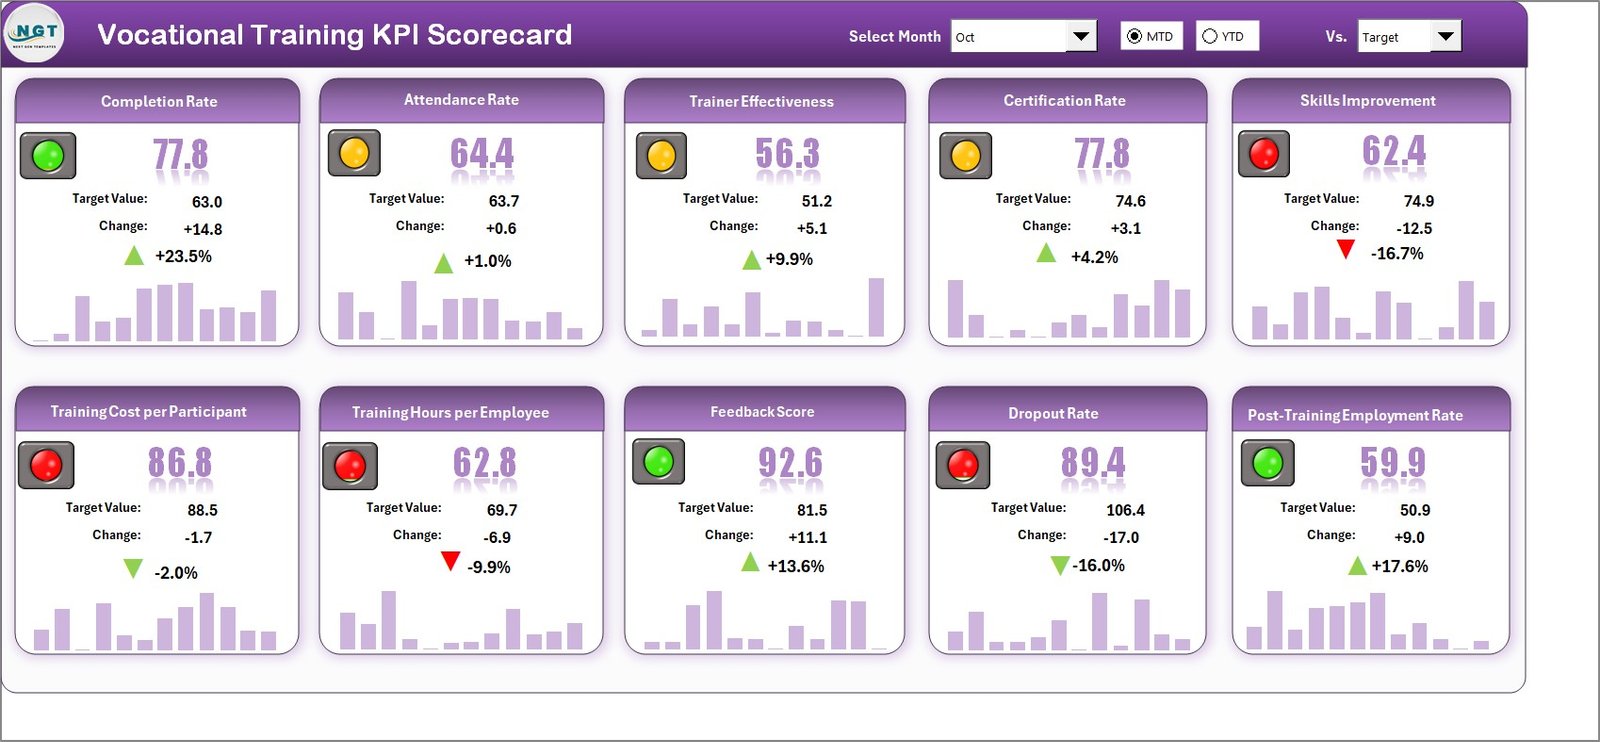
🔹 Scorecard Sheet with Dropdown Filters — Select Month, MTD, or YTD from dropdown menus to view KPI performance at any time horizon. This Vocational Training KPI Scorecard in Excel displays Actual vs. Target comparisons that update instantly across all rows.
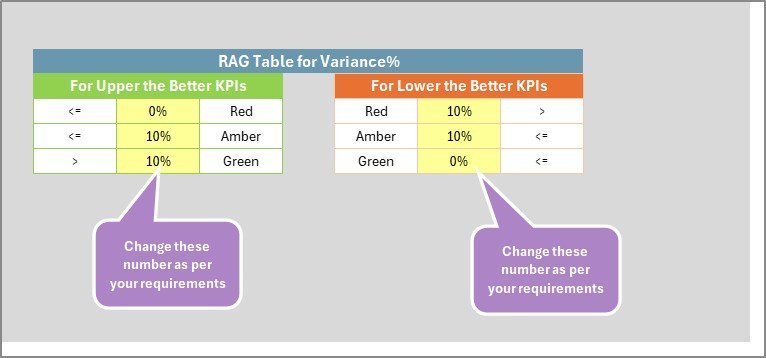
🔹 Color-Coded Visual Indicators — Every KPI row uses conditional formatting to show performance status at a glance: green for on-target, amber for near-miss, and red for below-target metrics — no manual analysis needed.
🔹 KPI Trend Sheet with Dual Charts — Select any KPI from the C3 dropdown to view its Group, Unit, Type (Lower the Better or Upper the Better), Formula, and Definition — plus MTD and YTD trend charts showing Actual, Target, and Prior Year lines.
🔹 Structured Input Data Sheet — One central place to enter all KPI values: actuals, targets, and other metrics. Add new periods without restructuring — every scorecard view refreshes automatically as you enter data.
🔹 KPI Definition Sheet — Define KPI Name, Group, Unit, Formula, and Definition for each metric. This structured library ensures every team member uses KPIs consistently and drives all dropdown lists throughout the template.
🔹 MTD and YTD Comparisons — Displays Month-to-Date and Year-to-Date figures side-by-side, enabling quick identification of cumulative under-performance before it becomes a structural issue.
🔹 Built for Education & Workforce Training — Specifically designed for vocational institutions, TVET centers, apprenticeship programs, trade schools, and corporate L&D departments tracking program outcomes.
📦 What’s Inside the Vocational Training KPI Scorecard in Excel
Vocational Training KPI Scorecard in Excel
The template contains 4 worksheets:
🔹 Sheet 1: Scorecard Sheet — The main interface showing all KPIs with Actual vs. Target values, color-coded status indicators, and dropdown filters for Month, MTD, and YTD analysis.
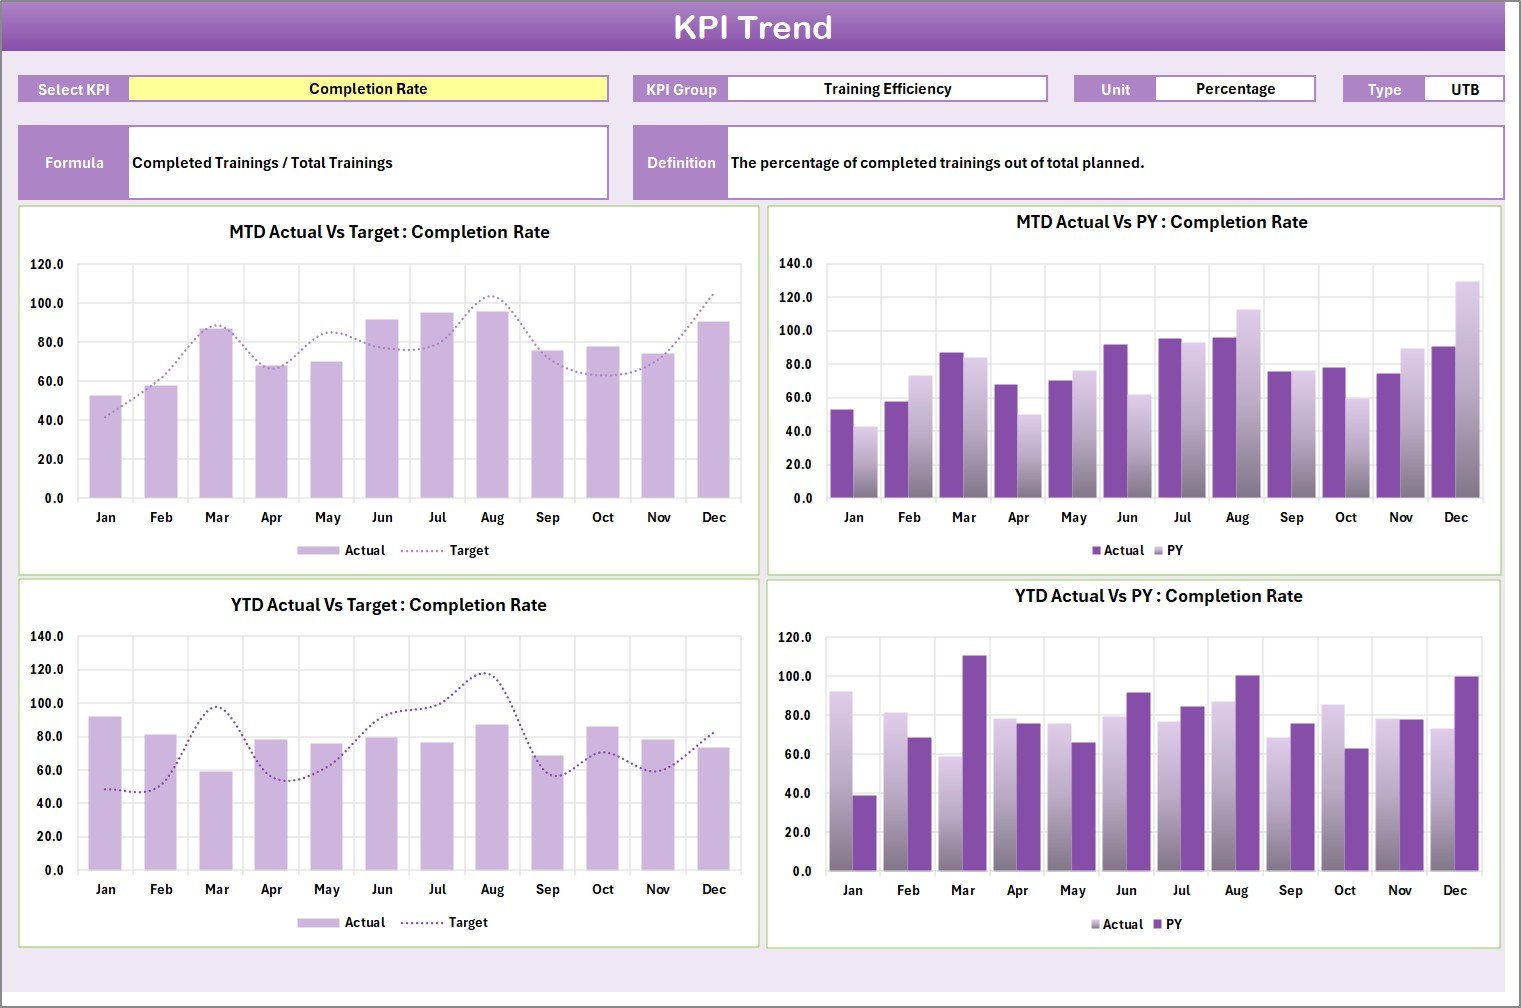
KPI Trend Sheet
🔹 Sheet 2: KPI Trend Sheet — Select any KPI from the C3 dropdown to instantly view its group, unit, type, formula, and definition. MTD and YTD trend charts display Actual, Target, and Prior Year lines.

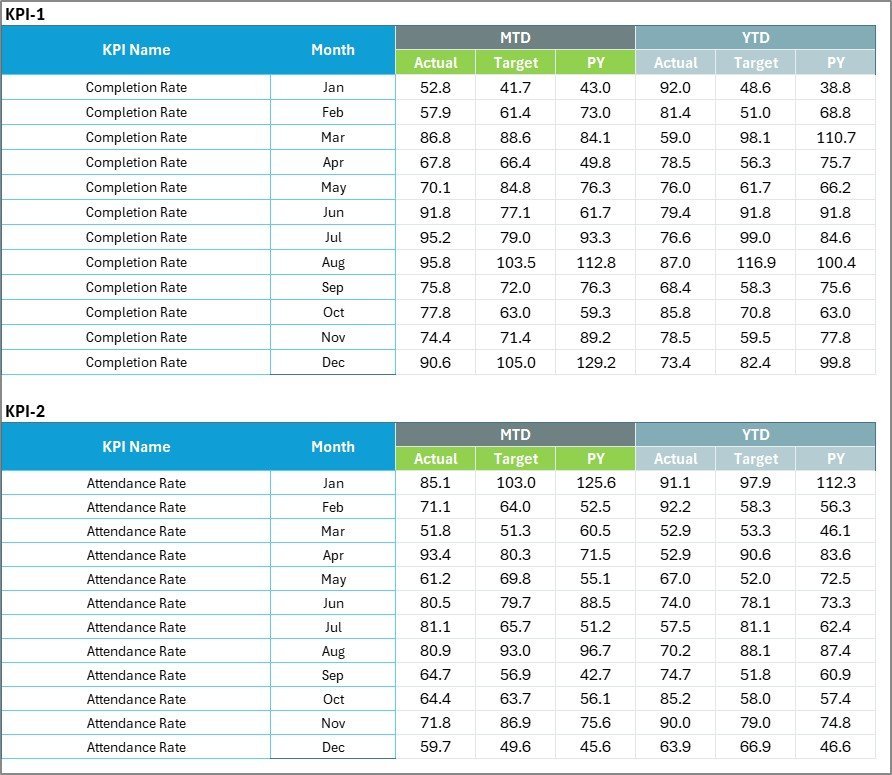
Input Data Sheet
🔹 Sheet 3: Input Data Sheet — Enter actual values, targets, and other metrics for each KPI. Update monthly to keep the scorecard current.
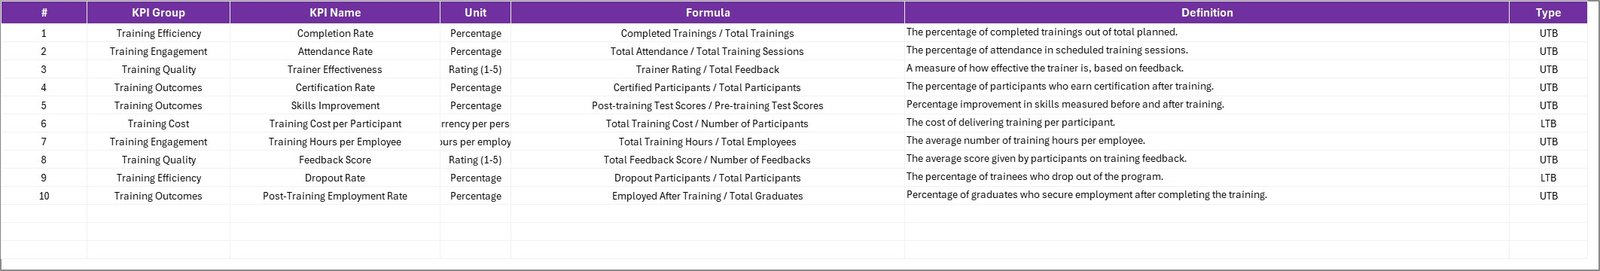
KPI Definition Sheet
🔹 Sheet 4: KPI Definition Sheet — Maintain a structured KPI library by entering KPI Name, Group, Unit, Formula, and Definition. This sheet drives all dropdown lists and trend chart labels throughout the template.
📊 Vocational Training KPI Scorecard in Excel vs. Google Sheets KPI Template vs. Paid LMS Platform — Where This Fits
| Feature | Vocational Training KPI Scorecard in Excel | Google Sheets KPI Template | Paid LMS/Training SaaS (TalentLMS / Absorb) |
|---|---|---|---|
| Cost | $12.99 one-time ✅ | Free–$15 one-time | $3–12 / user / month |
| Platform | Microsoft Excel ✅ | Google Sheets (browser) | Cloud SaaS (browser) |
| Setup time | Under 10 minutes ✅ | 10–20 minutes | 2–8 hours |
| MTD / YTD tracking | Built-in ✅ | Manual formulas required | Varies by plan |
| KPI Trend Charts (Actual + Target + PY) | Yes ✅ | Basic charts only | Reporting dashboards (extra cost) |
| Color-coded status indicators | Conditional formatting ✅ | Available with setup | Traffic lights on premium plans |
| KPI Definition library | Built-in sheet ✅ | Manual | Tied to LMS data fields |
| Works offline | Yes ✅ | No | No |
| Year-1 cost at 10 users | $12.99 total ✅ | ~$0–15 | $360–1,440 |
For vocational training centers that need KPI visibility without a SaaS subscription, the Vocational Training KPI Scorecard in Excel sits in the sweet spot.
👥 Who This Template Is For — and Who It’s Not For
✅ This template is built for:
- Vocational school administrators and TVET center managers tracking program KPIs
- Corporate L&D managers monitoring training completion rates, pass rates, and ROI
- Apprenticeship program coordinators comparing cohort performance across periods
- Trade school directors presenting KPI trends to boards and funding bodies
- HR training departments in manufacturing, healthcare, and logistics sectors
❌ This template is NOT for:
- Organizations needing real-time LMS integration or automatic data feeds
- Teams without Microsoft Excel access (consider the Small Business KPI Scorecard in Google Sheets instead)
- Enterprises requiring multi-site consolidated reporting with role-based access controls
⚙️ How to Use the Vocational Training KPI Scorecard in Excel
- Open the KPI Definition sheet and enter your KPI names, groups, units, formulas, and definitions.
- Go to the Input Data sheet and enter actual values and targets for each KPI across each month.
- Open the Scorecard sheet and use the dropdown menus to select Month, MTD, or YTD.
- Check color-coded indicators to identify which KPIs are on target, near miss, or below target.
- Switch to the KPI Trend sheet and select any KPI from the C3 dropdown to view MTD and YTD trend charts.
💼 Real-World Use Cases
Maria manages operations at a TVET center with 12 trade programs. Every month she uses the Vocational Training KPI Scorecard in Excel to track enrollment rates, course completion, trainer utilization, and graduate employment outcomes — then presents the color-coded scorecard to her board in 15 minutes, without pulling data from three different systems.
James leads L&D at a 500-person logistics company. His team tracks pass rates, training hours per employee, and cost per trainee MTD vs. YTD — catching budget overruns early before they escalate to leadership.
Priya coordinates an apprenticeship program for a regional manufacturing cluster. She uses the KPI Trend sheet to compare cohort pass rates against prior year targets, identifying which trade programs need intervention before the mid-year review.
❓ Frequently Asked Questions
What KPIs does the Vocational Training KPI Scorecard in Excel track?
The Vocational Training KPI Scorecard in Excel tracks any KPIs you define in the KPI Definition sheet — typical vocational metrics include course completion rate, student pass rate, trainer utilization, cost per trainee, and graduate employment rate. Fully customizable to your program metrics.
How long does setup take?
Setup takes under 10 minutes. Enter KPI names in the KPI Definition sheet, add monthly data to the Input Data sheet, and every Scorecard and Trend view updates automatically — no formula editing required.
Does this work on all Excel versions?
Yes. Works on Excel 2016 and later including Microsoft 365. No VBA macros, Power Query, or add-ins required — just standard Excel formulas and conditional formatting.
How does this compare to TalentLMS or Absorb LMS?
TalentLMS and Absorb LMS start at $3–12 per user per month. This scorecard is a $12.99 one-time purchase for KPI tracking and reporting only — it works as a standalone reporting layer alongside any LMS you already use.
Can I add my own KPIs?
Yes. The KPI Definition sheet is fully editable. Add, remove, or rename KPIs at any time, and the Scorecard and KPI Trend sheets reflect your changes automatically.
Does it include sample data?
Yes. The template ships with pre-populated sample data so you can see the scorecard in action immediately. Replace the sample values with your own and every view updates automatically.
Can I share this with my team?
Yes. Share via email, SharePoint, OneDrive, or any file-sharing service. Multiple team members can update the Input Data sheet and the scorecard refreshes for everyone.
👤 About the Author
Built by PK — Microsoft Certified Professional with 15+ years of Excel, Google Sheets, and Power BI experience. Founder of NextGenTemplates, reaching 300K+ subscribers across YouTube channels (@PK-AnExcelExpert, @NextGenTemplates, @NeoTechNavigators). Every template is hand-built and tested before release.
🔗 Explore Related Templates
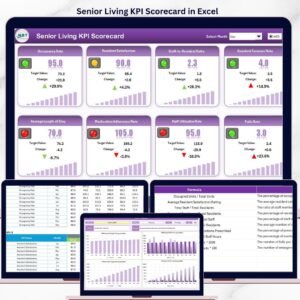
- Senior Living KPI Scorecard in Excel — Same 4-sheet scorecard framework for healthcare KPIs
- Small Business KPI Scorecard in Google Sheets — Same MTD/YTD scorecard in Google Sheets
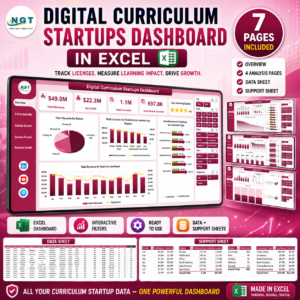
- Virtual Classrooms KPI Dashboard in Excel — Full multi-page dashboard for online education KPIs
- Browse all KPI Dashboard Templates
📖 Click here to read the Detailed Blog Post
🎥 Visit our YouTube channel for step-by-step video tutorials
👉 YouTube.com/@NextGenTemplates
📅 Last updated: May 2026


Reviews
There are no reviews yet.