

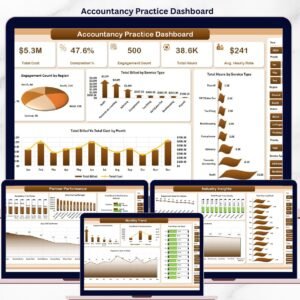
The Accountancy Practice Dashboard in Excel tracks 20 performance metrics across 5 interactive dashboard pages — Overview, Service Analysis, Partner Performance, Industry Insights, and Monthly Trend — with 20 pre-built pivot charts and multi-slicer filtering. Setup takes under 10 minutes: replace the sample data and every KPI card and chart refreshes automatically via Excel’s native Refresh All.
🌍 Join 8,400+ teams in 40+ countries using NextGenTemplates to replace paid SaaS tools with one-time-purchase Excel, Google Sheets, Power BI, and HTML templates.
✅ Instant download · One-time payment · No subscription · No per-user fees · Lifetime access
🔑 Key Features of Accountancy Practice Dashboard in Excel
🔹 5 Interactive Dashboard Pages – Overview, Service Analysis, Partner Performance, Industry Insights, and Monthly Trend, each powered by pivot tables for dynamic filtering and automatic refresh.
🔹 5 High-Level KPI Cards – The Overview page surfaces Total Cost, Completion %, Engagement Count, Total Hours, and Avg. Hourly Rate at a glance — your practice’s vital signs in one screen.
🔹 20 Pre-Built Pivot Charts – From billing vs cost by month to CSAT by partner and profit margin by industry, every critical metric is visualised without manual chart setup.
🔹 Multi-Slicer Filtering – Apply slicers by region, service type, partner, industry, and month to slice your data instantly — no formula editing required.
🔹 One-Click Data Refresh – Enter data in the Data sheet, go to Excel Ribbon → Data → Refresh All, and every pivot table and chart on all 5 pages updates in seconds.
🔹 No Macros or VBA Required – Built entirely on native Excel pivot tables and slicers. Compatible with Excel 2016, 2019, 2021, and Microsoft 365.
🔹 Data & Support Sheets Included – A structured Data sheet for engagement records and a pivot-driven Support sheet that can be hidden once deployed.
📦 What’s Inside the Accountancy Practice Dashboard in Excel
The template includes 7 structured sheet tabs covering five analytical views, a data entry sheet, and a pivot support sheet. This Excel Dashboard Template uses only native Excel features — no external add-ins or macros needed.
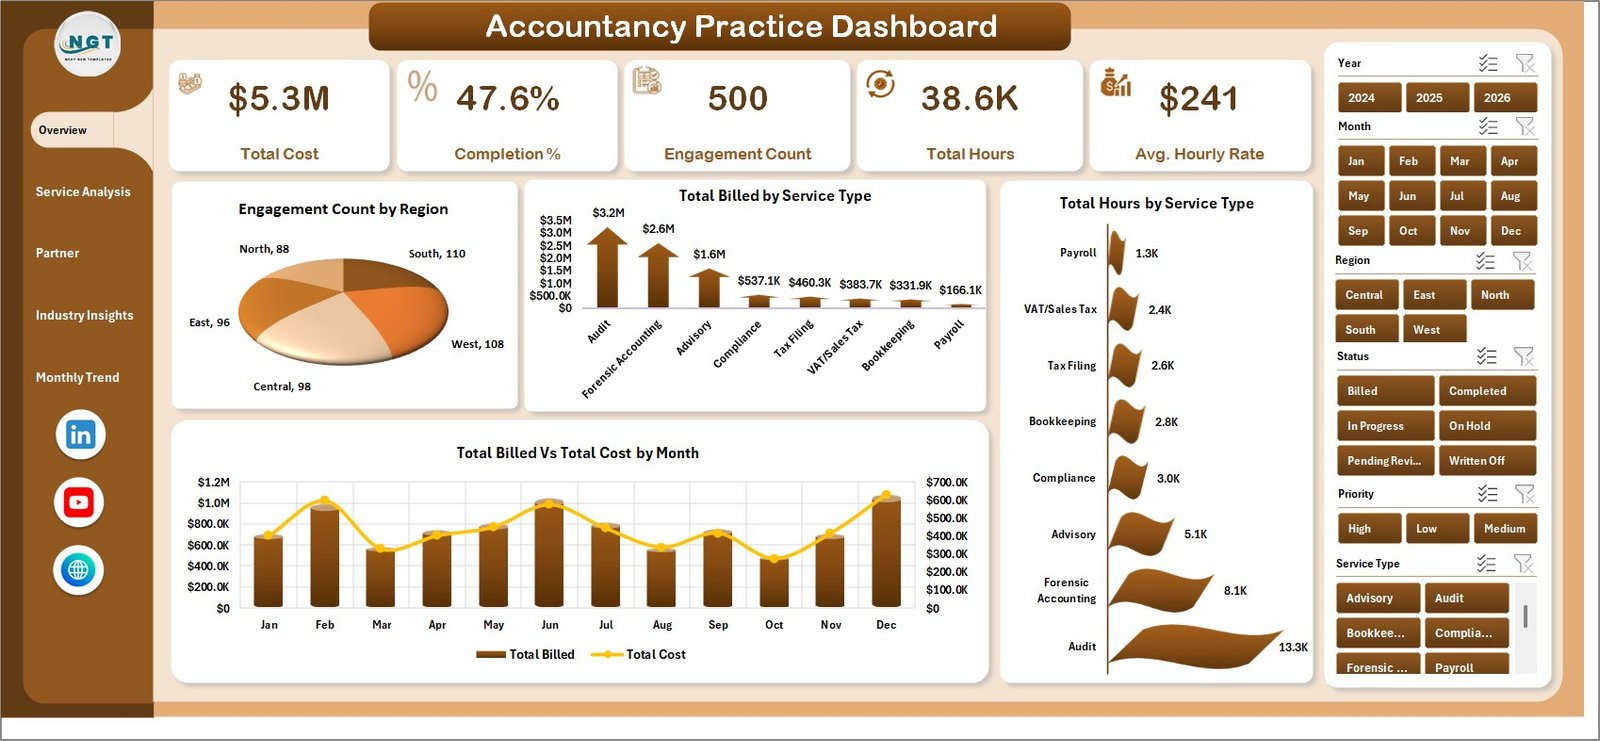
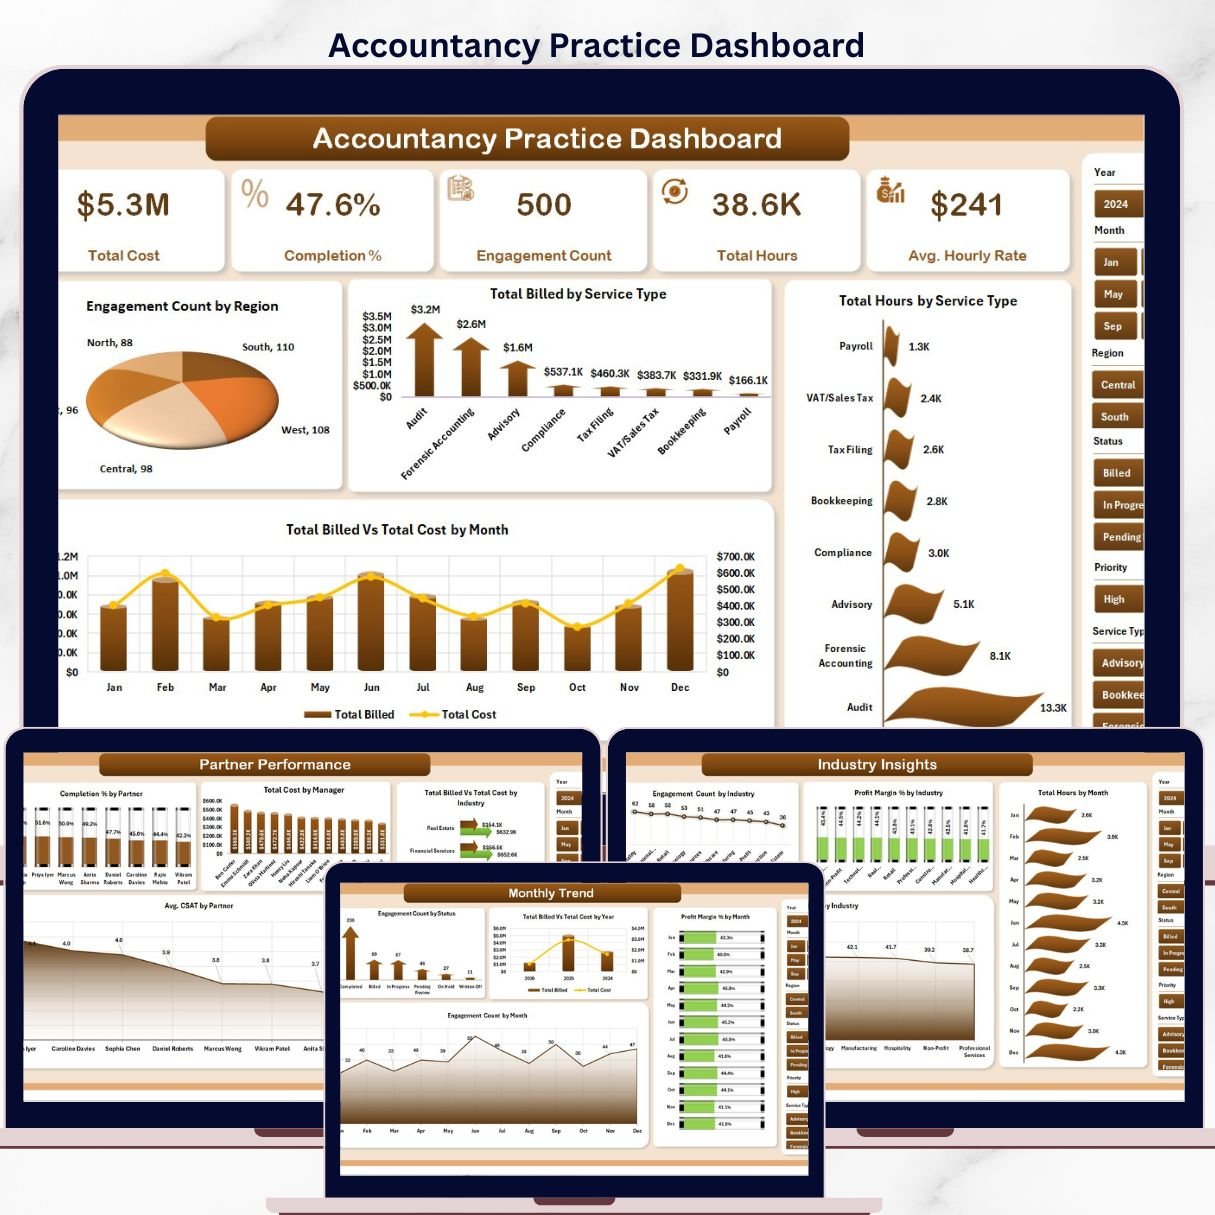
Accountancy Practice Dashboard
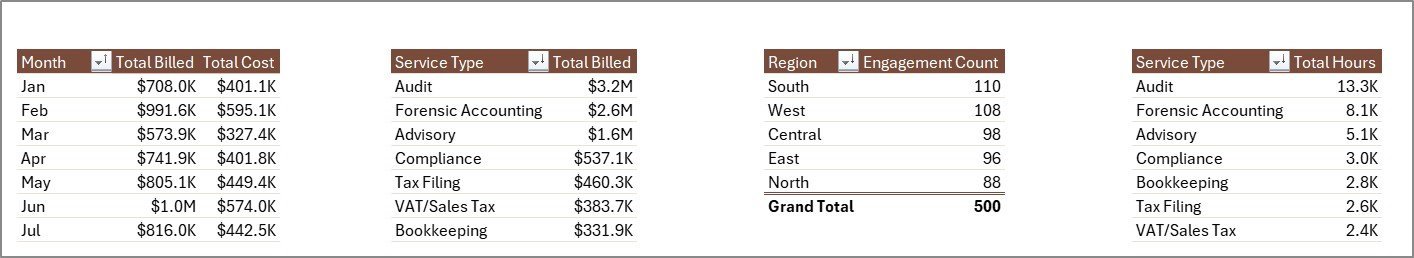
1. Overview Page — The command centre for your practice. Five KPI cards sit above four pivot charts: Engagement Count by Region shows geographic client spread; Total Billed by Service Type reveals revenue mix; Total Hours by Service Type tracks capacity consumption; and Total Billed vs Total Cost by Month highlights profitability timing. Slicers filter the entire page in a single click.
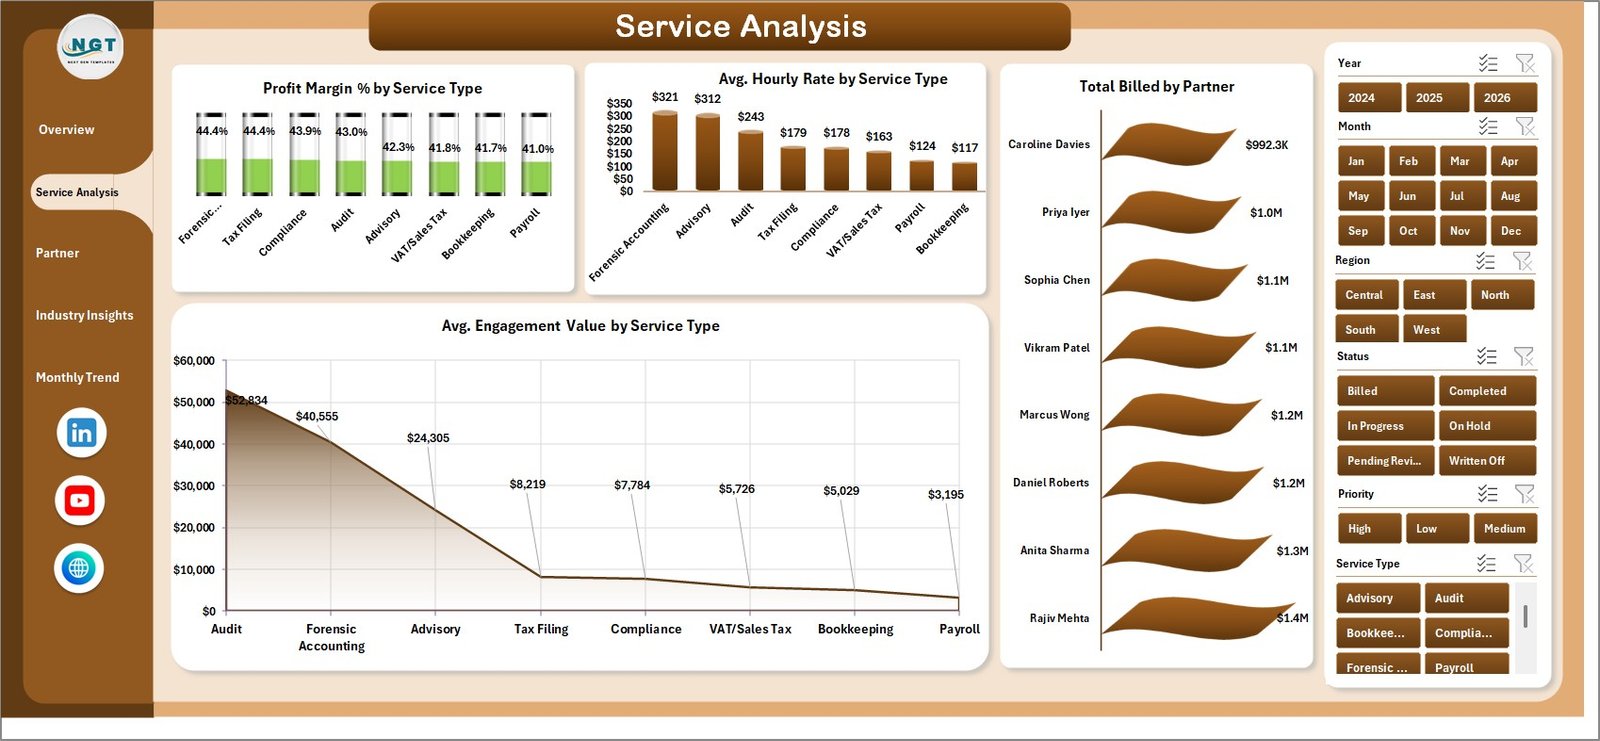
Service Analysis
2. Service Analysis — Examines service-level economics. Tracks Profit Margin % by Service Type, Avg. Hourly Rate by Service Type, Total Billed by Partner, and Avg. Engagement Value by Service Type — showing which services drive margin and which consume resource without proportional return.
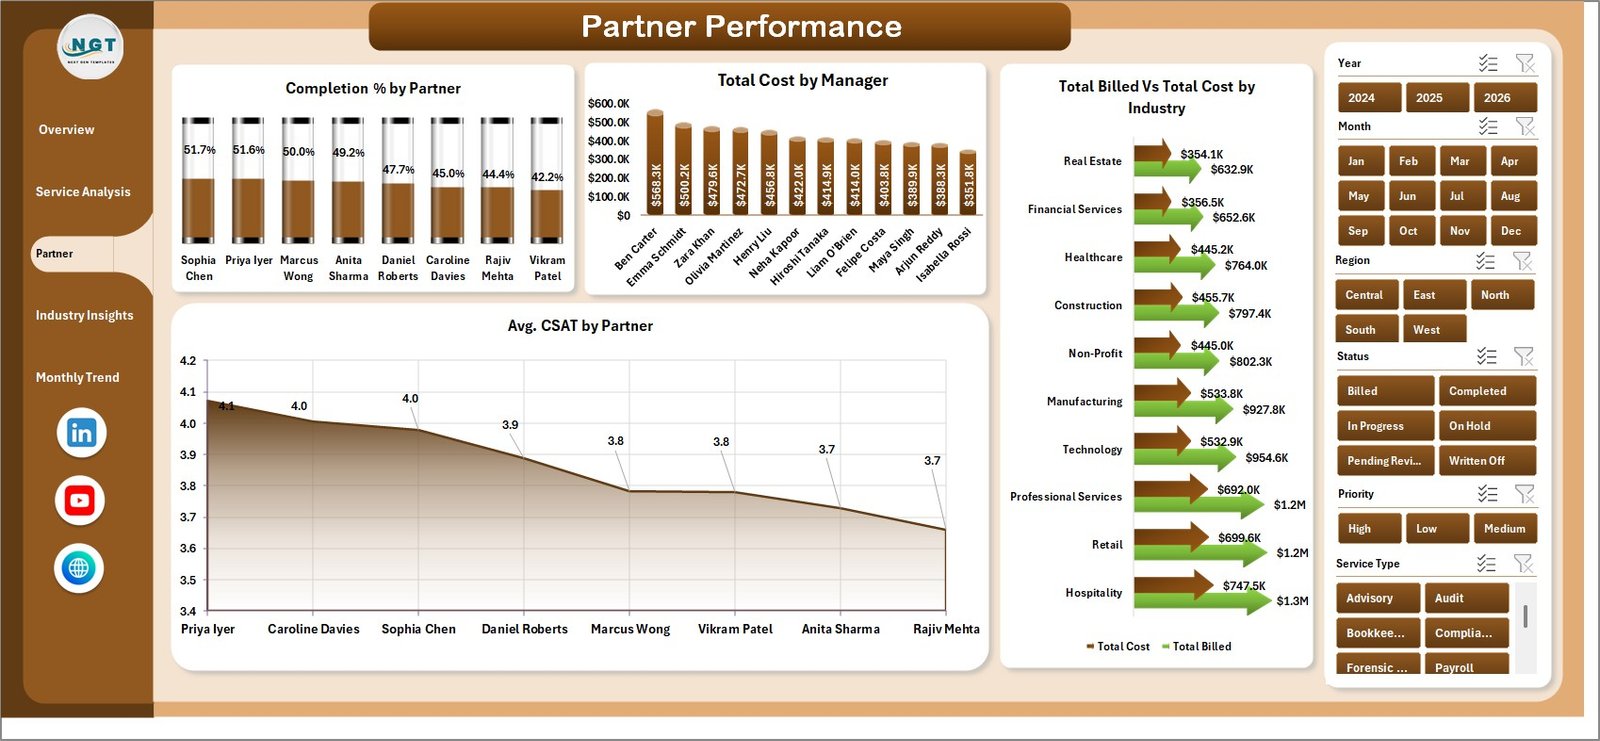
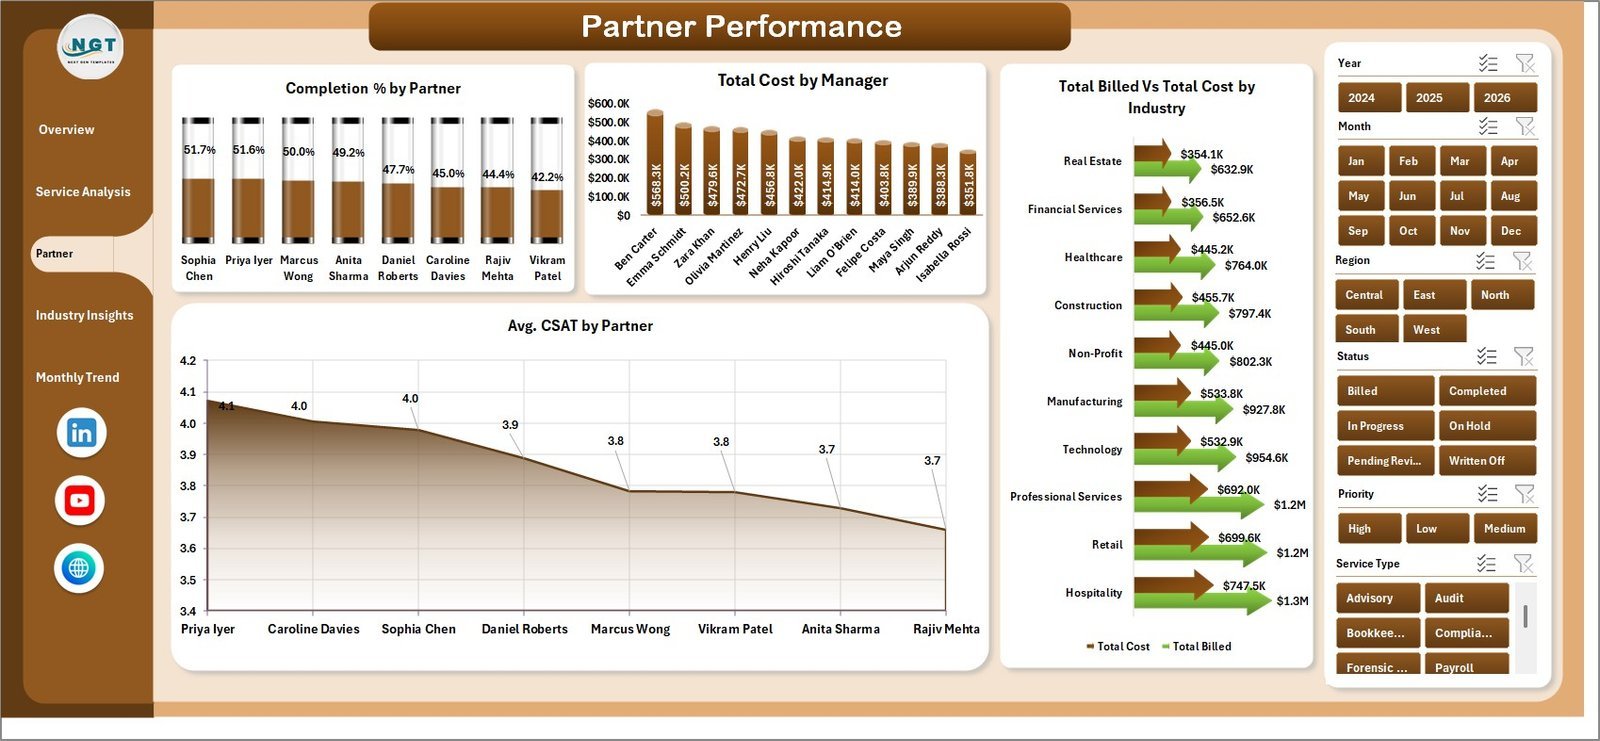
Partner Performance
3. Partner Performance — Benchmarks each partner’s contribution. Includes Completion % by Partner, Total Cost by Manager, Total Billed vs Total Cost by Industry, and Avg. CSAT by Partner — critical inputs for partner reviews and capacity planning.

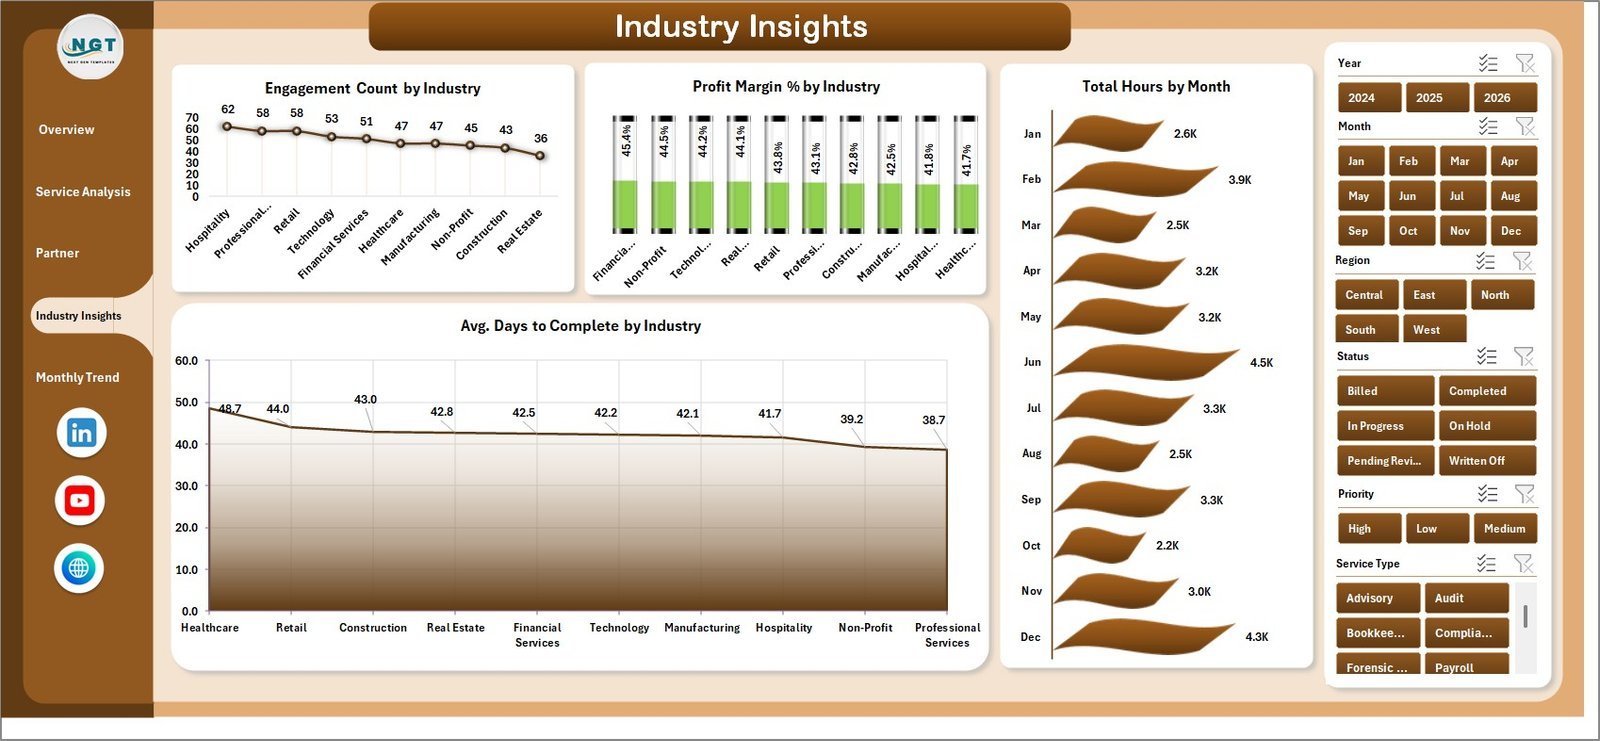
Industry Insights
4. Industry Insights — Reveals which client industries are most profitable and time-intensive. Charts cover Engagement Count by Industry, Profit Margin % by Industry, Total Hours by Month, and Avg. Days to Complete by Industry — useful for strategic client targeting.
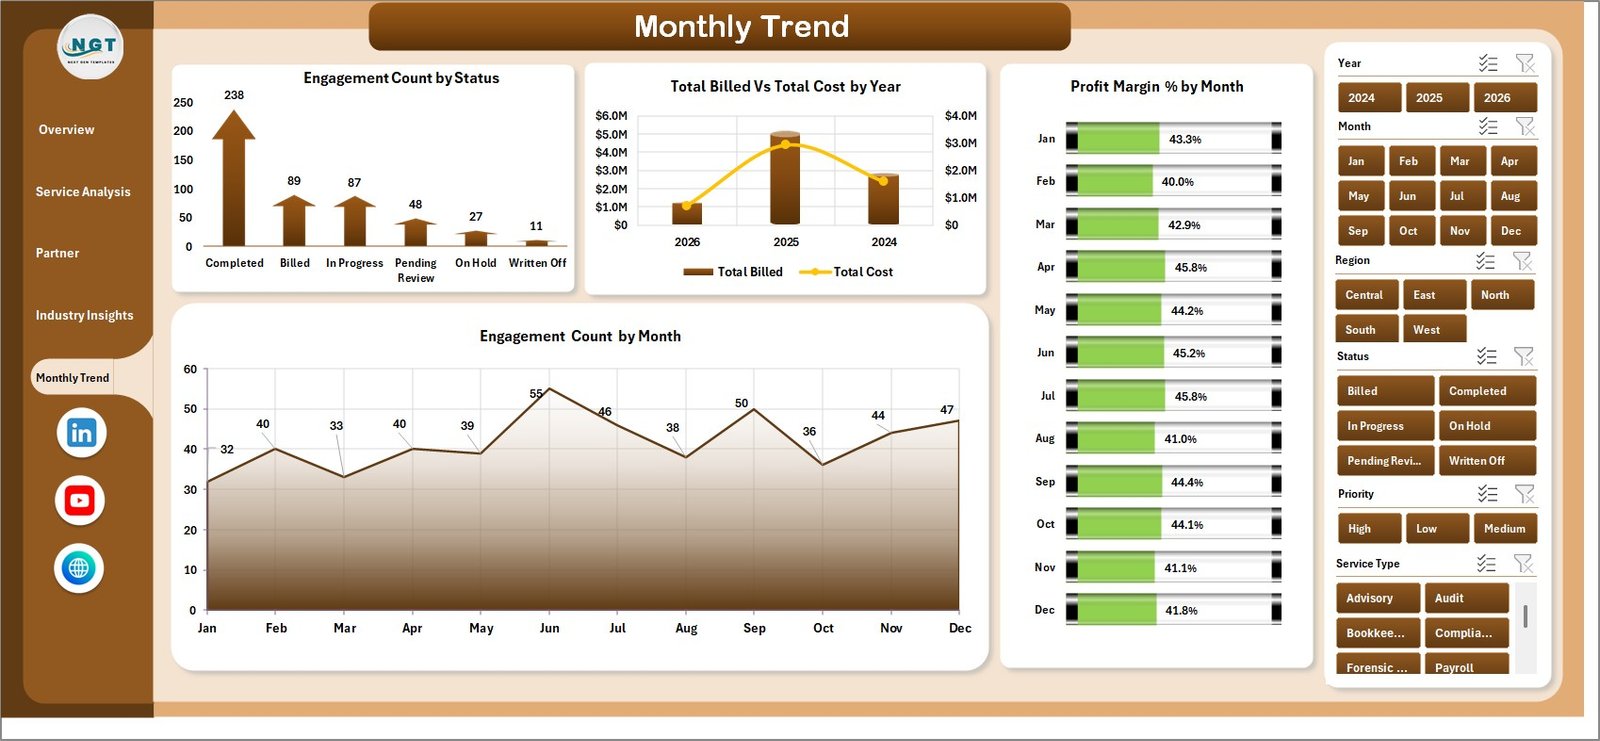
Monthly Trend
5. Monthly Trend — Tracks performance patterns over time with Engagement Count by Status, Total Billed vs Total Cost by Year, Profit Margin % by Month, and Engagement Count by Month — ideal for spotting seasonal peaks and year-on-year growth.
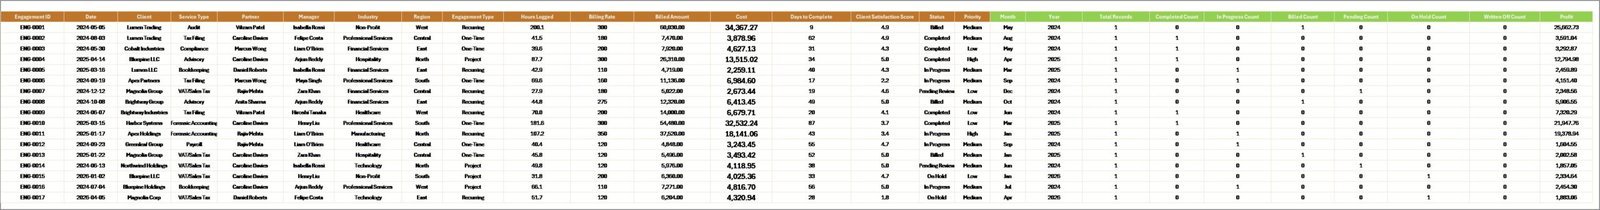
Data Sheet Tab
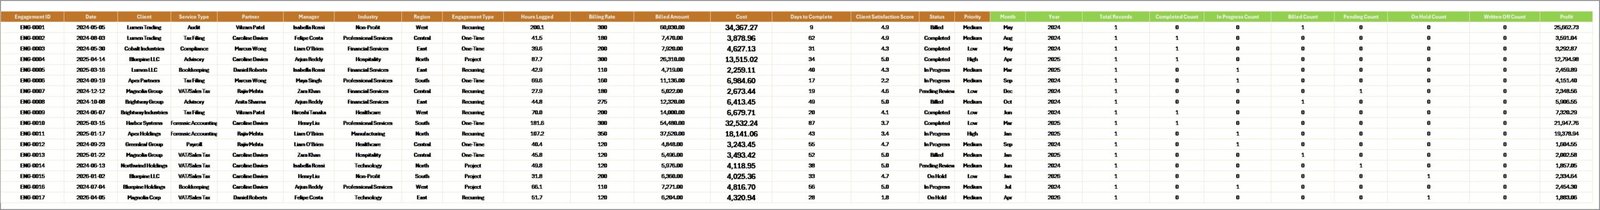
6. Data Sheet — The single source of truth. Enter engagement records in the structured columns; all dashboard pages draw from this sheet automatically.
Support Sheet Tab
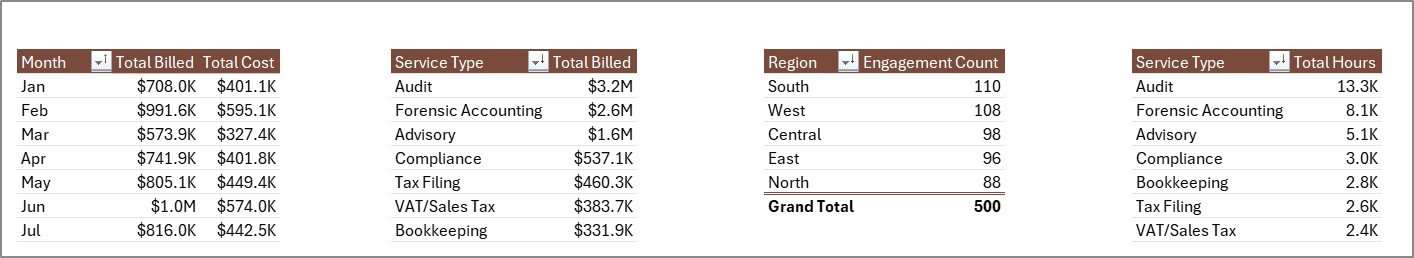
7. Support Sheet — Contains all pivot tables that power the five dashboard pages. After updating your Data sheet, click Refresh All to regenerate everything instantly. Keep this sheet hidden in production.
📊 Accountancy Practice Dashboard in Excel vs. Google Sheets vs. Paid Practice Management SaaS — Where This Fits
| Feature | Accountancy Practice Dashboard in Excel | Google Sheets Dashboard | Karbon / Xero Practice Manager |
|---|---|---|---|
| Cost | $17.99 one-time | $0–15 one-time | $59–$99/user/month |
| Platform | Microsoft Excel (offline + cloud) | Browser-based | Cloud SaaS only |
| Setup time | <10 minutes | <15 minutes | 2–6 weeks + onboarding fees |
| Real-time collaboration | Via OneDrive / SharePoint | ✅ Native | ✅ Native |
| Mobile access | Via Excel Mobile app | ✅ Full | ✅ Full |
| Customisable fields | ✅ Full control | ✅ Full control | Limited |
| Partner-level CSAT tracking | ✅ Built-in | Manual setup needed | ✅ Built-in |
| Year-1 cost at 5 users | $17.99 total | $0–15 total | $3,540–$5,940 |
For accounting practices that need partner-level analytics without paying per-seat SaaS fees, the Accountancy Practice Dashboard in Excel sits in the sweet spot.
👥 Who This Template Is For — and Who It’s Not For
✅ This template is built for:
- Accounting firm partners and practice managers tracking engagement profitability
- CPA firms and audit practices monitoring billing hours by service type and partner
- Finance directors needing cross-industry client performance snapshots
- Small to mid-size accountancy practices (5–200 staff) replacing manual reporting spreadsheets
❌ This template is NOT for:
- Enterprise firms needing real-time multi-user CRM integration (consider Karbon or CCH)
- Practices requiring automated client invoicing or billing workflow automation
- Teams without Microsoft Excel 2016 or later access
⚙️ How to Use the Accountancy Practice Dashboard in Excel
- Download and open the file in Microsoft Excel 2016 or later (Microsoft 365 recommended).
- Enter your engagement data in the Data sheet using the same column structure as the sample records.
- Refresh all pivots by going to the Data tab in the Excel Ribbon and clicking “Refresh All”.
- Apply slicers on any dashboard page to filter by region, service type, partner, or industry.
- Customise labels, colours, or chart titles to match your firm’s branding as needed.
- Hide the Support sheet once ready to share the file with your team.
💼 Real-World Use Cases
James manages operations at a 40-person regional CPA firm. Each month he pastes updated engagement records into the Data sheet, clicks Refresh All, and sends the Partner Performance page to managing partners — replacing a manual 3-hour reporting process with a 10-minute refresh cycle. He monitors Avg. CSAT by Partner to flag client satisfaction issues before they escalate.
Priya is a finance controller at a mid-size accounting practice with clients across retail, manufacturing, and healthcare. She uses the Industry Insights page to compare Profit Margin % and Avg. Days to Complete by industry, helping leadership decide which client segments to prioritise during peak season.
A solo accountant running a boutique practice tracks the Total Billed vs Total Cost by Month chart on the Overview page to confirm monthly billing covers overhead — without paying $59/month for practice management software. The Monthly Trend page helps spot which months consistently underperform for engagement closures.
❓ Frequently Asked Questions
What KPIs does the Accountancy Practice Dashboard in Excel track?
The Accountancy Practice Dashboard in Excel tracks 5 KPI cards on the Overview page — Total Cost, Completion %, Engagement Count, Total Hours, and Avg. Hourly Rate — plus 20 charts spanning service, partner, industry, and monthly dimensions across all 5 dashboard pages.
What version of Excel is required?
The Accountancy Practice Dashboard in Excel is compatible with Microsoft Excel 2016, 2019, 2021, and Microsoft 365 on both Windows and Mac. It uses native pivot tables and slicers only — no VBA macros or third-party add-ins are required.
Can I add my own service types and partner names?
Yes. Update the Data sheet with your firm’s actual service types, partner names, and industry categories. After clicking Refresh All in the Excel Ribbon, all pivot tables and charts update to reflect your data automatically without any formula editing.
How does this compare to Karbon or Xero Practice Manager?
Karbon and Xero Practice Manager are cloud SaaS tools costing $59–$99/user/month with built-in workflow automation. The Accountancy Practice Dashboard in Excel is a one-time $17.99 download focused on analytics and KPI visibility, with no subscription, no per-user fees, and full Excel customisability.
Is this template suitable for a solo accountant or small firm?
Yes. The Accountancy Practice Dashboard in Excel scales from solo practitioners managing 10 engagements to firms with hundreds of records. The Data sheet handles any volume, and the dashboard auto-refreshes regardless of how many rows you enter.
Can I share this with my team?
Yes. Save the file to OneDrive or SharePoint to share it across your team via Microsoft 365. Multiple users can view simultaneously; one person handles data updates and clicks Refresh All to push the latest figures to everyone.
👤 About the Author
Built by PK — Microsoft Certified Professional with 15+ years of Excel, Google Sheets, and Power BI experience. Founder of NextGenTemplates, reaching 300K+ subscribers across YouTube channels (@PK-AnExcelExpert, @NextGenTemplates, @NeoTechNavigators). Every template is hand-built and tested before release.
🔗 Explore Related Templates
📊 Accounting Firms Dashboard in Excel — Analytics dashboard built for accounting firm operations and client profitability tracking.
📊 Accounting Firms KPI Dashboard in Excel — Scorecard-style KPI views with trend indicators for accounting practices.
📊 Accounting Firms Dashboard in Power BI — The same practice analytics in Power BI for teams on Microsoft Power Platform.
📁 Browse all Excel Dashboard Templates →
📖 Click here to read the Detailed Blog Post
🎥 Visit our YouTube channel for step-by-step video tutorials
👉 YouTube.com/@NextGenTemplates
📅 Last updated: May 2026
Watch the step-by-step video tutorial:


Reviews
There are no reviews yet.