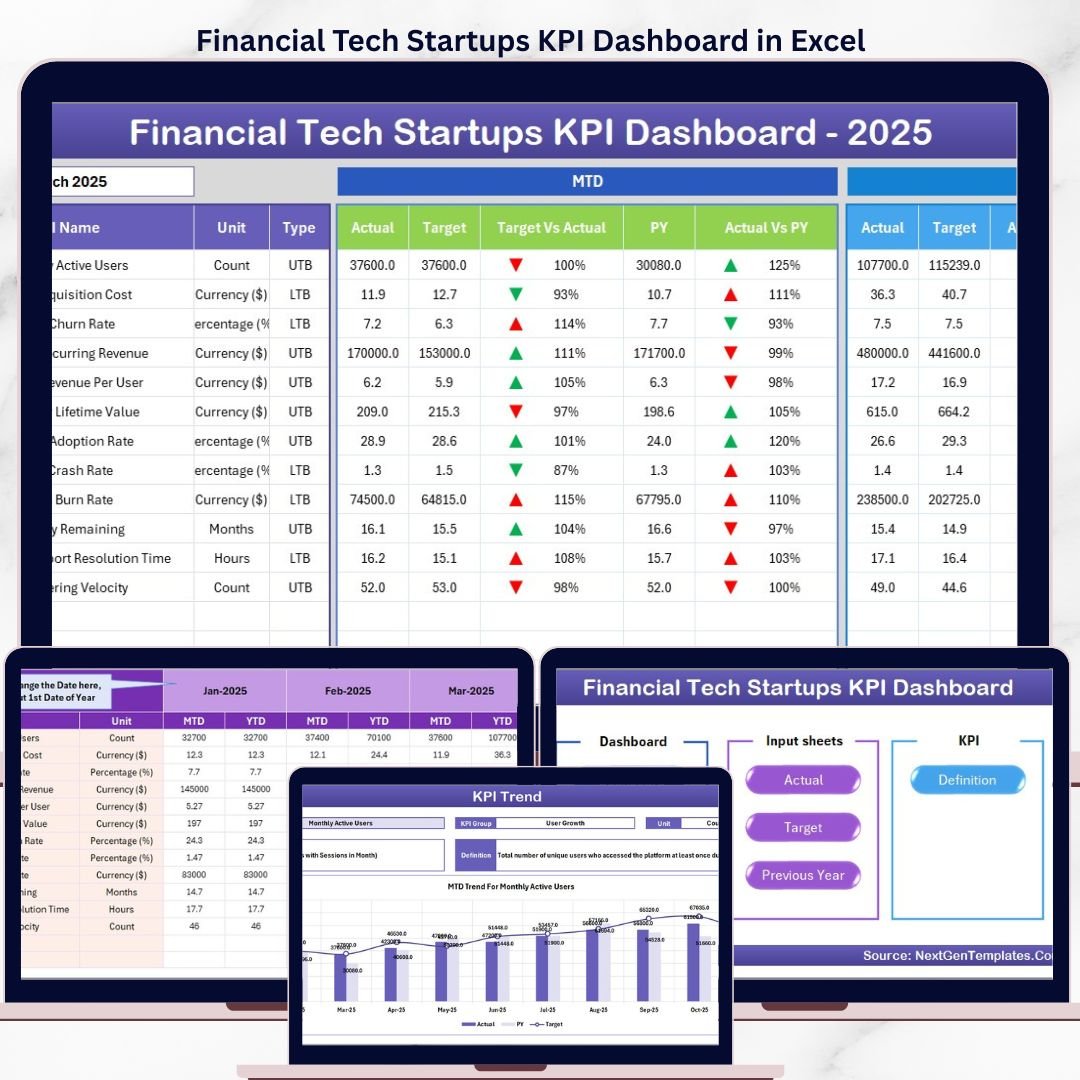


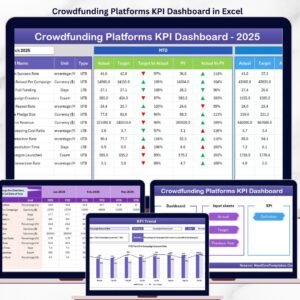
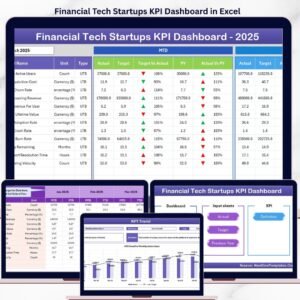
The Financial Tech Startups KPI Dashboard in Excel tracks fintech-specific KPIs across 7 interactive worksheets, with built-in MTD and YTD comparisons, conditional formatting arrows, and individual KPI trend charts. Setup takes under 10 minutes — just replace the sample data and every metric updates automatically.Financial Tech Startups KPI Dashboard in Excel
🌍 Join 8,400+ teams in 40+ countries using NextGenTemplates to replace paid SaaS tools with one-time-purchase Excel, Google Sheets, Power BI, and HTML templates.Financial Tech Startups KPI Dashboard in Excel
✅ Instant download · One-time payment · No subscription · No per-user fees · Lifetime access
🔑 Key Features of Financial Tech Startups KPI Dashboard in Excel
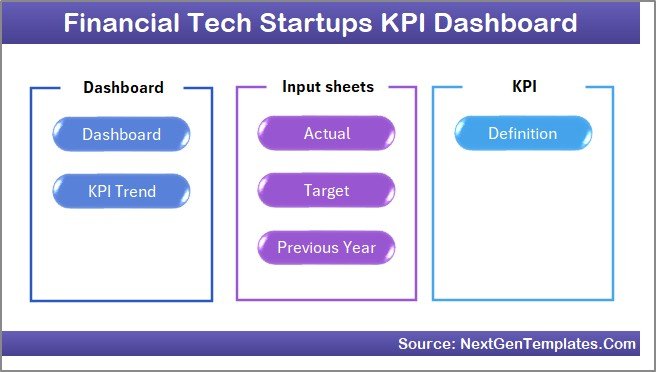
This Excel KPI dashboard is built specifically for financial technology startups tracking operational and financial metrics. It includes 7 worksheets covering a home navigation page, a main dashboard with month-selectable KPI views, a KPI trend analysis page, three data input sheets (Actual, Target, Previous Year), and a KPI definition sheet where you define each metric’s name, group, formula, and type.
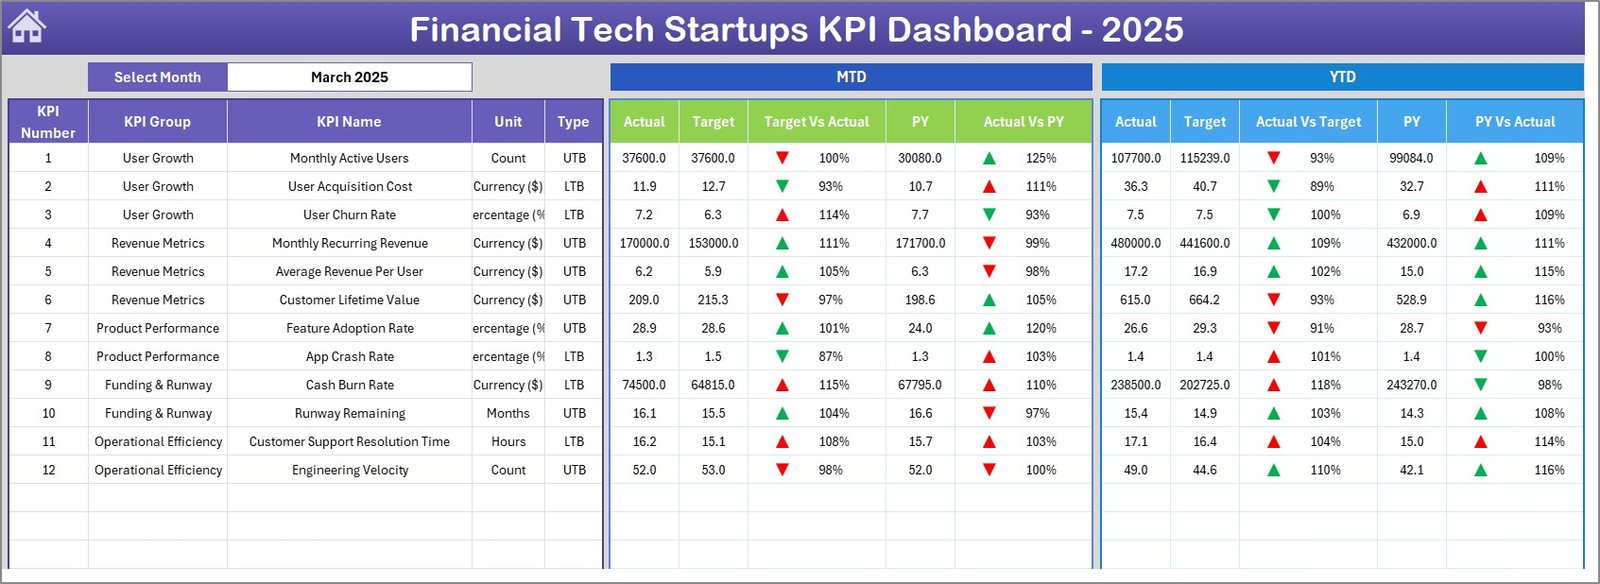
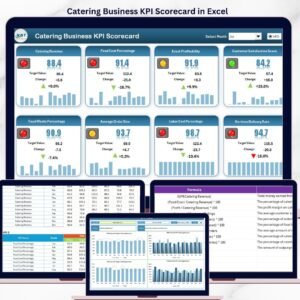
📌 The dashboard displays MTD Actual, Target, and Previous Year data alongside YTD Actual, Target, and Previous Year numbers — all with Target vs Actual and PY vs Actual variance columns using conditional formatting up/down arrows. Each KPI can be classified as LTB (Lower the Better) or UTB (Upper the Better) to ensure the arrows point in the right direction based on performance context.
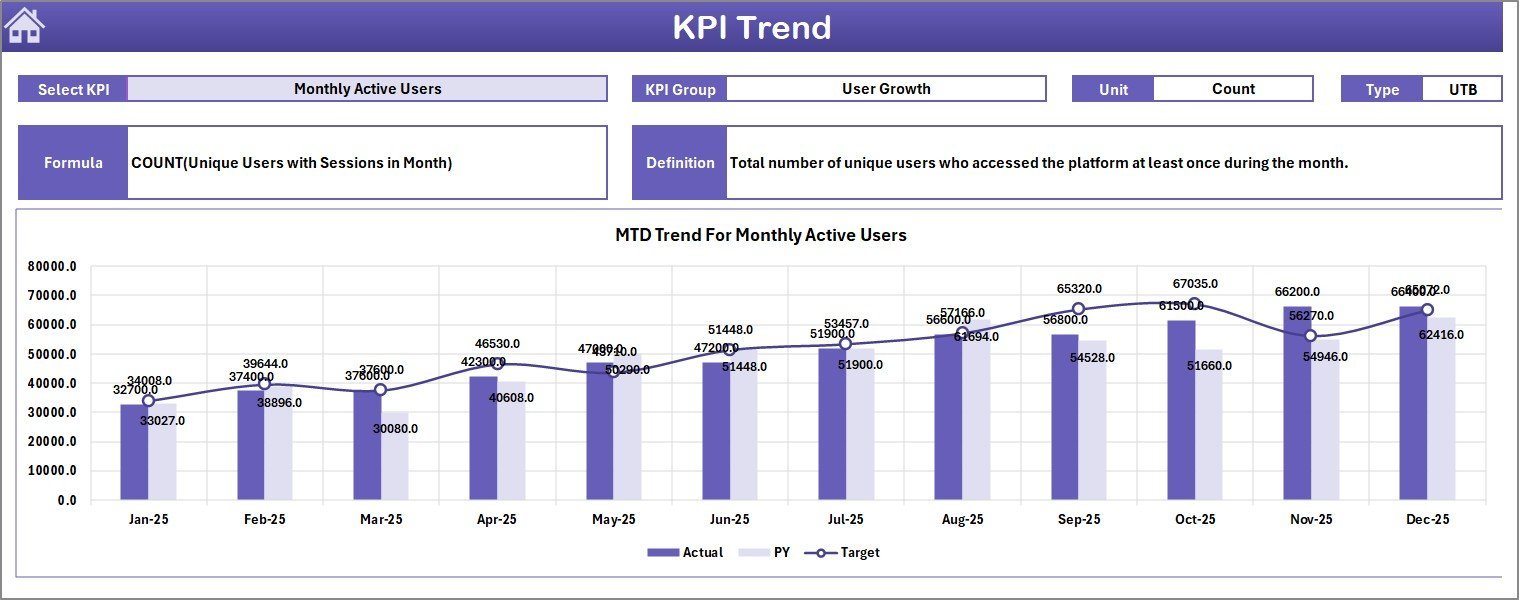
📌 The KPI Trend sheet lets you select any individual KPI from a dropdown and instantly see its MTD and YTD trend charts comparing Actual, Target, and Previous Year lines. It also shows the KPI Group, Unit, Type, Formula, and Definition for quick reference.
📌 No macros or VBA required — the entire dashboard runs on native Excel formulas and conditional formatting, making it compatible with Excel 2016, 2019, 2021, and Microsoft 365.
If you are looking for more finance-related dashboards, explore our Excel Dashboard Templates collection or browse KPI Dashboard Templates for other industries.Financial Tech Startups KPI Dashboard in Excel
📦 What’s Inside the Financial Tech Startups KPI Dashboard
This template includes 7 worksheets designed for fintech startup performance tracking:Financial Tech Startups KPI Dashboard in Excel
📄 1. Home Sheet — An index page with 6 navigation buttons to jump directly to any worksheet.Financial Tech Startups KPI Dashboard in Excel
Home Page
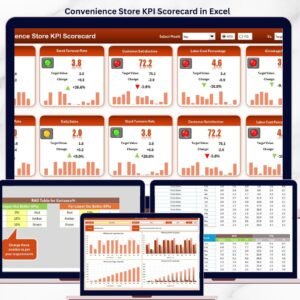
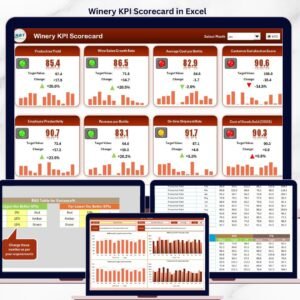
📄 2. Dashboard Sheet — The main KPI view. Select a month from the dropdown on cell D3 and the entire dashboard refreshes. Displays MTD and YTD columns for Actual, Target, and Previous Year with variance indicators using conditional formatting arrows.
Financial Tech Startups KPI Dashboard
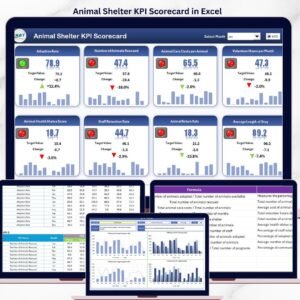
📄 3. KPI Trend Sheet — Select any KPI from the dropdown on cell C3. The sheet displays the KPI Group, Unit, Type (LTB/UTB), Formula, and Definition. Below, MTD and YTD trend charts show Actual vs Target vs Previous Year performance over time.

KPI Trend Sheet
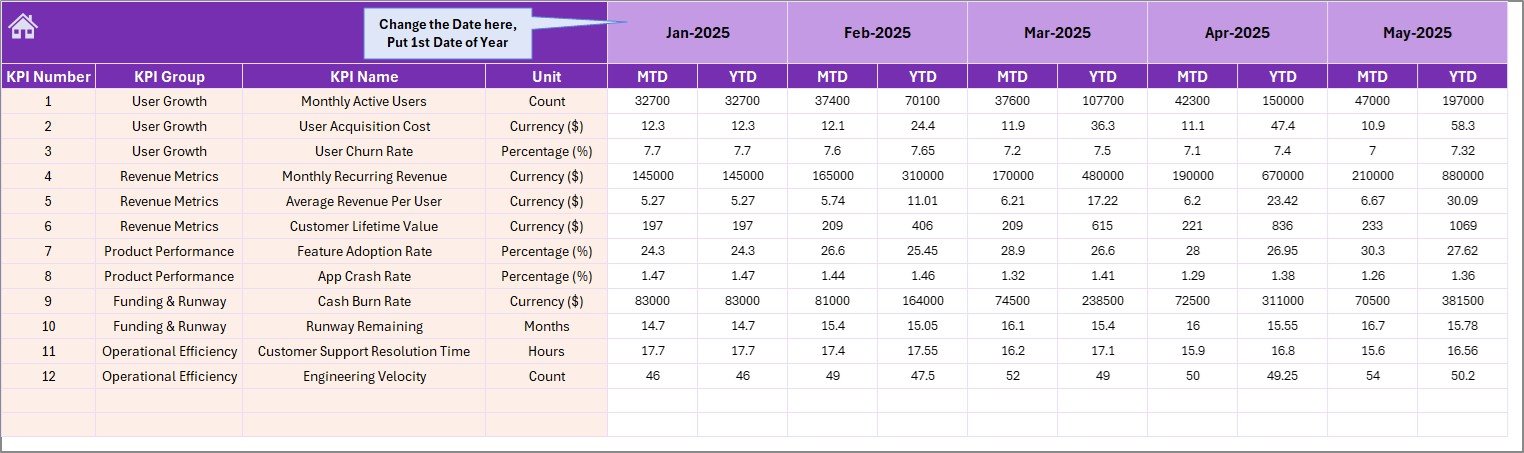
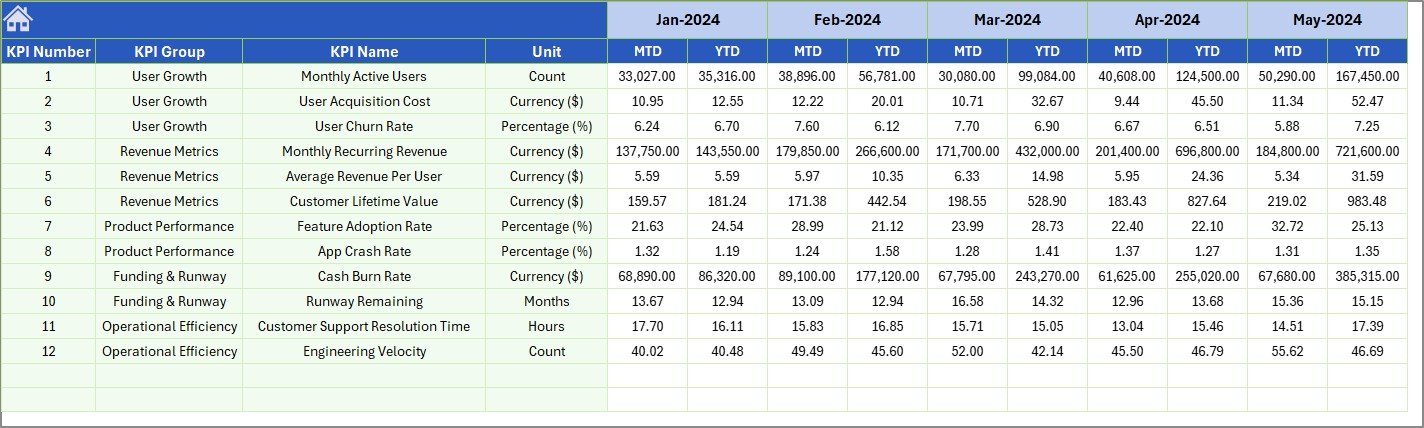
📄 4. Actual Numbers Input Sheet — Enter your actual MTD and YTD numbers here for each KPI. Change the starting month from cell E1 to align with your fiscal year.
Actual Numbers Input Sheet
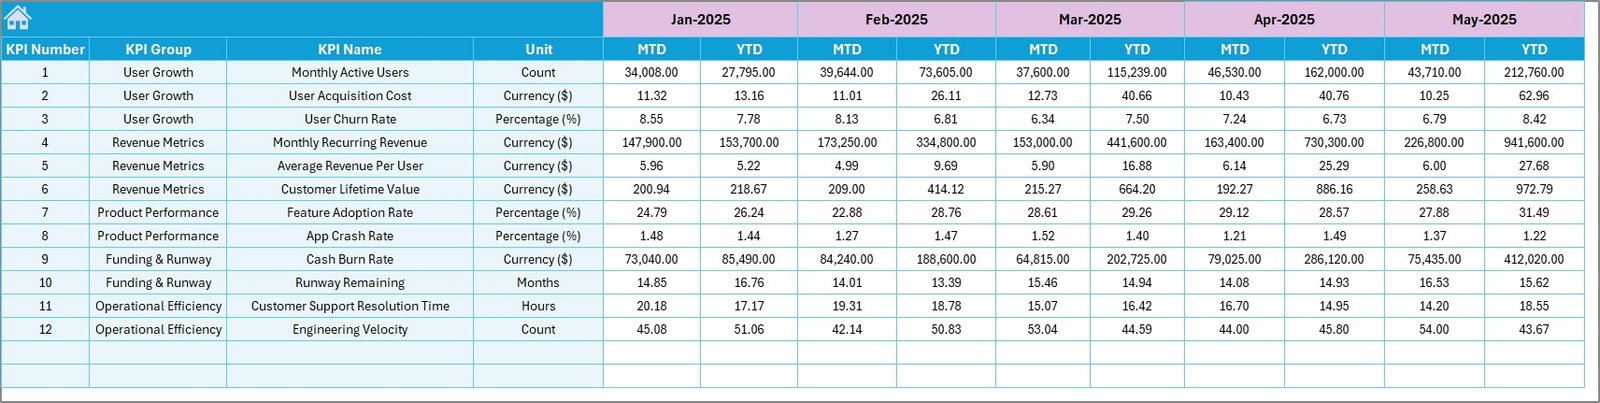
📄 5. Target Number Input Sheet — Enter target numbers for each KPI by month, both MTD and YTD.
Target Number Input Sheet
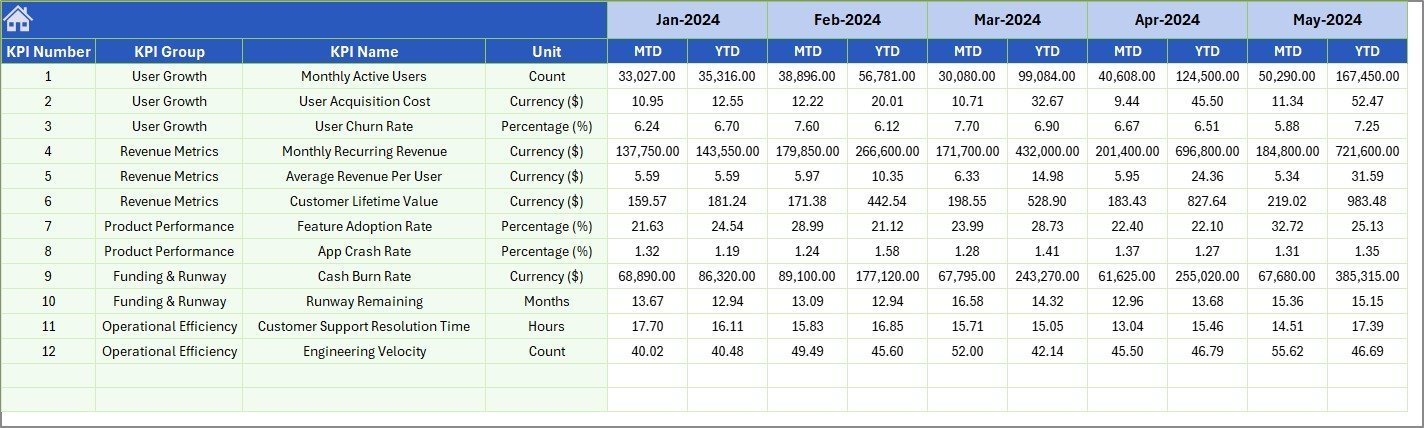
📄 6. Previous Year Number Sheet — Enter last year’s numbers in the same format as the current year for accurate year-over-year comparisons.
Previous Year Number Input Sheet
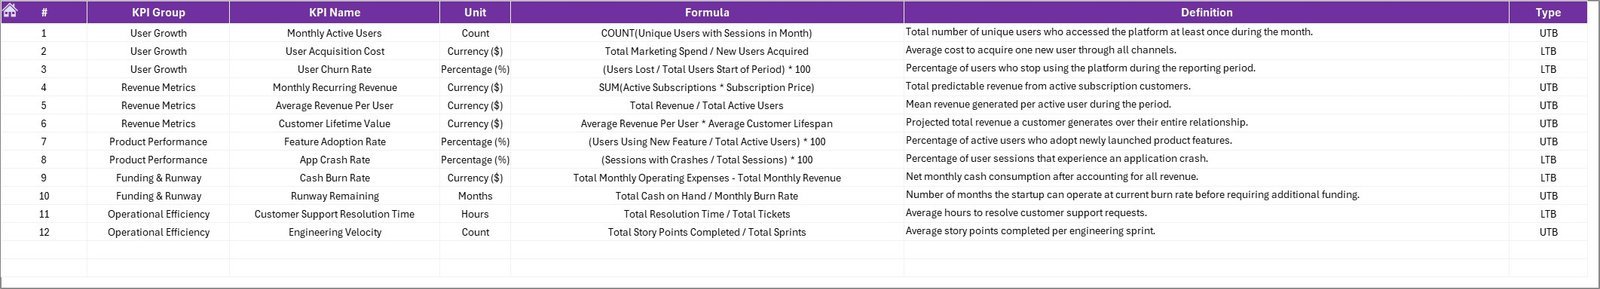
📄 7. KPI Definition Sheet — Define each KPI’s name, group, unit, formula, and definition. Mark each KPI as LTB (Lower the Better) or UTB (Upper the Better) in the last column.Financial Tech Startups KPI Dashboard in Excel

KPI Definition Sheet
📊 Financial Tech Startups KPI Dashboard vs. Google Sheets vs. Paid SaaS — Where This Fits
| Feature | Financial Tech Startups KPI Dashboard (Excel) | Google Sheets Equivalent | Klipfolio / Databox |
|---|---|---|---|
| Cost | $14.99 one-time ✅ | Free (build from scratch) | $99–$399/month |
| Platform | Microsoft Excel ✅ | Google Sheets | Cloud SaaS |
| Setup Time | Under 10 minutes ✅ | 4–8 hours (DIY) | 1–3 hours |
| Real-time Collaboration | Via OneDrive/SharePoint | Yes (native) | Yes (native) |
| Mobile Access | Excel Mobile App | Google Sheets App | Yes (native app) |
| Customizable KPIs | Unlimited — define your own ✅ | Manual formula setup | Pre-built connectors |
| LTB/UTB KPI Logic | Built-in ✅ | Manual conditional logic | Limited |
| Year-1 Cost (5 Users) | $14.99 total ✅ | $0 (but 8+ hours labor) | $1,188–$4,788 |
| Offline Access | Full offline ✅ | Limited offline | No |
For fintech startups that want structured KPI tracking without paying $99+/month for SaaS dashboards, this Excel template sits in the sweet spot.
👥 Who This Template Is For — and Who It’s Not For
✅ This template is built for:
- Fintech startup founders and COOs tracking 10–30 operational and financial KPIs monthly
- Finance managers at digital payment, lending, or insurtech companies needing MTD/YTD reporting
- Startup analysts preparing board-ready KPI reports without investing in expensive BI tools
- Consultants advising early-stage fintech companies on performance metrics
❌ This template is NOT for:
- Enterprise fintech companies needing real-time API-connected dashboards with 100+ data sources
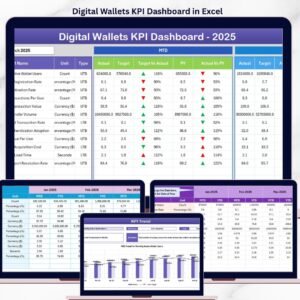
- Teams requiring multi-user concurrent editing (consider our Digital Wallets KPI Dashboard in Google Sheets for collaboration)
- Organizations needing SOC 2 compliance and audit trails — a dedicated BI platform like Tableau or Power BI is better suitedFinancial Tech Startups KPI Dashboard in Excel
⚙️ How to Use the Financial Tech Startups KPI Dashboard
1. Download and open the .xlsx file in Microsoft Excel (2016 or later).
2. Go to the KPI Definition sheet and enter your fintech KPI names, groups, units, formulas, definitions, and LTB/UTB types.
3. Enter actual numbers in the Actual Numbers Input sheet — fill in MTD and YTD values for each month.
4. Enter target numbers in the Target Number Input sheet for each KPI and month.
5. Enter previous year data in the Previous Year Number sheet for year-over-year comparisons.
6. Go to the Dashboard sheet and select a month from the dropdown on cell D3 — all KPIs update instantly.
7. Use the KPI Trend sheet to select individual KPIs and analyze their performance trends over time.
💼 Real-World Use Cases
Ravi leads operations at a digital lending startup with 45 employees. He uses the Financial Tech Startups KPI Dashboard to track loan disbursement rates, default percentages, and customer acquisition costs monthly. Every board meeting, he selects the relevant month, exports the dashboard view, and presents it directly — saving 6 hours of manual report building each quarter.
Meera is a CFO at a payment processing fintech in Series A. She tracks 18 KPIs including transaction volume, payment success rate, chargeback ratio, and gross margin using this dashboard. The LTB/UTB logic ensures that metrics like chargeback ratio correctly show green arrows when the number decreases — something her old spreadsheet got wrong consistently.
James consults for 3 early-stage fintech companies. He uses one copy of this template per client, customizing the KPI definitions for each business model. The KPI Trend sheet lets him quickly identify which metrics are trending off-target during monthly review calls — without switching between multiple tools.
❓ Frequently Asked Questions
What KPIs can I track with the Financial Tech Startups KPI Dashboard?
You can track any KPI relevant to your fintech business. The KPI Definition sheet lets you define unlimited KPIs including transaction volume, customer acquisition cost, churn rate, loan default rate, gross margin, and more. Each KPI gets its own trend chart and variance tracking.
Does this Excel dashboard work without macros?
Yes. The Financial Tech Startups KPI Dashboard runs entirely on native Excel formulas and conditional formatting. No macros, no VBA, and no special add-ins needed. It works in Excel 2016, 2019, 2021, and Microsoft 365.
How does this compare to using Klipfolio or Databox for fintech KPIs?
Klipfolio starts at $99/month and Databox at $47/month. This Excel dashboard costs $14.99 one-time with no recurring fees. If you need API integrations and real-time data, SaaS tools are better. For monthly manual KPI tracking and board reporting, this template delivers the same insights at a fraction of the cost.
Can I customize the KPI groups and definitions?
Absolutely. The KPI Definition sheet lets you set custom KPI names, group names, measurement units, calculation formulas, text definitions, and LTB/UTB type classifications. Every change automatically reflects in the Dashboard and KPI Trend sheets.
How long does setup take?
Initial setup takes under 10 minutes. Enter your KPI definitions, plug in your actual and target numbers for the current month, and the dashboard is ready. Adding previous year data for year-over-year comparisons takes an additional 5–10 minutes depending on how many KPIs you track.
Can I use this for non-fintech businesses?
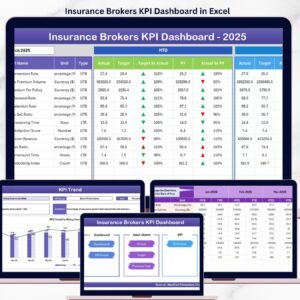
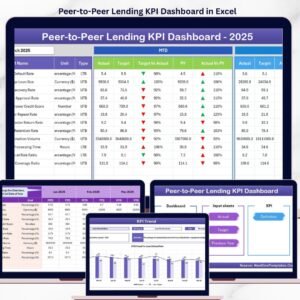
Yes. While the template is designed for fintech startups, the KPI structure is fully customizable. You can repurpose it for any industry by changing the KPI names and definitions. For industry-specific dashboards, explore our Peer-to-Peer Lending KPI Dashboard or Insurance Brokers KPI Dashboard.Financial Tech Startups KPI Dashboard in Excel
Is this template compatible with Mac?
Yes. The Financial Tech Startups KPI Dashboard works on both Windows and Mac versions of Microsoft Excel. Since it uses no macros or VBA, there are no compatibility issues on macOS.Financial Tech Startups KPI Dashboard in Excel
👤 About the Author
Built by PK — Microsoft Certified Professional with 15+ years of Excel, Google Sheets, and Power BI experience. Founder of NextGenTemplates, reaching 300K+ subscribers across YouTube channels (@PK-AnExcelExpert, @NextGenTemplates, @NeoTechNavigators). Every template is hand-built and tested before release.Financial Tech Startups KPI Dashboard in Excel
🔗 Explore Related Templates
📊 Digital Wallets KPI Dashboard in Excel — Track digital wallet transaction metrics, user growth, and payment processing KPIs.Financial Tech Startups KPI Dashboard in Excel
📊 Peer-to-Peer Lending KPI Dashboard in Excel — Monitor loan origination, borrower default rates, and investor returns.Financial Tech Startups KPI Dashboard in Excel
📊 Actuarial Services KPI Dashboard in Excel — Track risk assessment and actuarial performance metrics.
📊 VC Portfolio Dashboard in Excel — Manage venture capital portfolio performance and fund analytics.
📖 Click here to read the Detailed Blog Post
🎥 Visit our YouTube channel for step-by-step video tutorials
👉 YouTube.com/@NextGenTemplates


Reviews
There are no reviews yet.