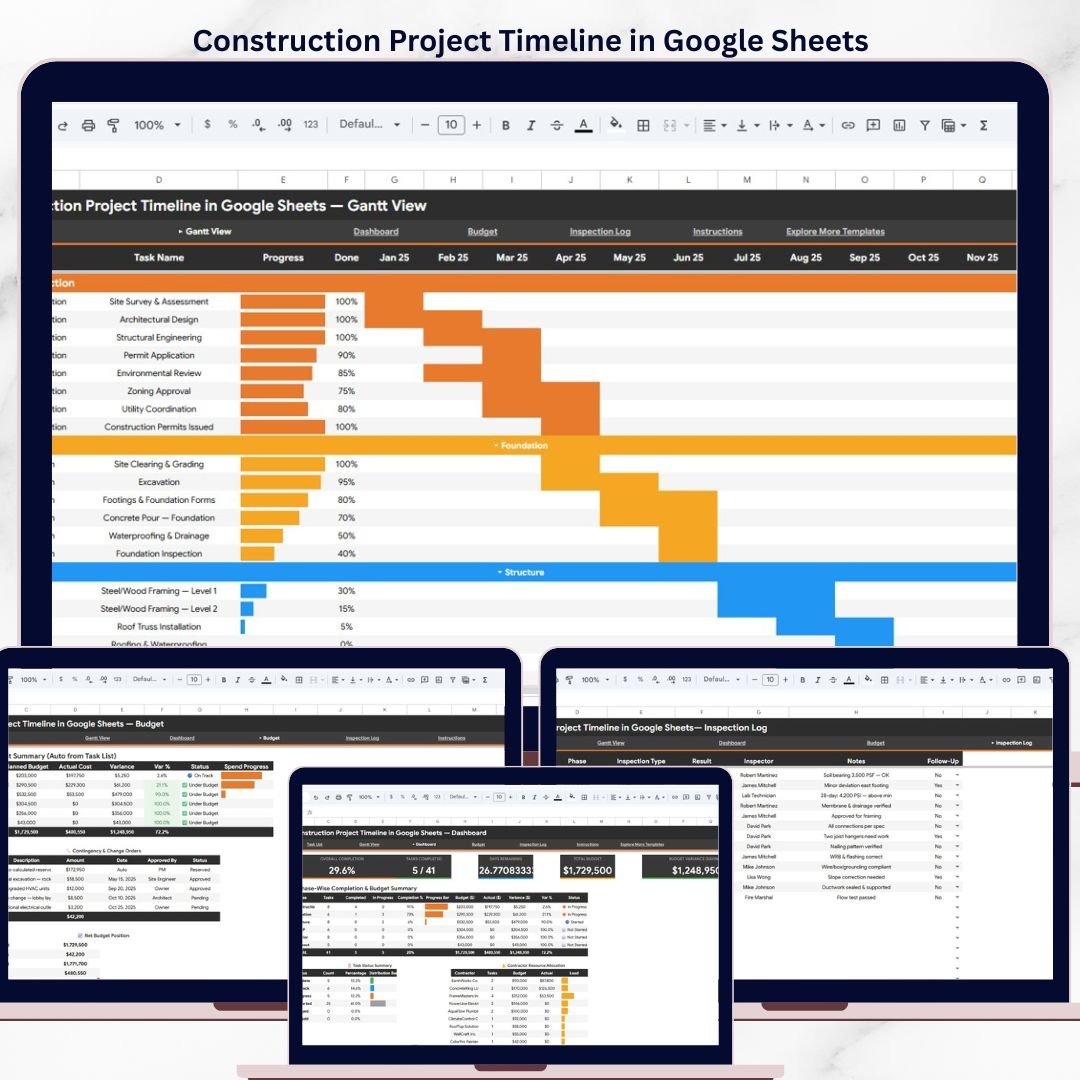


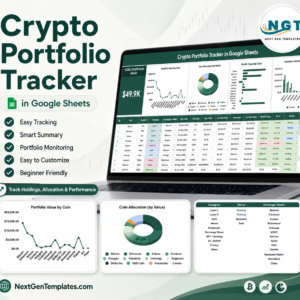
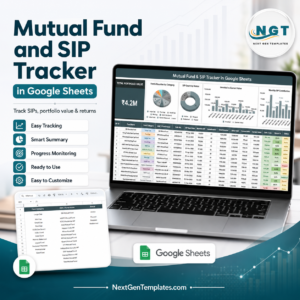
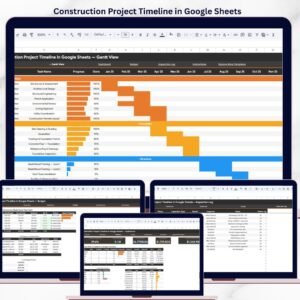
The Construction Project Timeline in Google Sheets tracks 5 KPIs across 5 interactive pages, with 20+ pre-built charts, slicer filters, and a built-in Gantt chart view. Setup takes under 10 minutes — just replace the sample data and every page updates automatically.Construction Project Timeline in Google Sheets
🌍 Join 8,400+ teams in 40+ countries using NextGenTemplates to replace paid SaaS tools with one-time-purchase Excel, Google Sheets, Power BI, and HTML templates.Construction Project Timeline in Google Sheets
✅ Instant download · One-time payment · No subscription · No per-user fees · Lifetime access
🔑 Key Features of Construction Project Timeline in Google Sheets
📌 5-Page Interactive Dashboard – The Construction Project Timeline in Google Sheets includes an Overview page, Gantt View, Dashboard, Budget tracker, and Inspection Log — each designed to give construction project managers full visibility into timelines, costs, and quality checks.Construction Project Timeline in Google Sheets
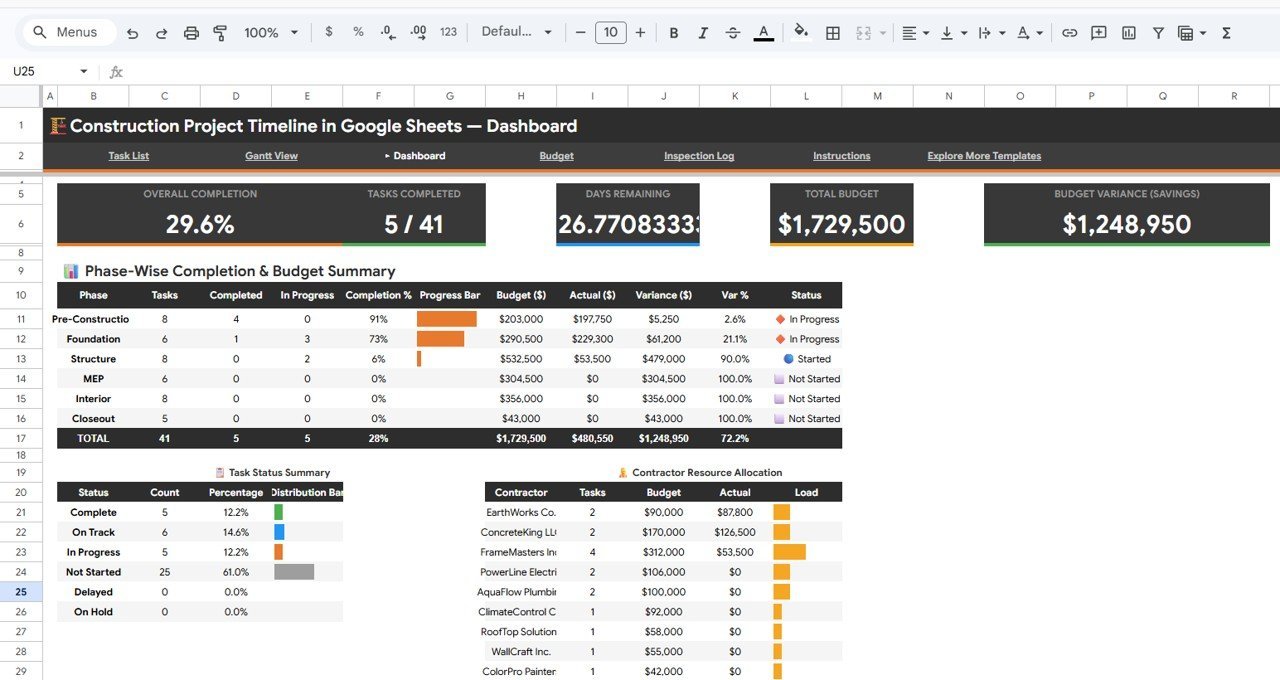
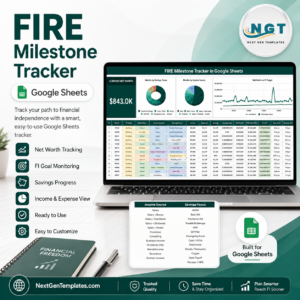
📌 Real-Time KPI Cards – The Overview page displays 5 KPI cards: Overall Completion percentage, Tasks Completed count, Days Remaining until deadline, Total Budget figure, and Budget Variance Savings — all calculated from your project data automatically.Construction Project Timeline in Google Sheets
📌 20+ Charts Across All Pages – This template includes charts for Tasks by Phase, Budget by Phase, Actual Cost by Contractor, Percent Complete by Phase, Variance by Phase, Task Duration by Phase, Task Progress by Month, Completion Percent by Phase, Budget by Contractor, Inspections by Phase, and more. Every chart responds to slicer filters for instant drill-down.Construction Project Timeline in Google Sheets
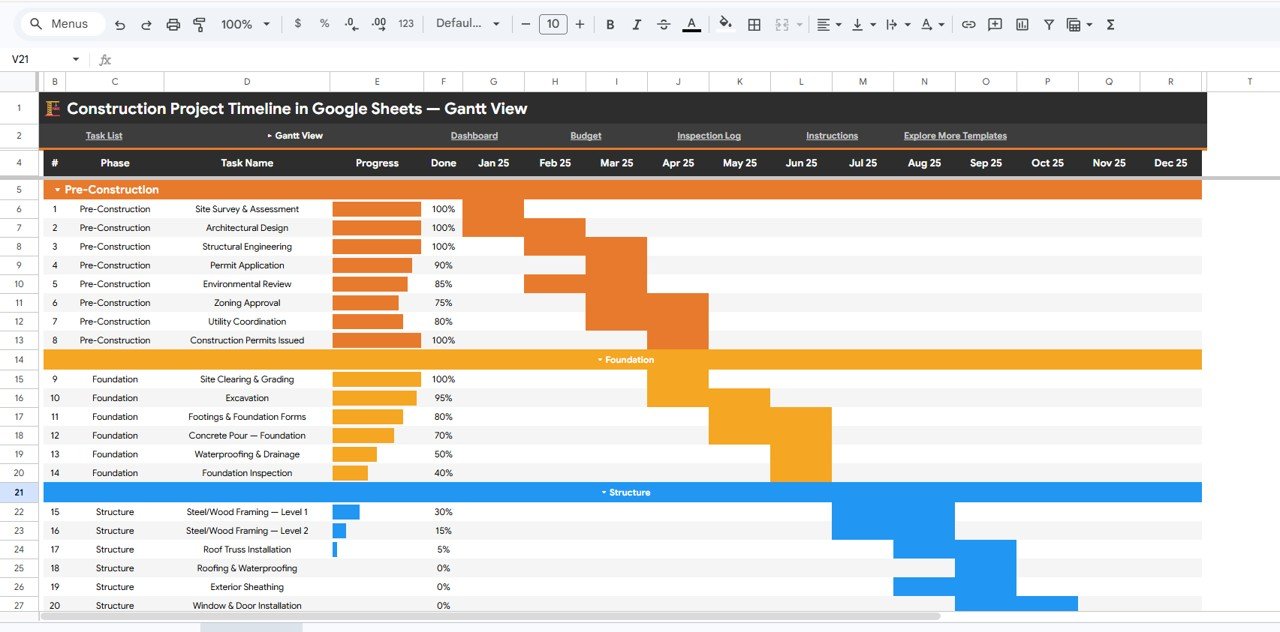
📌 Built-In Gantt Chart – The Gantt View page visualizes your entire project timeline with task durations, phase groupings, monthly progress tracking, and percent-complete indicators — no add-ons or plugins required.
📌 Budget and Change Order Tracking – The Budget page tracks Planned Budget by Phase, Actual Cost by Phase, Variance by Phase, Change Orders by Item, and Net Budget Position by Category — giving you full financial visibility on every construction project.
📌 Inspection Log with Follow-Up Tracking – Record and analyze inspections by phase, result, and inspector. The Inspection Log page includes charts for Inspections by Phase, Inspections by Result, Inspections by Inspector, and Follow-Up Inspections by Phase.
📌 Slicer Filters on Every Page – Filter your entire dashboard by phase, contractor, status, date range, or task type using native Google Sheets slicers. No formulas to edit, no dropdowns to configure.
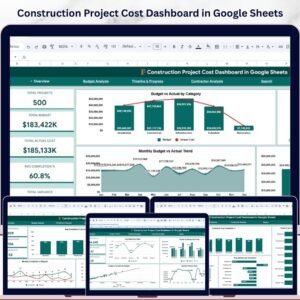
If you manage construction schedules and need a Gantt chart alongside budget tracking, check out the Construction Project Schedule Calendar in Google Sheets and the Construction Project Cost Dashboard in Google Sheets for complementary views of your project data.
📦 What’s Inside the Construction Project Timeline
📄 1 – Overview Page
The Overview page is your project command center. At the top, 5 KPI cards display Overall Completion, Tasks Completed, Days Remaining, Total Budget, and Budget Variance Savings. Below the cards, interactive charts show Tasks by Phase, Budget by Phase, Actual Cost by Contractor, Percent Complete by Phase, and Variance by Phase. Multiple slicers let you filter the entire view by phase, contractor, or status.
 Construction Project Timeline in Google Sheets
📄 2 – Gantt View
The Gantt View page presents your construction schedule visually. Charts include Task Duration by Phase, Task Progress by Month, Project Timeline by Phase, and Percent Complete by Task — making it easy to spot delays and track milestones at a glance.
 Gantt View
📄 3 – Dashboard
The Dashboard page consolidates key project metrics into a single view. Charts cover Completion Percent by Phase, Budget by Phase, Actual Cost by Phase, Tasks by Status, Budget by Contractor, and Actual Cost by Contractor — giving stakeholders a snapshot of project health.
 Dashboard
📄 4 – Budget
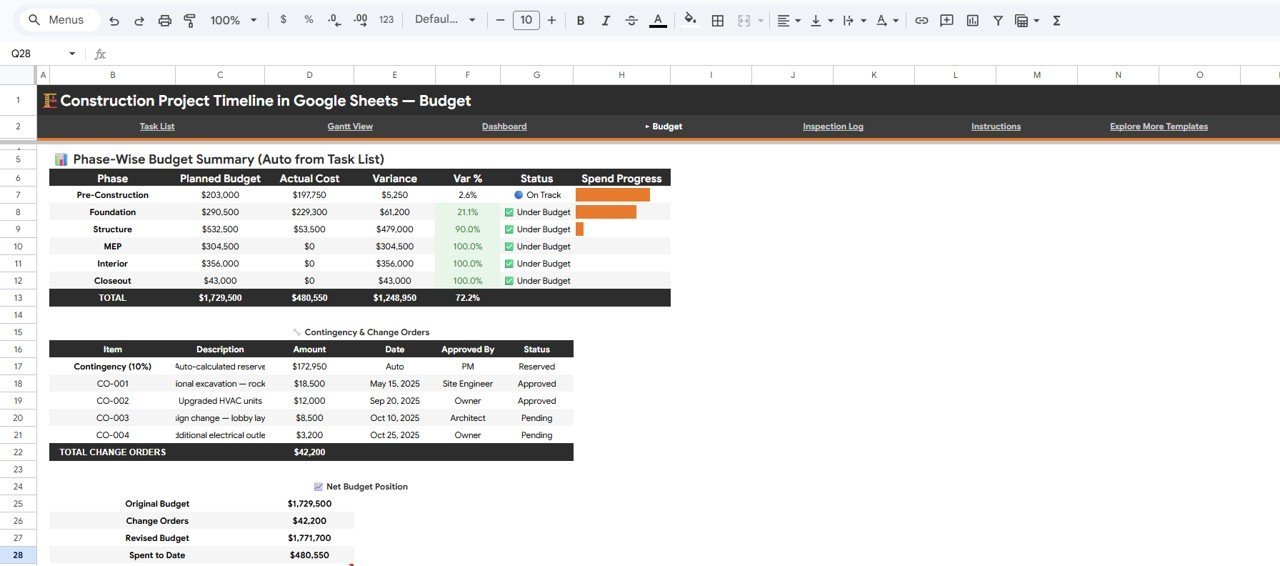
The Budget page provides detailed financial analysis with charts for Planned Budget by Phase, Actual Cost by Phase, Variance by Phase, Change Orders by Item, and Net Budget Position by Category. Track every dollar from planning through completion.
 Budget
📄 5 – Inspection Log
The Inspection Log page tracks quality control across your project. Charts display Inspections by Phase, Inspections by Result, Inspections by Inspector, and Follow-Up Inspections by Phase — ensuring every inspection is documented and follow-ups are tracked.
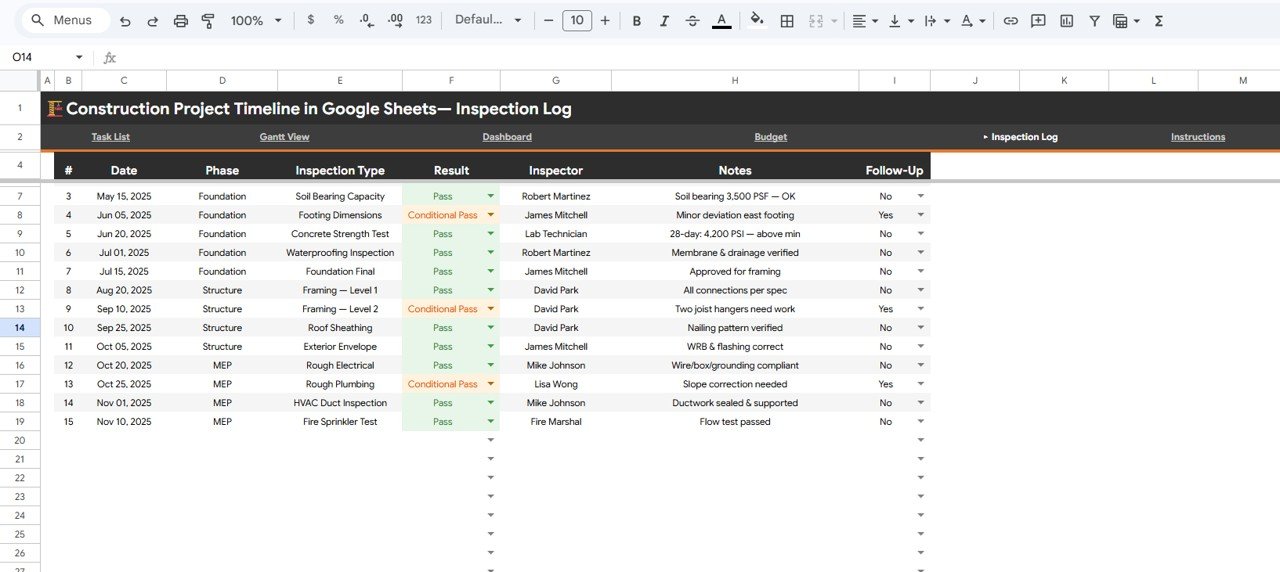 Inspection Log
📊 Construction Project Timeline vs. Microsoft Excel vs. Smartsheet — Where This Fits
| Feature | Construction Project Timeline (Google Sheets) | Microsoft Excel Dashboard | Smartsheet / Monday.com |
|---|---|---|---|
| Cost | $6.99 one-time | $15-30 one-time (template) + Excel license | $9-25 / user / month |
| Platform | Google Sheets (browser-based) | Desktop app required | Cloud SaaS |
| Setup Time | Under 10 minutes | 15-30 minutes | 1-3 hours with onboarding |
| Real-Time Team Collaboration | ✅ Built-in (Google Sheets) | ❌ File sharing only | ✅ Yes |
| Mobile Access | ✅ Google Sheets app | Limited on mobile | ✅ Yes |
| Customizable Fields | ✅ Fully editable | ✅ Fully editable | ✅ With plan limits |
| Built-In Gantt Chart | ✅ Included | Requires manual setup | ✅ Included |
| Inspection Log Module | ✅ Included | Not standard | Add-on required |
| Year-1 Cost (5 Users) | $6.99 total | $80-150 (license + template) | $540-1,500 |
For construction teams that want Gantt charts, budget tracking, and inspection logs without paying monthly SaaS fees, the Construction Project Timeline in Google Sheets sits in the sweet spot.
👥 Who This Template Is For — and Who It’s Not For
✅ This template is built for:
- Construction project managers tracking 5-50 task schedules with budgets under $10M
- General contractors who need a single view of timeline, budget, and inspection status
- Small to mid-size construction firms wanting a free-to-use platform (Google Sheets) with no per-seat licensing
- Owner-builders and renovation managers who need Gantt chart visibility without Smartsheet pricing
❌ This template is NOT for:
- Enterprise construction firms managing 500+ tasks across multiple simultaneous projects with ERP integration
- Teams requiring BIM software integration or automated resource leveling
- Organizations needing SOC 2 compliance, audit trails, and role-based permissions beyond Google Workspace
⚙️ How to Use the Construction Project Timeline
1️⃣ Open the Google Sheets link from the PDF guide included in your download and click “Make a copy” to save it to your Google Drive.
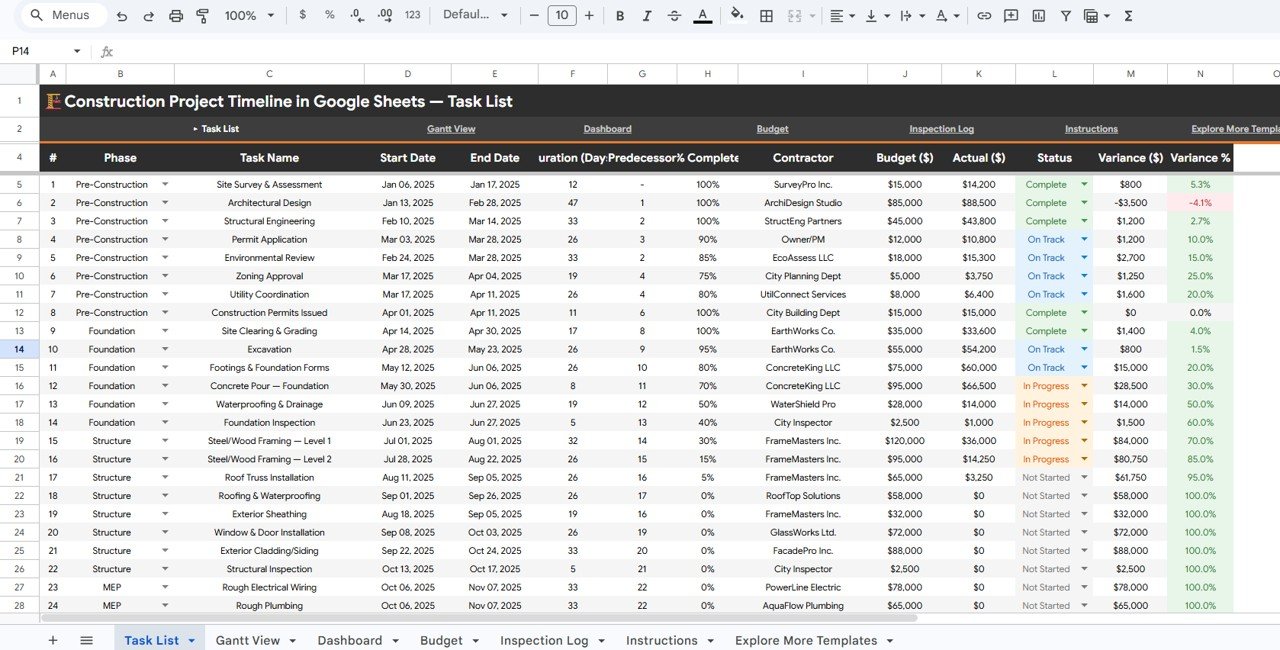
2️⃣ Go to the Data sheet and replace the sample tasks with your actual construction activities, phases, contractors, budgets, and dates.
3️⃣ Check the Overview page — your KPI cards and charts update automatically with your data.
4️⃣ Use the Gantt View to visualize task durations, phase timelines, and monthly progress across your entire project.
5️⃣ Review the Budget page for planned vs actual cost analysis, variance tracking, and change order monitoring.
6️⃣ Log inspections in the Inspection Log sheet and track results, inspectors, and follow-ups with dedicated charts.
7️⃣ Apply slicer filters on any page to drill down by phase, contractor, status, or date range.
💼 Real-World Use Cases
Raj manages a 25-unit residential development. He uses the Construction Project Timeline to track 40 tasks across Foundation, Framing, MEP, and Finishing phases. The Gantt View helps him spot scheduling overlaps between contractors, while the Budget page flags cost overruns before they escalate — saving his firm from a $15,000 change order surprise on the electrical phase.
Maria runs project controls for a mid-size commercial builder. She shares the Google Sheet with her superintendent and 3 subcontractors so everyone sees the same timeline. The Inspection Log replaced her paper-based QC tracking, and the slicer filters let her pull phase-specific reports for weekly owner meetings in under 2 minutes.
Tom is an owner-builder renovating a historic property. With no construction management background, he uses the Overview page KPIs to stay on top of completion percentage and days remaining. The Budget Variance card showed him he was $3,200 under budget on demolition — funds he reallocated to upgraded fixtures.
Looking for more project management tools? Explore the Project Gantt Chart in Google Sheets for a dedicated Gantt template, or browse the full Google Sheets Trackers collection.
❓ Frequently Asked Questions
What KPIs does the Construction Project Timeline track?
The Construction Project Timeline in Google Sheets tracks 5 KPIs: Overall Completion percentage, Tasks Completed count, Days Remaining, Total Budget, and Budget Variance Savings. All metrics update automatically when you replace sample data with your own construction project details.
Does this template include a Gantt chart?
Yes. The Gantt View page includes 4 charts: Task Duration by Phase, Task Progress by Month, Project Timeline by Phase, and Percent Complete by Task. The Gantt chart is built with native Google Sheets features — no plugins, add-ons, or macros needed.
Can I share this with my contractors and subcontractors?
Yes. Since it runs in Google Sheets, you can share it with anyone via a link. Set view-only or edit permissions per user. Real-time collaboration means everyone sees the latest data without emailing files back and forth.
How does this compare to Smartsheet or Monday.com?
The Construction Project Timeline costs $6.99 one-time versus $9-25 per user per month for Smartsheet or Monday.com. For teams of 5, that is $6.99 total versus $540-1,500 per year. This template covers timelines, budgets, and inspections without recurring fees.
How long does setup take?
Setup takes under 10 minutes. Open the Google Sheets link, click Make a Copy, replace the sample data in the Data sheet with your project tasks, and all 5 dashboard pages update automatically. No formulas to configure.
Can I add more tasks or phases?
Yes. The template is fully editable. Add new rows to the Data sheet for additional tasks, phases, or contractors. All charts and KPIs recalculate automatically based on the expanded data range.
Does it work on mobile devices?
Yes. Google Sheets works on any device with the Google Sheets app (iOS and Android) or any mobile browser. Slicer filters and charts display correctly on tablets and phones, making it easy to check project status from the job site.
👤 About the Author
Built by PK — Microsoft Certified Professional with 15+ years of Excel, Google Sheets, and Power BI experience. Founder of NextGenTemplates, reaching 300K+ subscribers across YouTube channels (@PK-AnExcelExpert, @NextGenTemplates, @NeoTechNavigators). Every template is hand-built and tested before release.
🔗 Explore Related Templates
📌 Construction Project Schedule Calendar in Google Sheets – Plan and visualize construction schedules in a calendar format
📌 Construction Project Cost Dashboard in Google Sheets – Deep-dive into cost analytics for construction projects
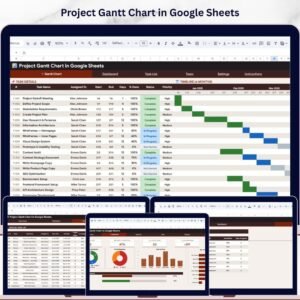
📌 Project Gantt Chart in Google Sheets – Dedicated Gantt chart template for any project type
📌 Project Deliverable Approval Tracker in Google Sheets – Track deliverable approvals and sign-offs
💎 Save 40% — Get all 9 project management templates in the Project Management Pro Bundle →
📖 Click here to read the Detailed Blog Post
Watch the step-by-step video tutorial:
🎥 Visit our YouTube channel for step-by-step video tutorials
👉 YouTube.com/@NextGenTemplates


Reviews
There are no reviews yet.