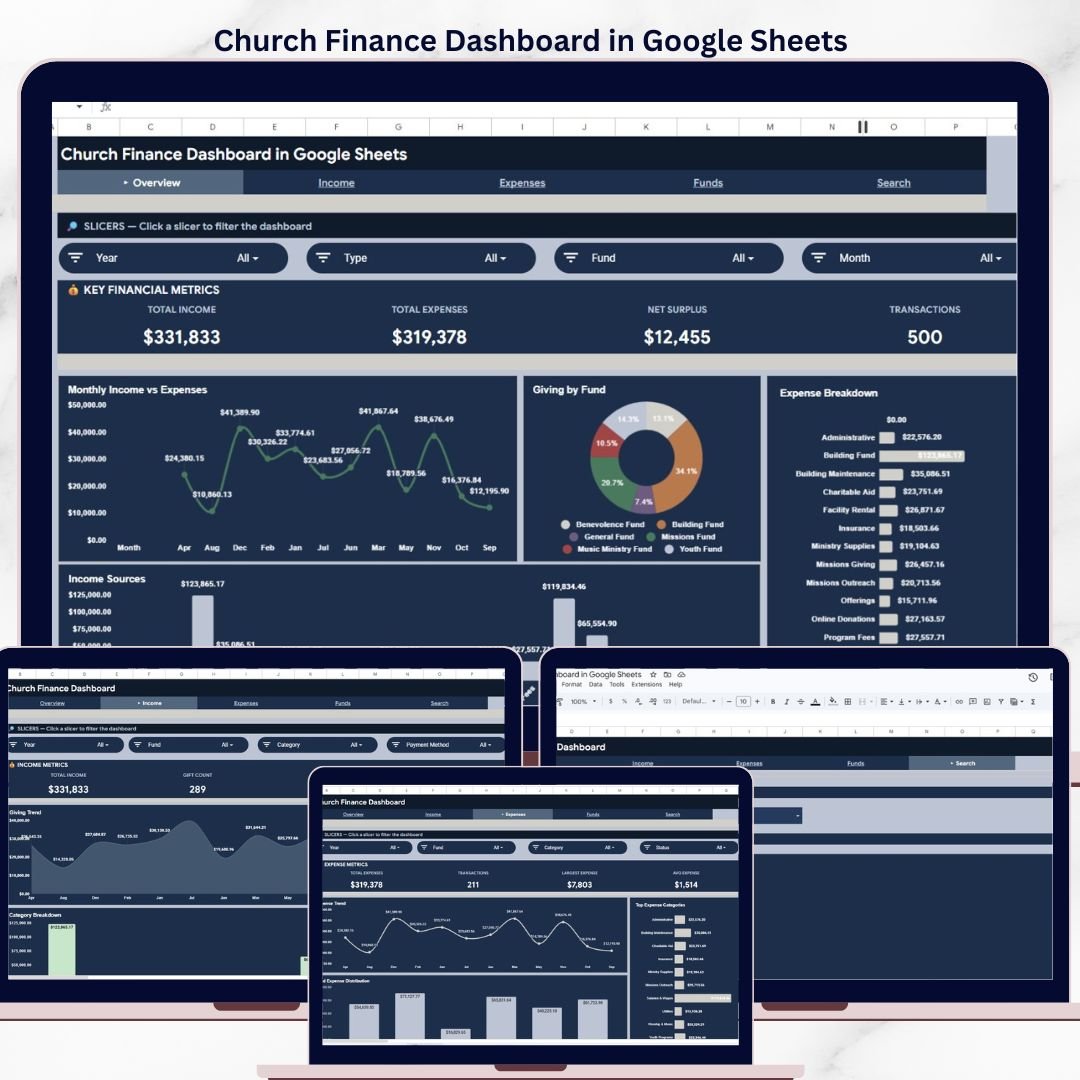
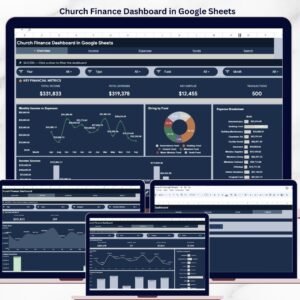
The Church Finance Dashboard in Google Sheets tracks 4 key financial KPIs across 5 interactive sheet tabs, with 10+ pre-built charts and multiple slicer filters for instant data analysis. Setup takes under 10 minutes — just copy the Google Sheet to your Drive, replace the 500 rows of sample data with your own church records, and every chart and KPI card updates automatically.
🌍 Join 8,400+ teams in 40+ countries using NextGenTemplates to replace paid SaaS tools with one-time-purchase Excel, Google Sheets, Power BI, and HTML templates.
✅ Instant download · One-time payment · No subscription · No per-user fees · Lifetime access
🔑 Key Features of Church Finance Dashboard in Google Sheets
This Google Sheets dashboard is built specifically for churches, ministries, and faith-based organizations that need clear financial visibility without expensive church management software. The Church Finance Dashboard in Google Sheets tracks Total Income, Total Expenses, Net Surplus, and total Transactions across 5 dedicated sheet tabs — Overview, Income Analysis, Expense Analysis, Search, and Data.
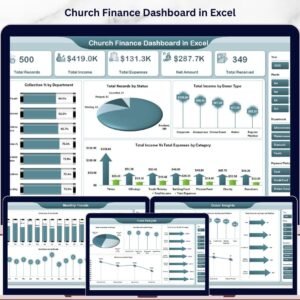
📊 The Overview page displays 4 KPI cards at the top and multiple charts below including Monthly Income vs Expenses, Giving by Fund, Expense Breakdown by Category, and Income Sources by Category. Multiple slicers let you filter the entire dashboard instantly by date, category, fund type, or payment method.
📈 The Income Analysis tab provides deeper insight into giving patterns with Giving Trend by Month, Payment Method Distribution, and Category Breakdown charts. The Expense Analysis tab mirrors this with Expense Trend by Month, Top Expense Categories, and Fund Expense Distribution charts. The Search page lets you look up any individual transaction by selecting a Transaction ID from a dropdown — instantly displaying Date, Type, Category, Fund, Source/Vendor, Description, Amount, Payment Method, and Reference Number.
The Data sheet holds 500 rows of pre-loaded sample data in a structured format ready for your own church records. Every formula, chart, and slicer references this sheet, so replacing the data automatically refreshes the entire dashboard. If you prefer Excel-based church finance tracking, the Church Finance Dashboard in Excel offers pivot table-powered analytics with the same financial structure.
📦 What’s Inside the Church Finance Dashboard in Google Sheets
📋 Overview Sheet – 4 KPI cards (Total Income, Total Expenses, Net Surplus, Transactions) plus Monthly Income vs Expenses chart, Giving by Fund chart, Expense Breakdown by Category chart, and Income Sources by Category chart. Multiple slicers for instant filtering.
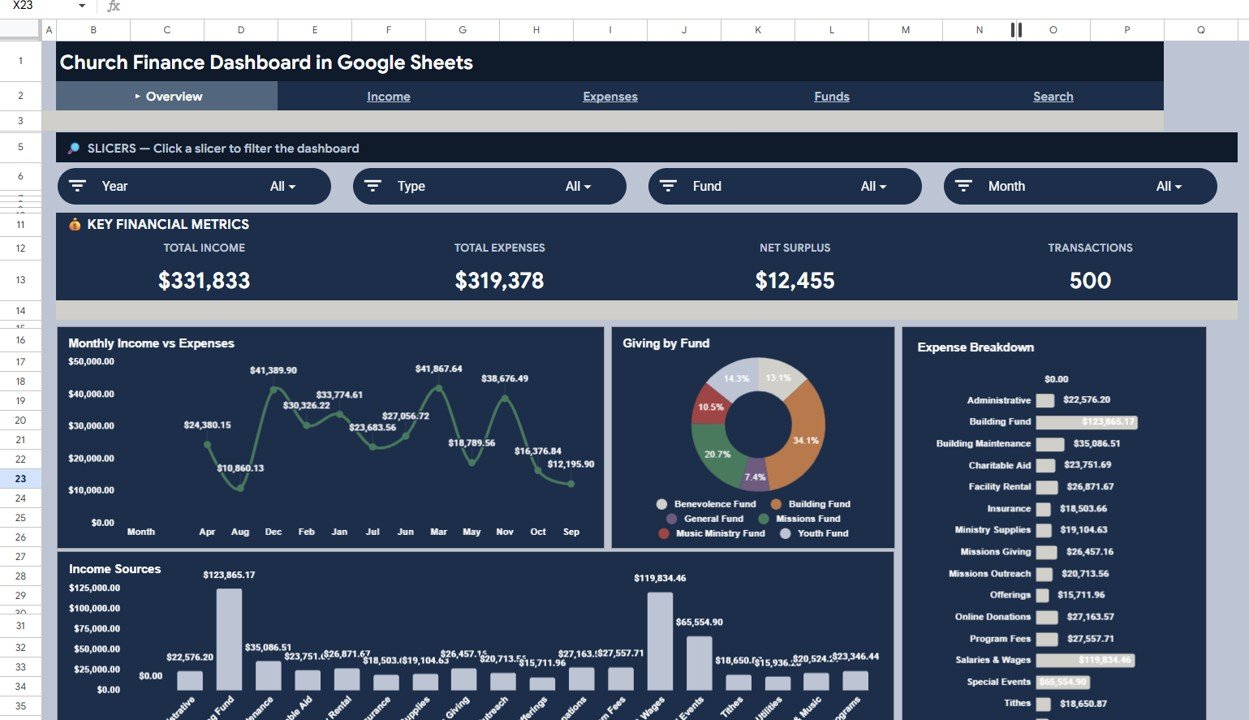 Church Finance Dashboard in Google Sheets
📋 Income Analysis Sheet – Giving Trend by Month shows seasonal donation patterns. Payment Method Distribution reveals how your congregation gives (cash, check, online, bank transfer). Category Breakdown displays income distribution across tithes, offerings, missions, and special collections.
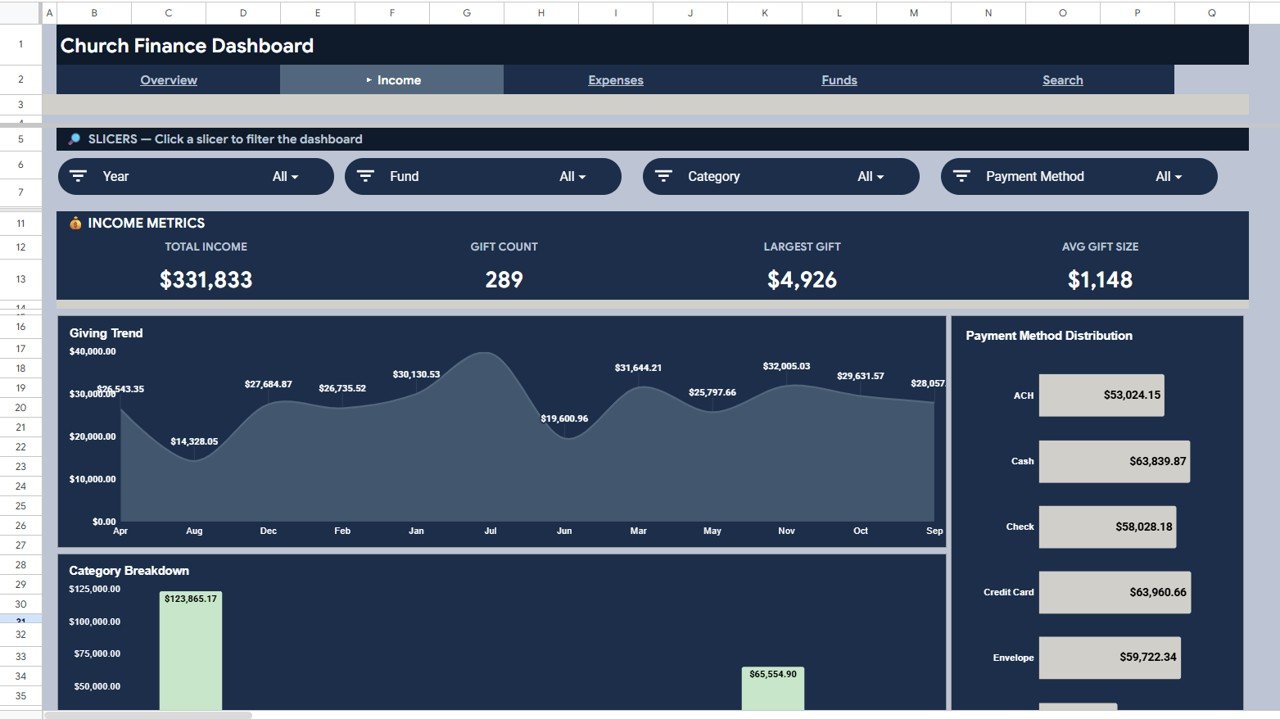 Income Analysis
📋 Expense Analysis Sheet – Expense Trend by Month tracks spending patterns over time. Top Expense Categories identifies your largest cost centers. Fund Expense Distribution shows how different funds allocate their spending.
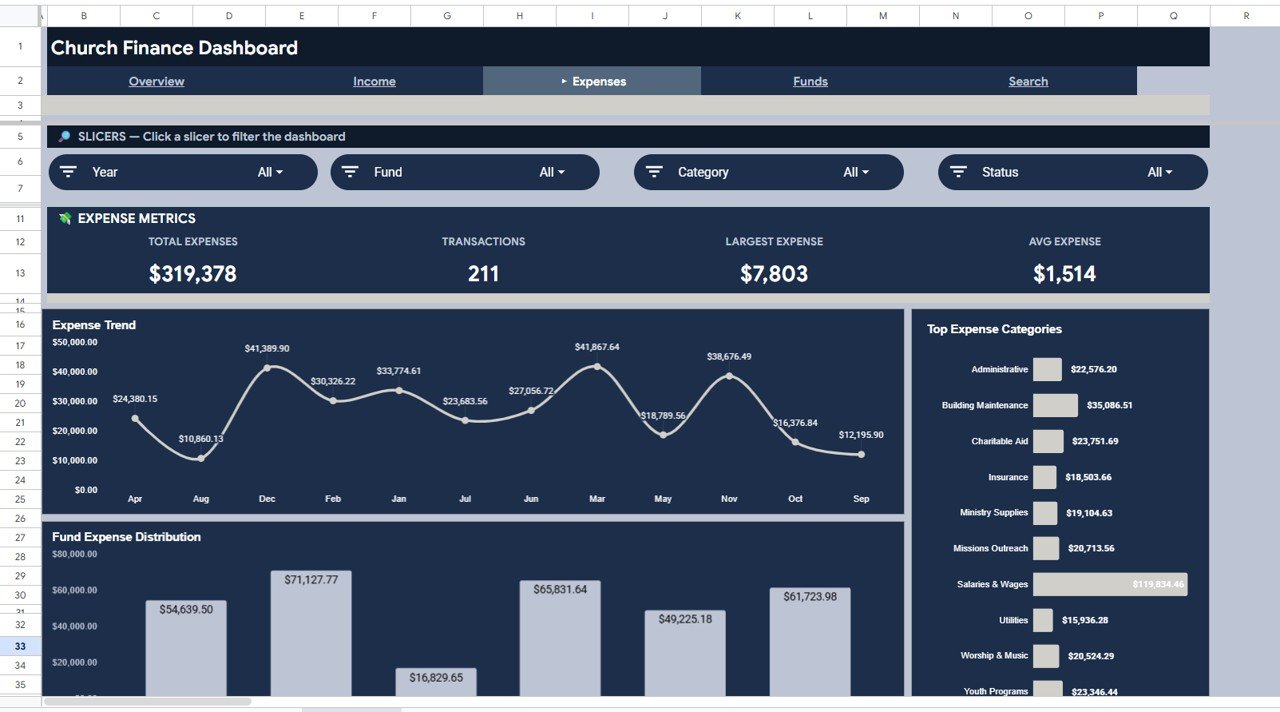 Expense Analysis
📋 Search Sheet – Select any Transaction ID from a dropdown to instantly view all details for that record including Date, Type, Category, Fund, Source/Vendor, Description, Amount, Payment Method, and Reference Number.
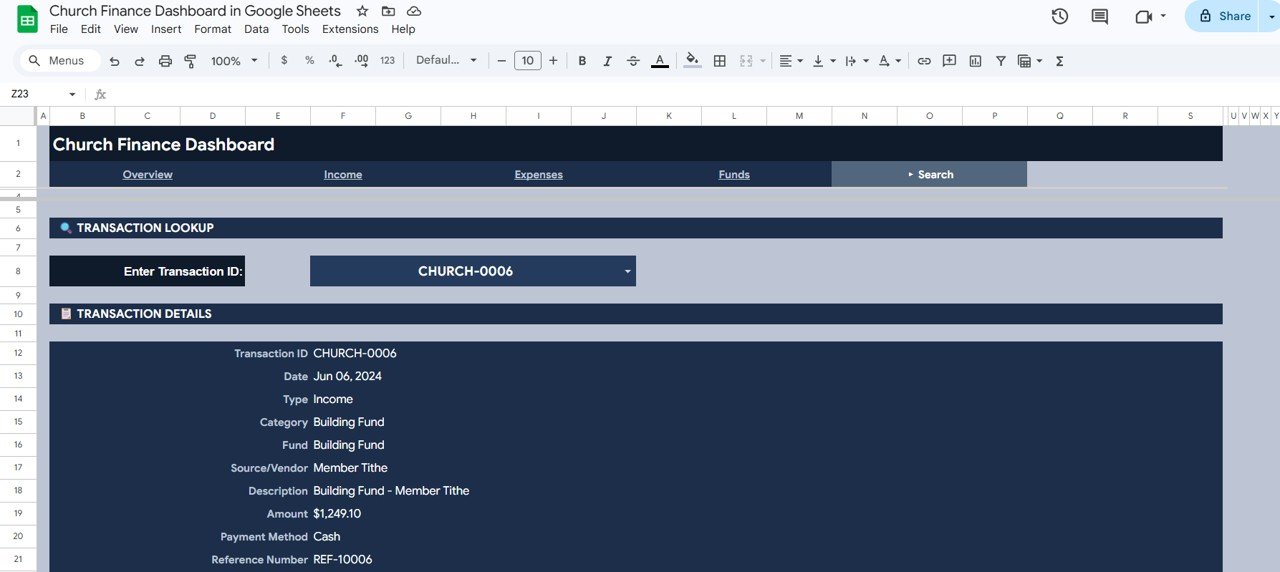 Search Sheet Tab
📋 Data Sheet – 500 rows of realistic sample church finance data. Replace with your own records and every chart updates automatically.
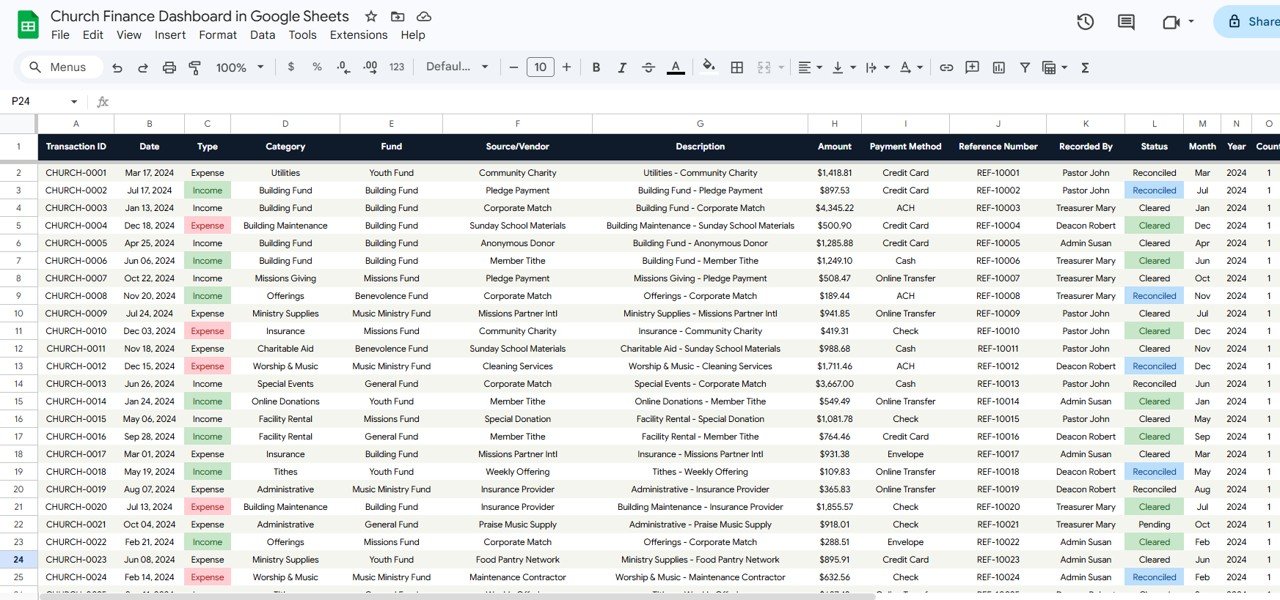 Data Sheet Tab
📊 Church Finance Dashboard in Google Sheets vs. Microsoft Excel vs. Tithe.ly — Where This Fits
| Feature | Church Finance Dashboard in Google Sheets | Microsoft Excel Dashboard | Tithe.ly / Planning Center |
|---|---|---|---|
| Cost | $9.99 one-time | $17.99 one-time (Excel version) | $49–$199/month |
| Platform | Google Sheets (cloud-based) | Microsoft Excel (desktop) | Web-based SaaS |
| Setup Time | Under 10 minutes | Under 10 minutes | 1–3 hours + onboarding |
| Real-Time Collaboration | ✅ Yes — multi-user editing | Limited (OneDrive only) | ✅ Yes |
| Mobile Access | ✅ Google Sheets app | Limited on mobile | ✅ Native app |
| Customizable Fields | ✅ Fully editable formulas | ✅ Pivot tables + formulas | Limited customization |
| Share with Link | ✅ One-click share | Requires OneDrive | Admin-controlled |
| Year-1 Cost (5 users) | $9.99 total | $17.99 total | $588–$2,388 |
| Offline Access | ✅ With Google offline mode | ✅ Full offline | ❌ Requires internet |
For churches that want professional financial analytics without paying $49–$199/month for church management software, the Church Finance Dashboard in Google Sheets sits in the sweet spot.
👥 Who This Template Is For — and Who It’s Not For
✅ This template is built for:
- Church treasurers and finance committees tracking income, expenses, and fund allocations
- Small to mid-size churches (50–2,000 members) that need financial reporting without enterprise software
- Pastors and ministry leaders who want a visual snapshot of church financial health
- Nonprofit administrators managing faith-based organization budgets in Google Sheets
❌ This template is NOT for:
- Mega-churches needing integrated member management, payroll, and accounting in one system
- Organizations requiring automated bank feed imports and reconciliation
- Teams that need donor tax receipt generation and IRS compliance automation
⚙️ How to Use the Church Finance Dashboard in Google Sheets
1. Open the PDF guide included in your download and click the Google Sheets copy link
2. Click “Make a copy” to save the template to your own Google Drive
3. Navigate to the Data sheet tab and review the 500 rows of sample data
4. Replace the sample data with your own church financial records in the same column format
5. Return to the Overview sheet — all KPI cards, charts, and slicers update automatically
6. Use the Income Analysis and Expense Analysis tabs for deeper financial insights
7. Use the Search page to look up individual transactions by Transaction ID
💼 Real-World Use Cases
Pastor David runs a 200-member community church in Atlanta. He uses the Church Finance Dashboard in Google Sheets to present monthly income vs expense reports to his finance committee. The slicer filters let him isolate giving by fund type during quarterly board meetings — showing exactly how tithes, missions, and building fund contributions trend over 12 months — without paying $99/month for Planning Center Giving.
Maria is the treasurer at a bilingual church in Houston. She manages donations from 15+ fundraising events annually. The Income Analysis tab helps her compare payment method preferences (cash vs online giving) and identify which events generate the highest contributions. She shares the Google Sheet with the pastor and two deacons via link, so everyone sees the same data in real time.
James volunteers as the bookkeeper for a small rural church in Ohio. With only 80 members and a tight annual budget, he uses the Expense Analysis tab to track spending against categories like utilities, pastoral salary, and building maintenance. The Search page saves him hours each month when the finance committee asks about specific transactions.
❓ Frequently Asked Questions
What KPIs does the Church Finance Dashboard in Google Sheets track?
The Church Finance Dashboard in Google Sheets tracks 4 key performance indicators: Total Income, Total Expenses, Net Surplus, and total Transactions. These are displayed on the Overview page and further analyzed across Income Analysis, Expense Analysis, and Search sheet tabs with 10+ interactive charts.
Do I need Microsoft Excel to use this template?
No. This template runs entirely in Google Sheets through your web browser. You only need a free Google account and Google Drive. No Excel, no desktop software, and no add-ons required.
Can multiple people access the dashboard at the same time?
Yes. Google Sheets supports real-time multi-user collaboration. Share the sheet with your finance committee, pastor, or board members via a link, and everyone can view or edit simultaneously.
How do I replace the sample data with my own church records?
Go to the Data sheet tab, delete the 500 sample rows, and paste your own church financial records in the same column format. All charts, KPI cards, and slicers on every tab update automatically when the data changes.
How does this compare to Tithe.ly or Planning Center?
Tithe.ly and Planning Center charge $49–$199 per month and include member management, online giving portals, and automated tax receipts. The Church Finance Dashboard in Google Sheets costs $9.99 one-time and focuses specifically on financial analytics and reporting — ideal for churches that already collect donations through other channels and need a visual dashboard.
Can I track donations by fund type like tithes, missions, and building fund?
Yes. The dashboard includes fund-level analysis with Giving by Fund charts on the Overview page, Fund Expense Distribution on the Expense Analysis tab, and slicer filters that let you isolate any fund type across the entire dashboard.
Is this template suitable for nonprofit organizations beyond churches?
Yes. Any faith-based organization, ministry, or nonprofit that tracks income, expenses, and fund allocations can use this template. The data structure accommodates donations, grants, event income, and departmental budgets. For broader nonprofit analytics, explore the Google Sheets Dashboard Templates collection.
👤 About the Author
Built by PK — Microsoft Certified Professional with 15+ years of Excel, Google Sheets, and Power BI experience. Founder of NextGenTemplates, reaching 300K+ subscribers across YouTube channels (@PK-AnExcelExpert, @NextGenTemplates, @NeoTechNavigators). Every template is hand-built and tested before release.
🔗 Explore Related Templates
If you are managing church finances across multiple platforms, explore these related templates from NextGenTemplates:
- Church Finance Dashboard in Excel — Pivot table-powered analytics with slicers and native Excel formulas
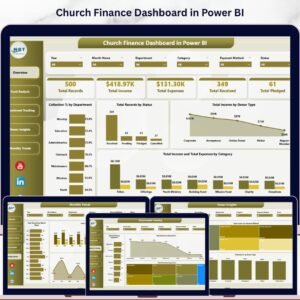
- Church Finance Dashboard in Power BI — Advanced DAX-powered church finance analytics with interactive Power BI visuals
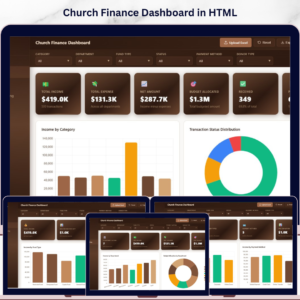
- Church Finance Dashboard in HTML — Browser-based church finance dashboard with 5 interactive pages
- Religious & Faith-Based Organizations KPI Dashboard in Excel — KPI-focused tracking for attendance, donations, and community engagement
Browse all Google Sheets Dashboard Templates and Finance Dashboard Templates.
📖 Click here to read the Detailed Blog Post
Watch the step-by-step video tutorial:
🎥 Visit our YouTube channel for step-by-step video tutorials
👉 YouTube.com/@NextGenTemplates


Reviews
There are no reviews yet.