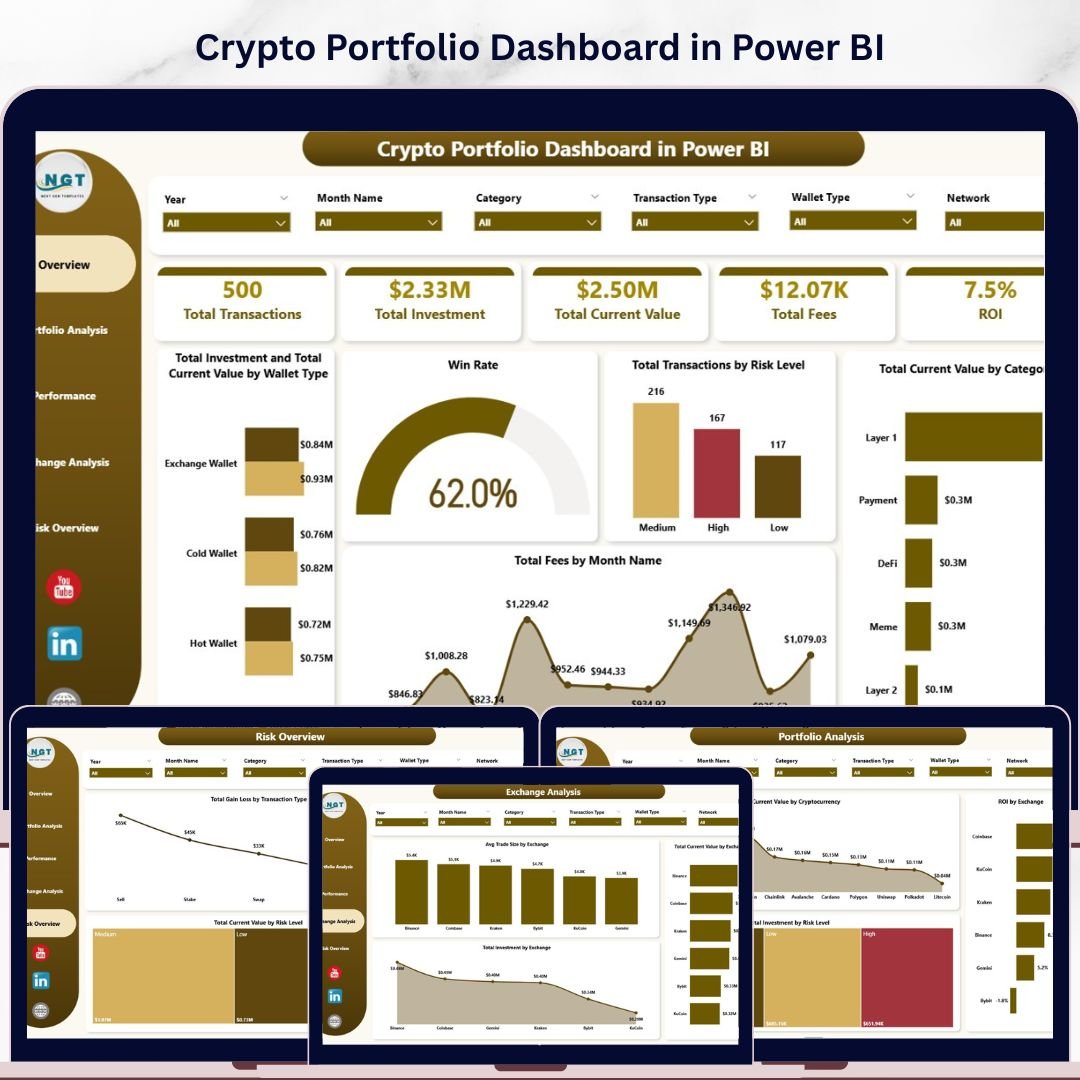


Crypto Portfolio Dashboard in Power BI is a professionally designed cryptocurrency analytics template built for crypto investors, traders, portfolio managers, and finance professionals who want to monitor Total Investment, Total Current Value, Total Fees, ROI, and Win Rate from a single, powerful Power BI dashboard. This template includes 5 interactive dashboard pages covering Overview, Portfolio Analysis, Performance, Exchange Analysis, and Risk Overview — making it one of the most comprehensive Power BI Dashboard Templates available for crypto portfolio management.
Whether you manage a diversified crypto portfolio or track daily trading performance across multiple exchanges, this dashboard transforms raw transaction data into stunning, actionable visual insights. If you have been searching for a reliable, data-driven way to monitor portfolio performance, analyze exchange-level metrics, evaluate risk exposure, and track monthly gain/loss trends, the Crypto Portfolio Dashboard in Power BI is the solution you need. Also explore our Blockchain & Cryptocurrency Dashboard in Power BI for comprehensive blockchain analytics.
Crypto Portfolio Dashboard in Power BI
🔑 Key Features of Crypto Portfolio Dashboard in Power BI
📌 5 Interactive Dashboard Pages – Overview, Portfolio Analysis, Performance, Exchange Analysis, and Risk Overview pages give you a 360-degree view of your entire cryptocurrency portfolio in Power BI.
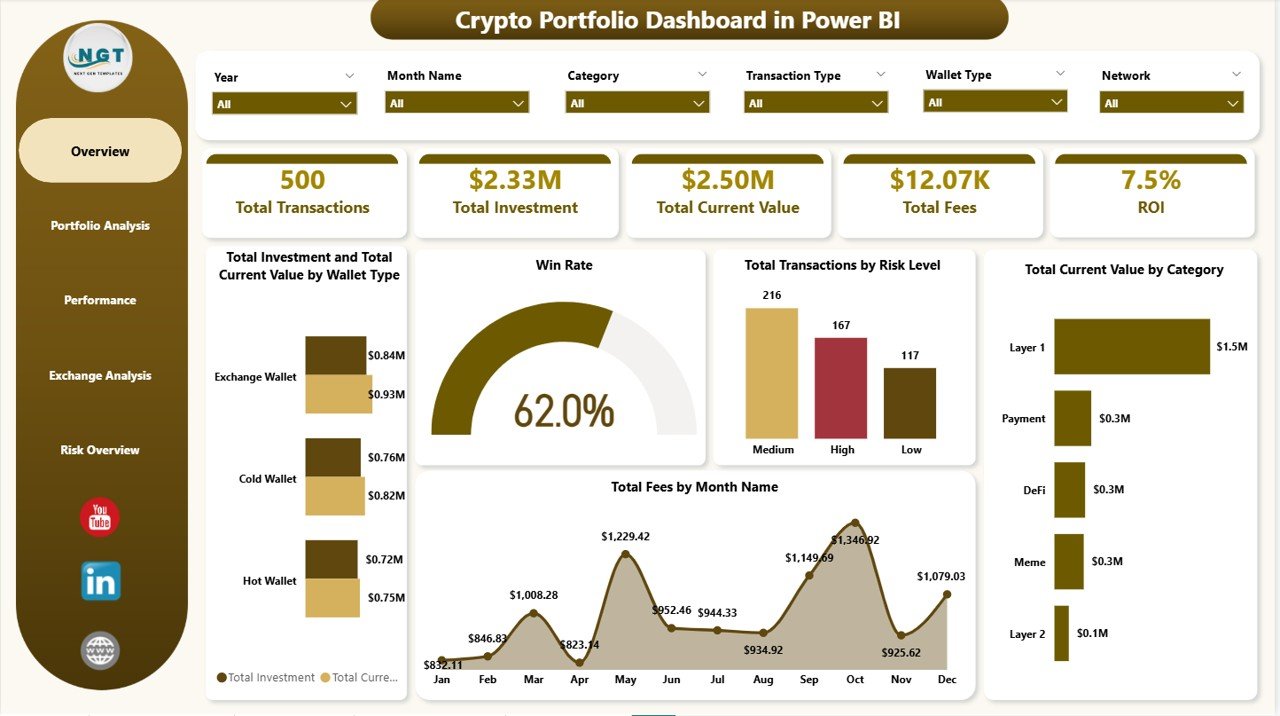
📌 Real-Time KPI Cards – Track Total Transactions, Total Investment, Total Current Value, Total Fees, and ROI at a glance from the Overview page.
📌 Win Rate Analysis – Instantly see your portfolio Win Rate to evaluate how many of your trades are profitable versus losing positions.
📌 Multi-Dimensional Filtering – Use powerful slicers to filter the entire dashboard by cryptocurrency, exchange, wallet type, risk level, transaction status, and date range.
📌 Exchange-Level Deep Dive – Compare Avg Trade Size, Total Current Value, and Total Investment across different exchanges to identify which platforms deliver the best returns.
📌 Risk Exposure Tracking – Analyze Total Gain/Loss by Transaction Type, ROI by Risk Level, and Total Current Value by Risk Level to make smarter investment decisions.
📌 Monthly Trend Analysis – Visualize Total Fees by Month Name and Total Gain/Loss by Month Name to spot seasonal patterns and optimize your trading strategy.
📌 Professional Design – Clean, modern visuals with consistent color coding across all 5 dashboard pages for executive-level presentations and personal portfolio tracking.
📦 What’s Inside the Crypto Portfolio Dashboard in Power BI
This Power BI template delivers 5 purpose-built dashboard pages, each designed to give you unique analytical perspectives on your cryptocurrency investments.
📊 Overview Page: The command center of your crypto portfolio. At the top, KPI cards display Total Transactions, Total Investment, Total Current Value, Total Fees, and ROI. Below, interactive charts show Total Investment and Total Current Value by Wallet Type, Win Rate visualization, Total Transactions by Risk Level, Total Current Value by Category, and Total Fees by Month Name. Multiple slicers let you filter and drill down instantly.
Crypto Portfolio Dashboard in Power BI
📊 Portfolio Analysis Page: Dive deeper into your holdings with Total Current Value by Cryptocurrency, ROI by Exchange, and Total Investment by Risk Level. This page helps you understand which coins and exchanges are delivering the strongest returns. Explore similar analytics in our Blockchain & Cryptocurrency KPI Dashboard in Power BI.
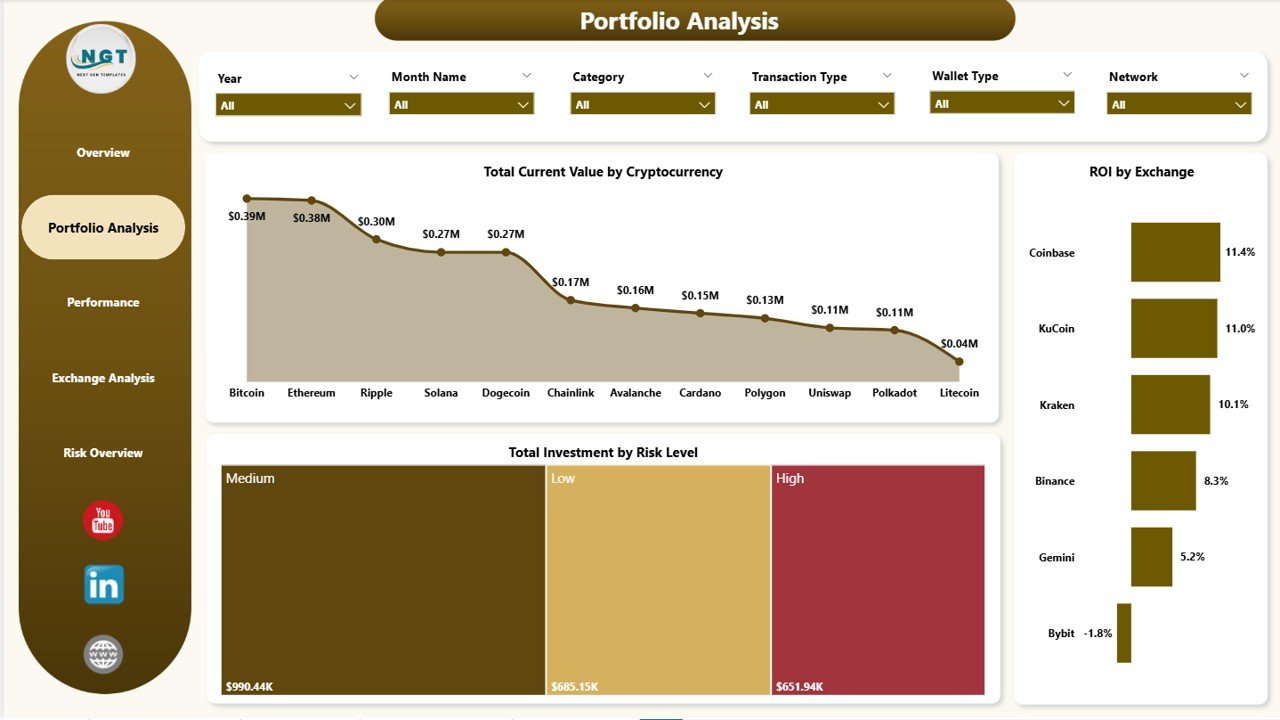
Portfolio Analysis
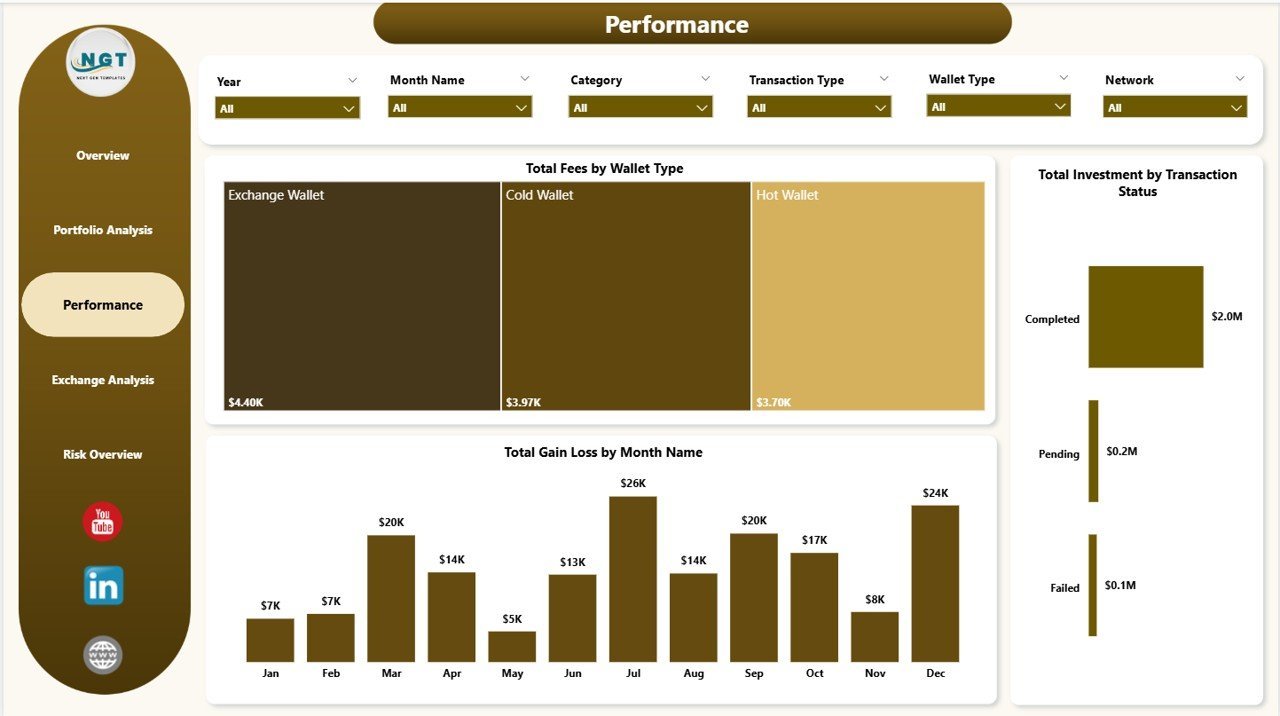
📊 Performance Page: Monitor cost efficiency and profitability trends with Total Fees by Wallet Type, Total Investment by Transaction Status, and Total Gain Loss by Month Name. Identify which months and transaction types generate the most profit or loss.

Performance
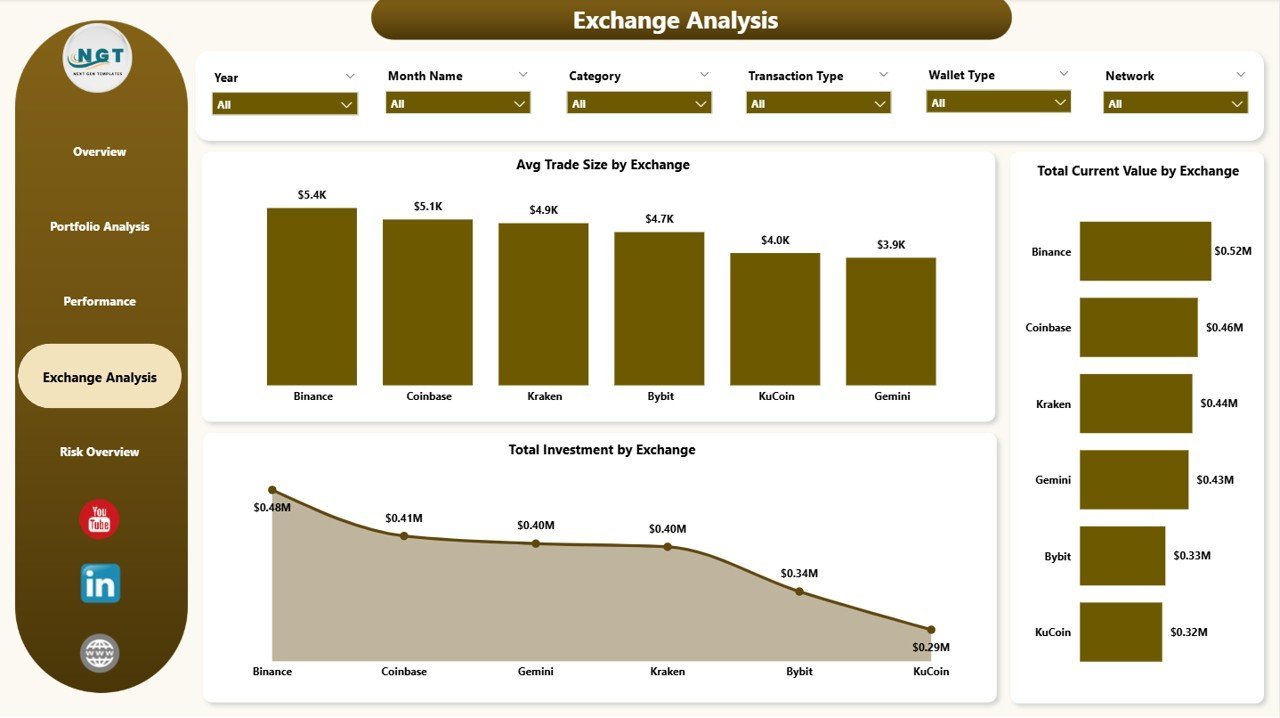
📊 Exchange Analysis Page: Compare exchange-level metrics including Avg Trade Size by Exchange, Total Current Value by Exchange, and Total Investment by Exchange. Determine which trading platforms are giving you the best value and highest portfolio allocation.
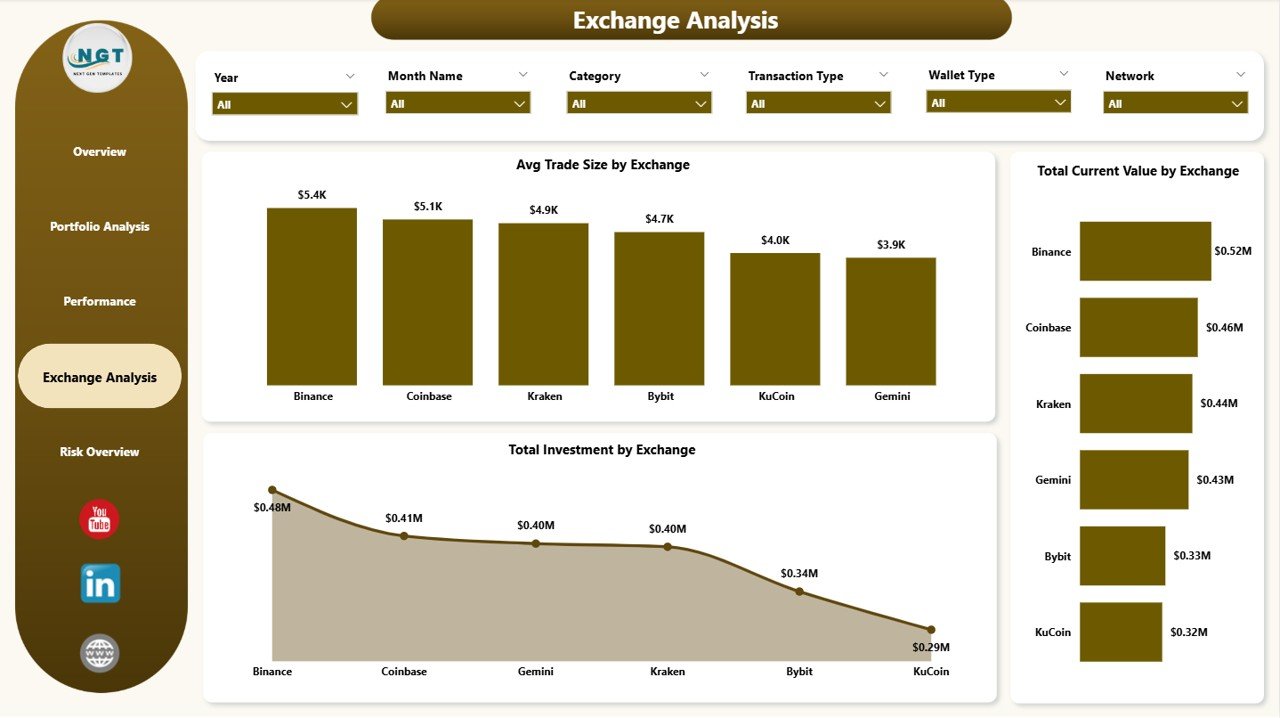
Exchange Analysis
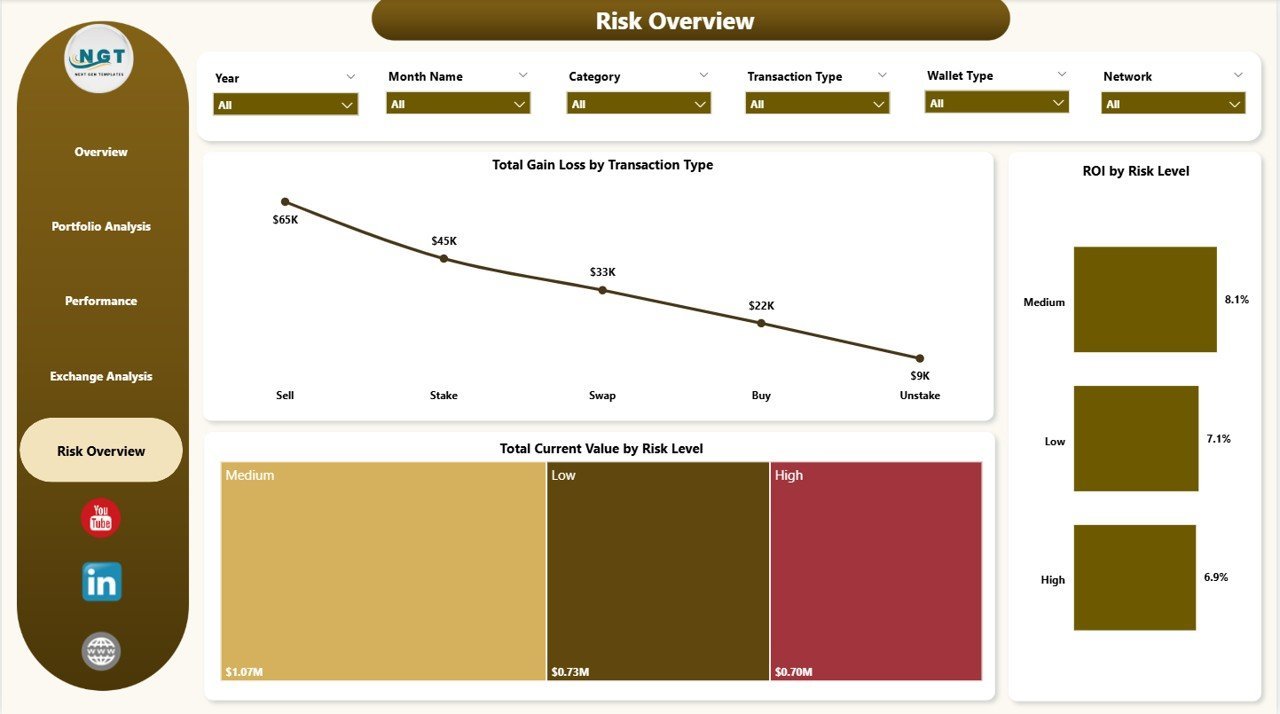
📊 Risk Overview Page: Evaluate your portfolio risk profile with Total Gain Loss by Transaction Type, ROI by Risk Level, and Total Current Value by Risk Level. This page is essential for understanding how risk exposure impacts your overall crypto returns.

Risk Overview
⚙️ How to Use the Crypto Portfolio Dashboard in Power BI
1️⃣ Download and unzip the template file after purchase.
2️⃣ Open the .pbix file in Power BI Desktop (free download from Microsoft).
3️⃣ Navigate to the data model and replace the sample dataset with your own crypto transaction data.
4️⃣ Refresh the data and all 5 dashboard pages — Overview, Portfolio Analysis, Performance, Exchange Analysis, and Risk Overview — will update automatically with your real portfolio metrics.
5️⃣ Use the built-in slicers and filters to drill down into specific cryptocurrencies, exchanges, risk levels, and time periods.
👥 Who Can Benefit from This Crypto Portfolio Dashboard in Power BI
🔹 Crypto Investors & Traders – Track portfolio performance, ROI, and win rates across multiple exchanges and cryptocurrencies.
🔹 Portfolio Managers – Monitor client portfolios with professional-grade visuals and risk analysis dashboards.
🔹 Financial Analysts – Analyze exchange-level performance, fee structures, and investment allocation patterns.
🔹 Finance Students & Educators – Learn Power BI data visualization using real-world crypto market data and KPI tracking.
🔹 Fintech Startups – Use as a foundation for building client-facing crypto analytics reporting tools.
❓ Frequently Asked Questions
What KPIs does the Crypto Portfolio Dashboard in Power BI track?
The Crypto Portfolio Dashboard in Power BI tracks 5 key metrics: Total Transactions, Total Investment, Total Current Value, Total Fees, and ROI. It also includes Win Rate analysis and gain/loss tracking by month and transaction type across all 5 dashboard pages.
Do I need Power BI Pro to use this crypto dashboard template?
No. You only need the free Power BI Desktop application from Microsoft to open and use this template. Power BI Pro is only required if you want to publish and share reports online with your team.
Can I connect this dashboard to live crypto exchange data?
Yes. Power BI supports connections to APIs, Excel files, SQL databases, and web data sources. You can replace the sample data with a live API connection to exchanges like Binance, Coinbase, or Kraken for real-time portfolio tracking.
What is the best Power BI template for tracking crypto investments?
The Crypto Portfolio Dashboard in Power BI from NextGenTemplates is one of the best options available. It includes 5 dedicated analysis pages covering portfolio overview, performance, exchange analysis, and risk assessment — all in a single professionally designed .pbix file.
How do I replace the sample data with my own cryptocurrency data?
Open the .pbix file in Power BI Desktop, go to Transform Data in the Home ribbon, and update the data source to point to your own Excel file, CSV, or database containing your crypto transaction records. Once refreshed, all charts and KPIs update automatically.
🔗 Explore Related Templates
🔹 Blockchain & Cryptocurrency Dashboard in Power BI – Comprehensive blockchain analytics with transaction tracking and network analysis.
🔹 Blockchain & Cryptocurrency KPI Dashboard in Power BI – KPI-focused scorecard for cryptocurrency performance monitoring.
🔹 Net Worth Tracker in Excel – Track your overall net worth including crypto, real estate, stocks, and liabilities.
📖 Click here to read the Detailed Blog Post
🎥 Visit our YouTube channel to learn step-by-step video tutorials
👉 YouTube.com/@NextGenTemplates
Watch the step-by-step video tutorial:
YouTube


Reviews
There are no reviews yet.