


Key Features of Account Management KPI Dashboard in Google Sheets
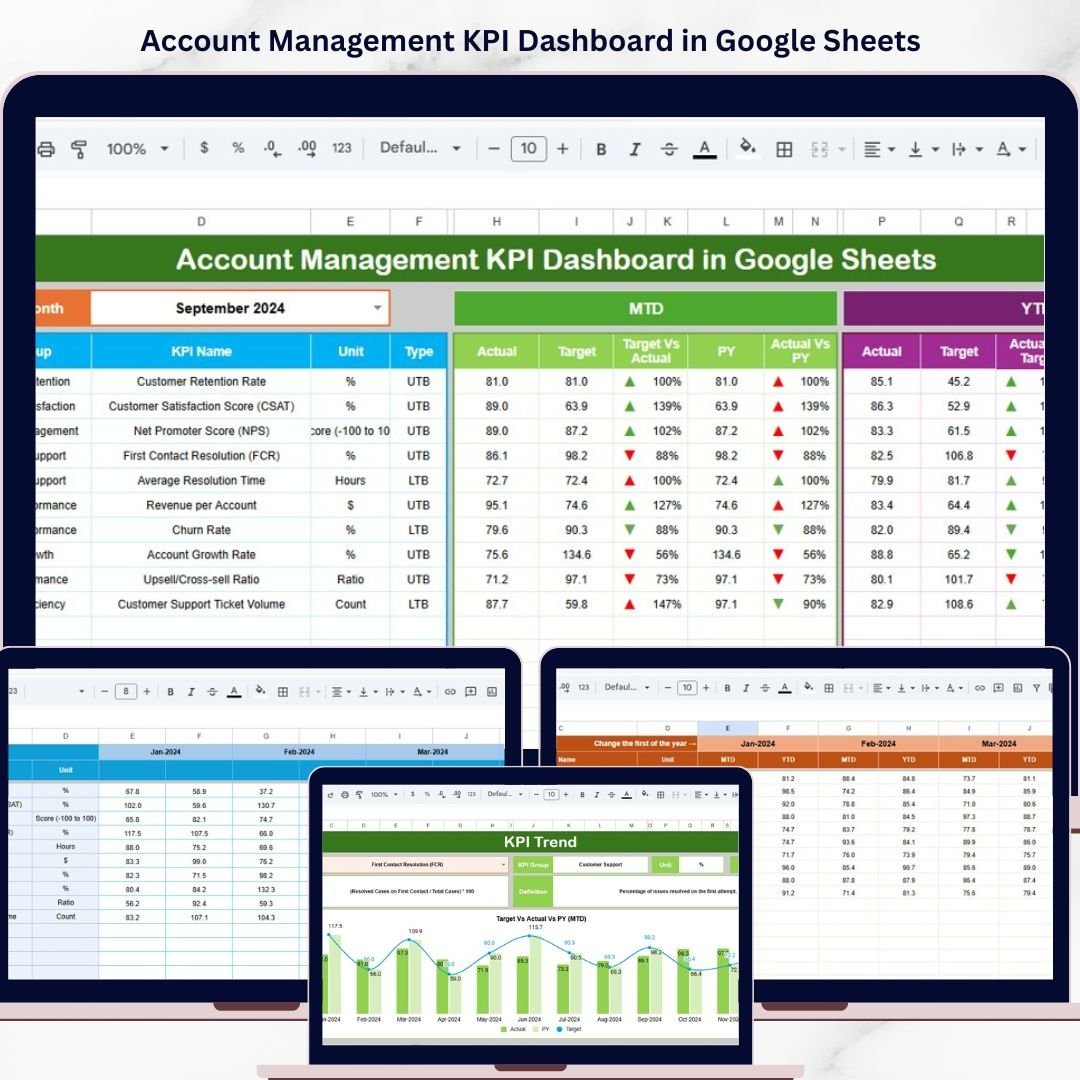
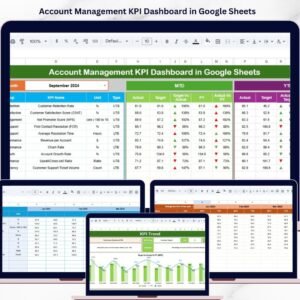
Unlock the power of data-driven decision-making with our Account Management KPI Dashboard in Google Sheets. This ready-to-use digital template is designed to streamline your account management process, helping you track, analyze, and optimize your key performance indicators effortlessly. Featuring 6 comprehensive worksheets, this dashboard allows you to monitor monthly and yearly performance, compare targets against actuals, and visualize trends with dynamic charts and conditional formatting.
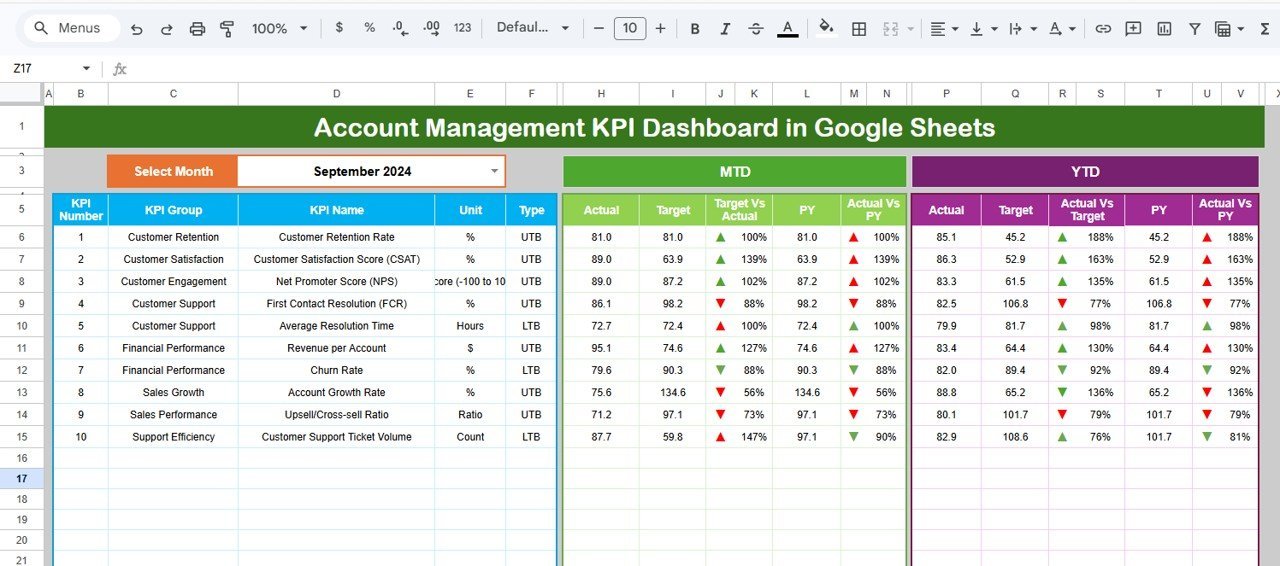
Customize your dashboard by selecting the month from an intuitive drop-down menu, instantly updating your MTD (Month-to-Date) and YTD (Year-to-Date) figures along with comparisons to previous year data. Conditional formatting highlights your progress with clear up and down arrows, making it easy to identify areas of success or improvement at a glance.
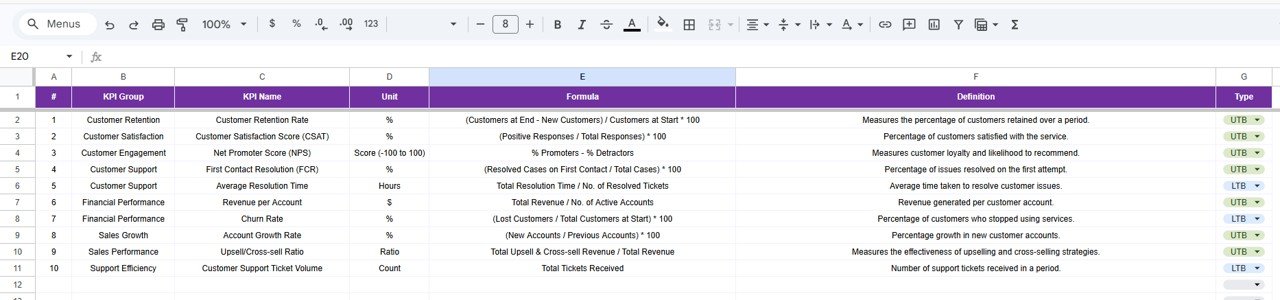
From detailed KPI trends to input sheets for actual, target, and previous year numbers, this dashboard centralizes your data for a holistic and interactive experience. The KPI Definition sheet helps you understand each metric with clear definitions, formulas, and KPI types (Lower the Better or Upper the Better), ensuring that even complex data is accessible and actionable.
What’s Inside the Account Management KPI Dashboard in Google Sheets
Our dashboard includes six functional worksheets designed for seamless account management:
📊 Dashboard Sheet: The main overview that displays MTD and YTD actuals, targets, previous year data, and visual conditional formatting for quick insights.
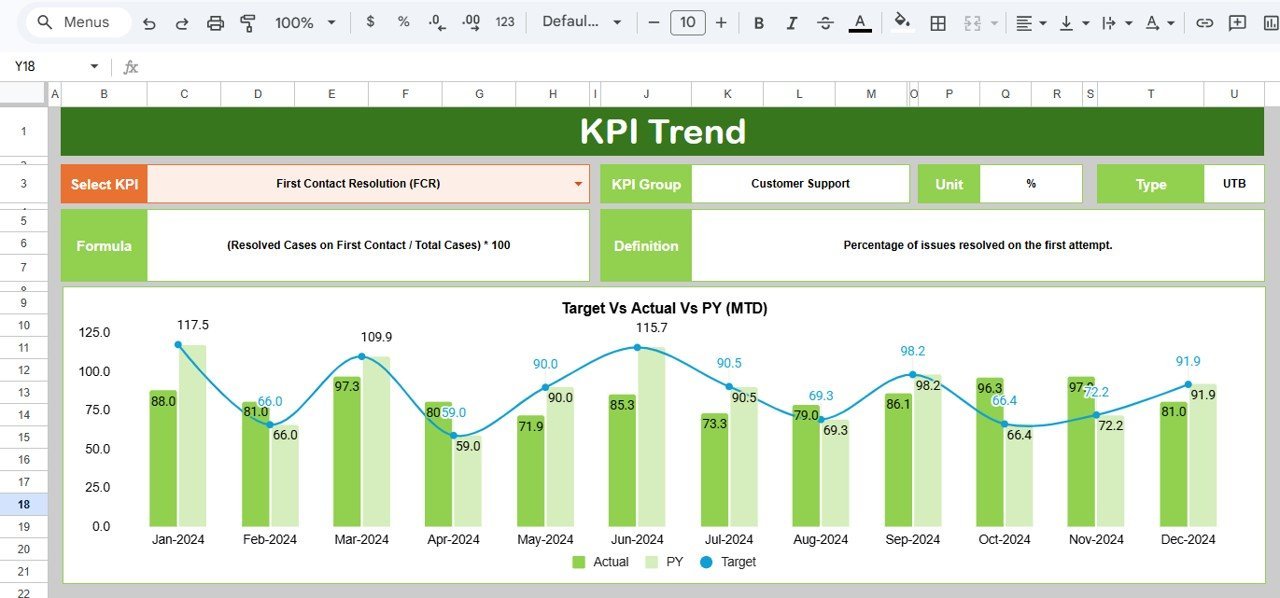
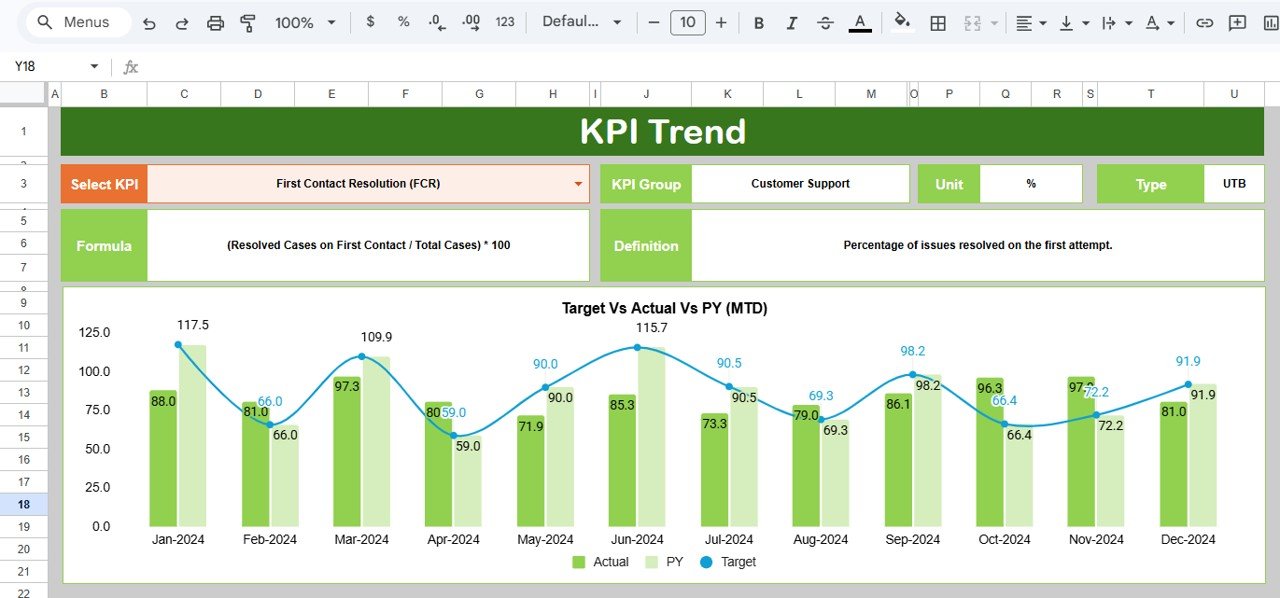
📈 KPI Trend Sheet: Select any KPI to view detailed trends with charts comparing actual, target, and previous year performance over time.
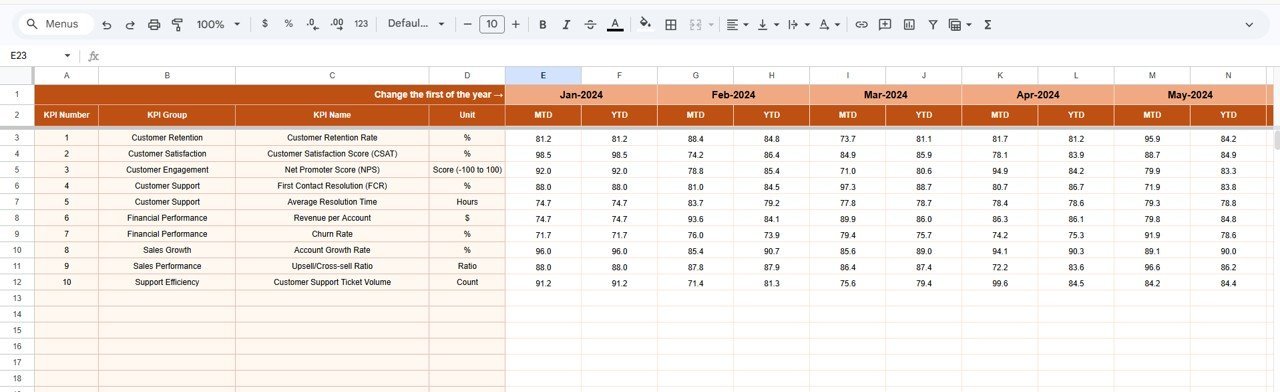
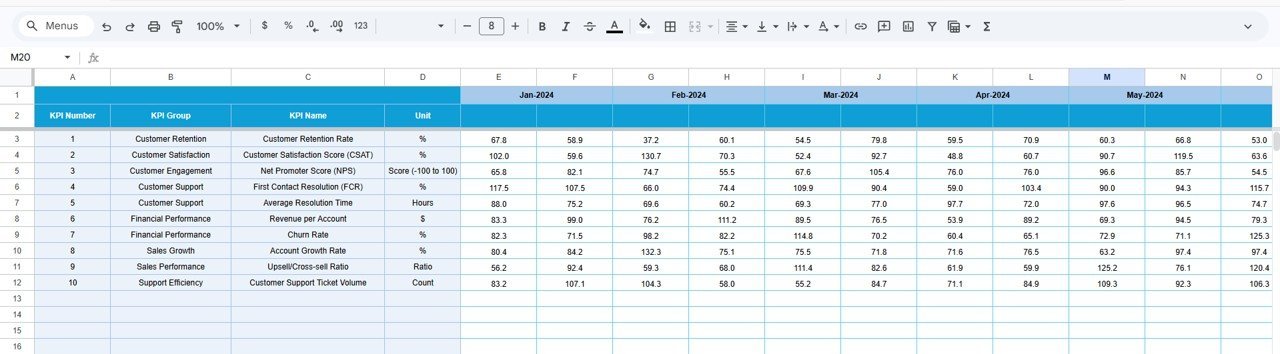
📝 Actual Numbers Input Sheet: Enter your real monthly and yearly figures easily, with month selection flexibility.
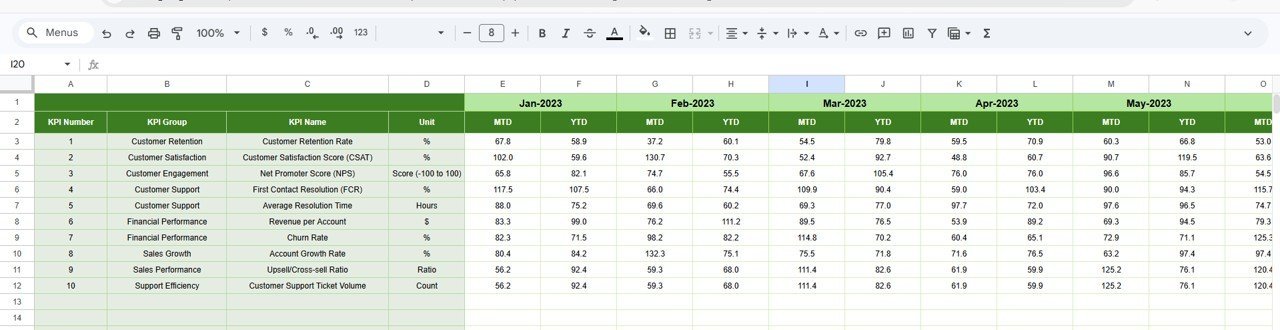
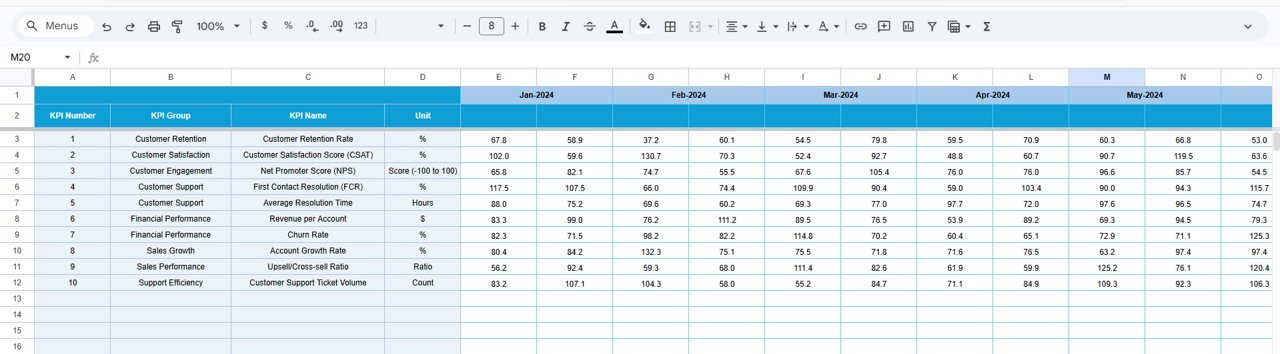
🎯 Target Number Input Sheet: Set your MTD and YTD targets per KPI to measure progress effectively.
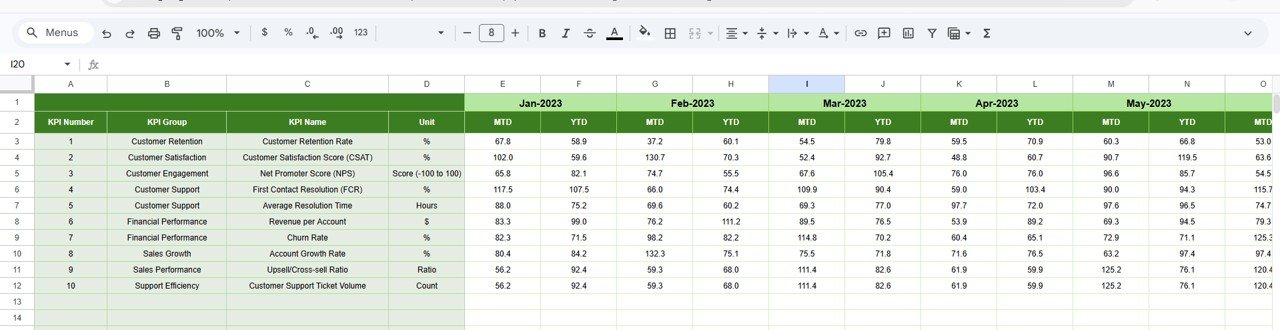
📅 Previous Year Number Sheet: Input prior year’s data for accurate year-over-year comparisons.
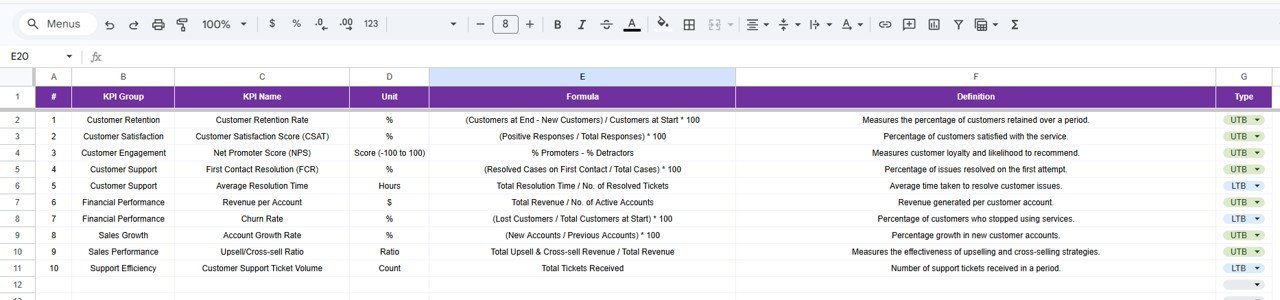
📚 KPI Definition Sheet: Understand each KPI by name, group, unit, formula, and type (LTB or UTB), making data interpretation simple.
How to Use the Account Management KPI Dashboard in Google Sheets
Getting started with this dashboard is straightforward and user-friendly:
🔹 Choose the month on the dashboard sheet to instantly update all KPI data.
🔹 Input your actual numbers for MTD and YTD on the Actual Numbers Input sheet, setting the year’s starting month for accurate tracking.
🔹 Enter your target goals in the Target Number Input sheet to benchmark performance.
🔹 Fill in previous year data for relevant months to enable clear year-over-year comparisons.
🔹 Use the KPI Trend sheet to select KPIs and review performance trends with interactive charts.
🔹 Refer to the KPI Definition sheet anytime to clarify KPI meanings, measurement units, and whether a higher or lower value indicates better performance.
This template requires no coding skills-simply input your data and watch the dashboard dynamically visualize your account management performance.
Who Can Benefit from This Account Management KPI Dashboard in Google Sheets
This dashboard is perfect for a wide range of professionals and teams looking to improve their account management efficiency and insights:
👨💼 Account Managers seeking to monitor client performance and engagement metrics accurately.
📊 Sales Teams aiming to track key sales KPIs and compare targets versus actuals in real-time.
📈 Business Analysts who require a customizable and visual tool for KPI analysis and reporting.
🏢 Small and Medium Enterprises (SMEs) wanting an affordable, easy-to-use solution for performance tracking without complex software.
💼 Consultants & Freelancers managing multiple client accounts and requiring a professional dashboard to showcase results.
🧑💻 Finance & Operations Teams needing clear visibility of account-related metrics to drive strategic decisions.
Empower your team, save time, and increase productivity with this powerful Google Sheets KPI Dashboard tailored specifically for account management.
Account Management KPI Dashboard in Google Sheets
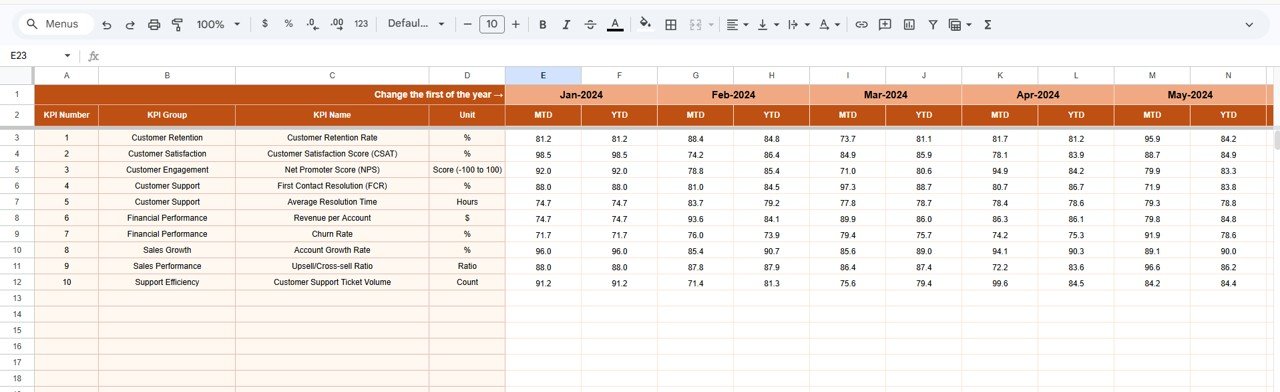
KPI Trend Sheet
Actual Numbers Input Sheet
Target Number Input Sheet
Previous Year Number Input Sheet
Click here to read the Detailed blog post.
Visit our YouTube channel to learn step-by-step video tutorials.
Compatibility and Requirements
- Works in Google Sheets. You need a free Google account and a web browser.
- You pick the month from a dropdown on the Dashboard sheet. Google explains dropdowns in Create an in-cell dropdown list.
Frequently Asked Questions
Which sheets are included?
Six sheets: Dashboard, KPI Trend, Actual Numbers Input, Target Number Input, Previous Year Number and KPI Definition.
How do I update the dashboard?
Enter your MTD and YTD figures on the Actual Numbers Input sheet and your goals on the Target Number Input sheet. Then choose a month on the Dashboard sheet and every figure updates.
Can I compare this year with last year?
Yes. Add last year’s figures to the Previous Year Number sheet and the Dashboard shows them next to your actuals and targets.
How do I see the trend for one KPI?
Open the KPI Trend sheet and select a KPI. Charts compare actual, target and previous year performance over time.
Is there an Excel version?
Yes. See the Account Management KPI Dashboard in Excel.
Related Finance and Account Templates
- Account Management KPI Dashboard in Excel: the same dashboard in Excel
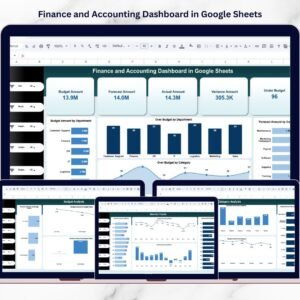
- Finance and Accounting Dashboard in Google Sheets: a finance view in Google Sheets
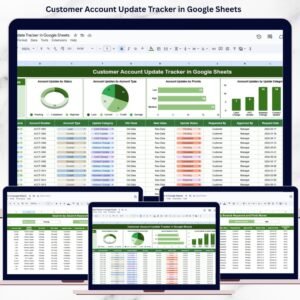
- Customer Account Update Tracker in Google Sheets: track changes to customer accounts
- Bank Account Balance Tracker in Google Sheets: follow account balances
- Finance & Accounting Command Center: 8 finance templates in one download
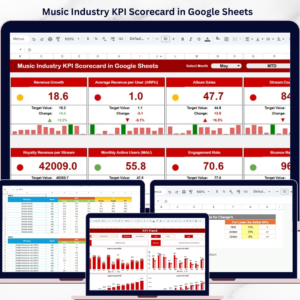
Browse all Google Sheets KPI dashboards.






Reviews
There are no reviews yet.