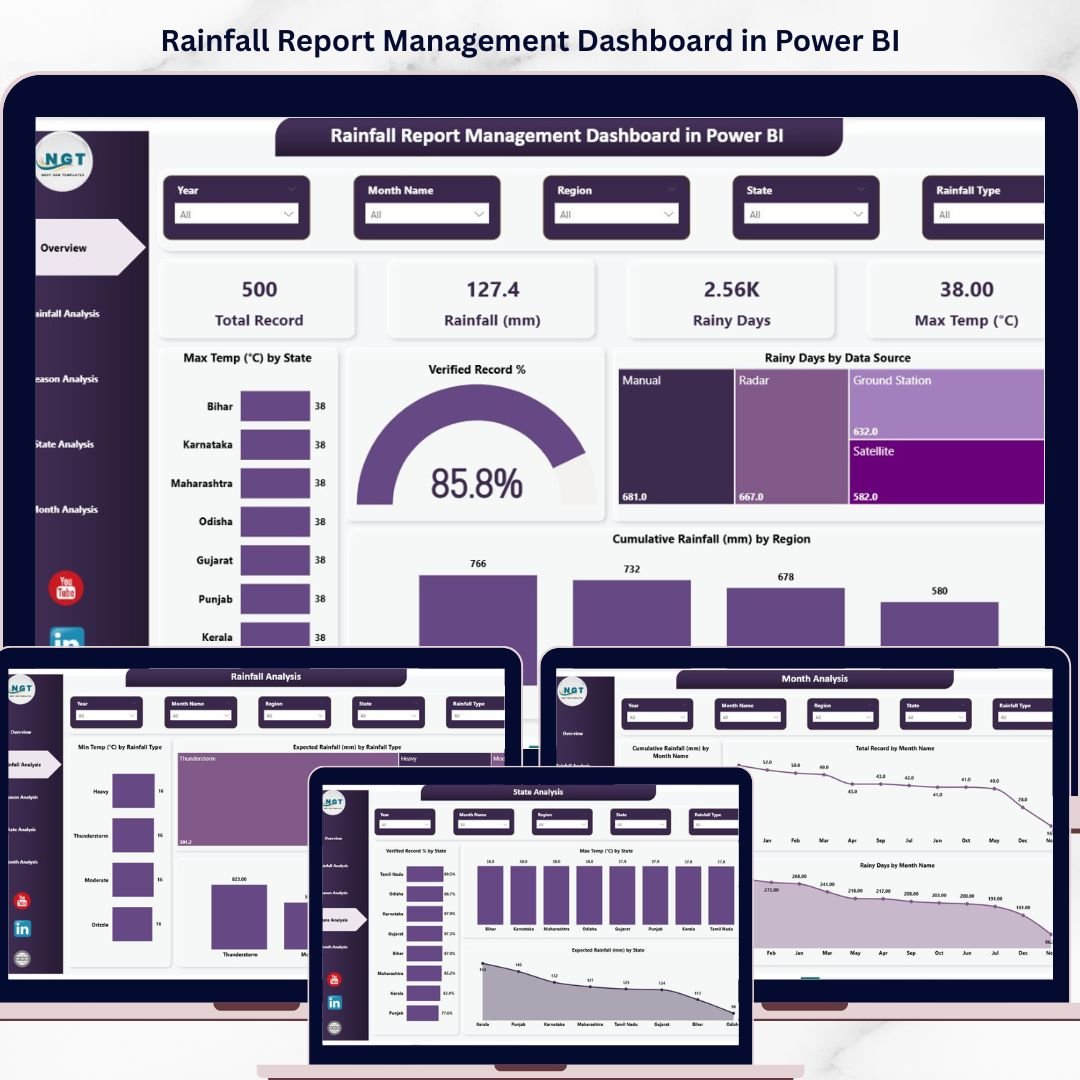
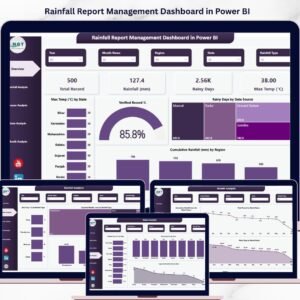
Tired of manually compiling scattered rainfall data into messy reports? The Rainfall Report Management Dashboard in Power BI is your all-in-one solution for tracking, analyzing, and visualizing precipitation data across regions, seasons, and states — all in one sleek, interactive dashboard. Rainfall Report Management Dashboard in Power BI Whether you are a meteorologist, environmental analyst, agricultural planner, or government agency, this Power BI template gives you the clarity and control you need to make smarter, data-driven decisions about rainfall patterns.
🔑 Key Features of Rainfall Report Management Dashboard in Power BI
🌧️ 5 Fully Interactive Dashboard Pages – Each page is purpose-built to give you a different lens on your rainfall data — from high-level KPIs to granular state-wise and seasonal breakdowns.
📊 Real-Time Slicers and Cross-Filtering – Filter your entire dashboard by region, state, season, data source, rainfall type, and month with a single click for instant, targeted analysis.
🗺️ State-Level Breakdown – Compare verified record percentages, maximum temperatures, and expected rainfall across multiple states simultaneously.
📅 Seasonal and Monthly Trends – Spot recurring seasonal cycles, analyze average rainfall by season, and track month-wise cumulative rainfall and rainy-day counts.
📈 Rainfall Type Analysis – Visualize minimum temperatures, expected rainfall, and rainy days segmented by rainfall type for deeper classification insights.
⚡ Data Verification Monitoring – Quickly assess verified record percentages by season and state to ensure data quality and completeness across your reporting.
🎨 Professional Visual Design – Clean, modern chart layouts with consistent color coding that make presenting findings to stakeholders effortless.
🔧 Fully Customizable – Replace the sample data with your own, adjust color themes, and add new data sources without needing DAX expertise.
📦 What’s Inside the Rainfall Report Management Dashboard in Power BI
This Power BI dashboard template comes with 5 detailed, data-driven pages, each designed to answer a specific set of questions about rainfall performance:
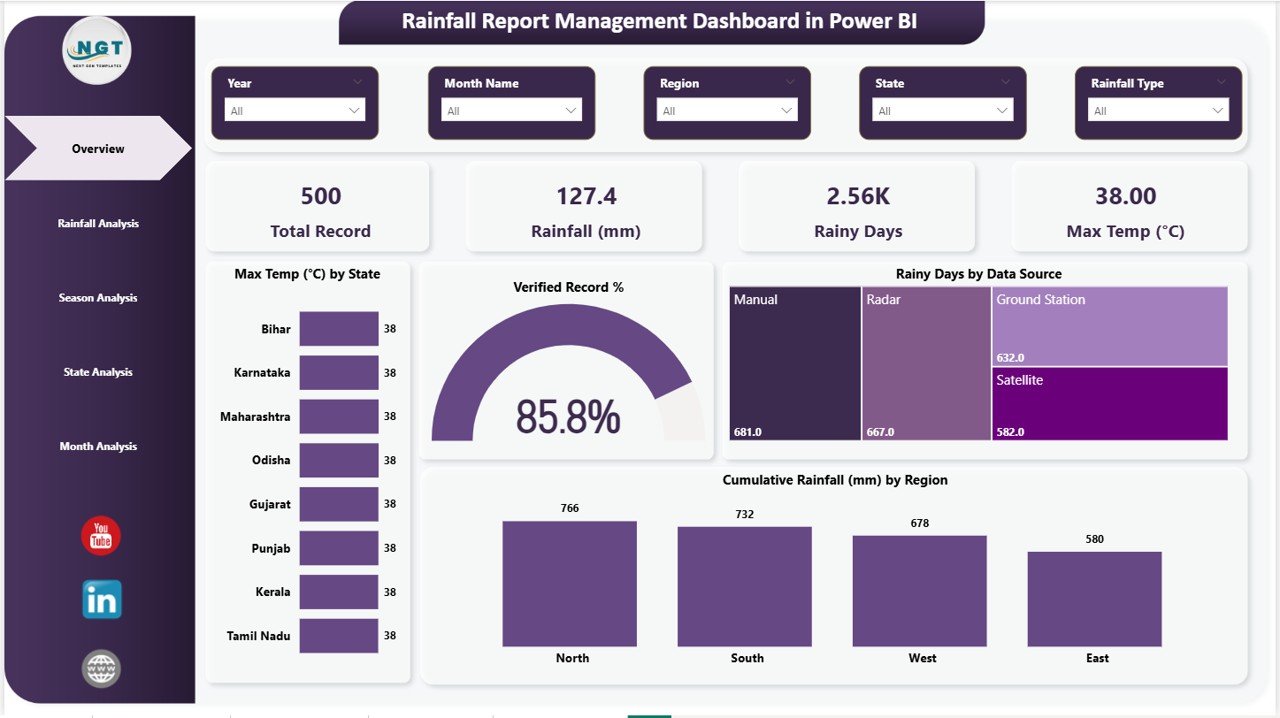
📋 Page 1 – Overview Page
Your command center for rainfall monitoring. At the top, dynamic KPI cards display Total Record, Rainfall (mm), Rainy Days, and Max Temp (°C). Below, interactive charts present Max Temp (°C) by State showing temperature distribution across locations, Verified Record % indicating data quality at a glance, Rainy Days by Data Source comparing contributions from different data origins, and Cumulative Rainfall (mm) by region tracking total precipitation across geographical zones. Multiple slicers let you filter and explore the dashboard instantly.
Overview Page
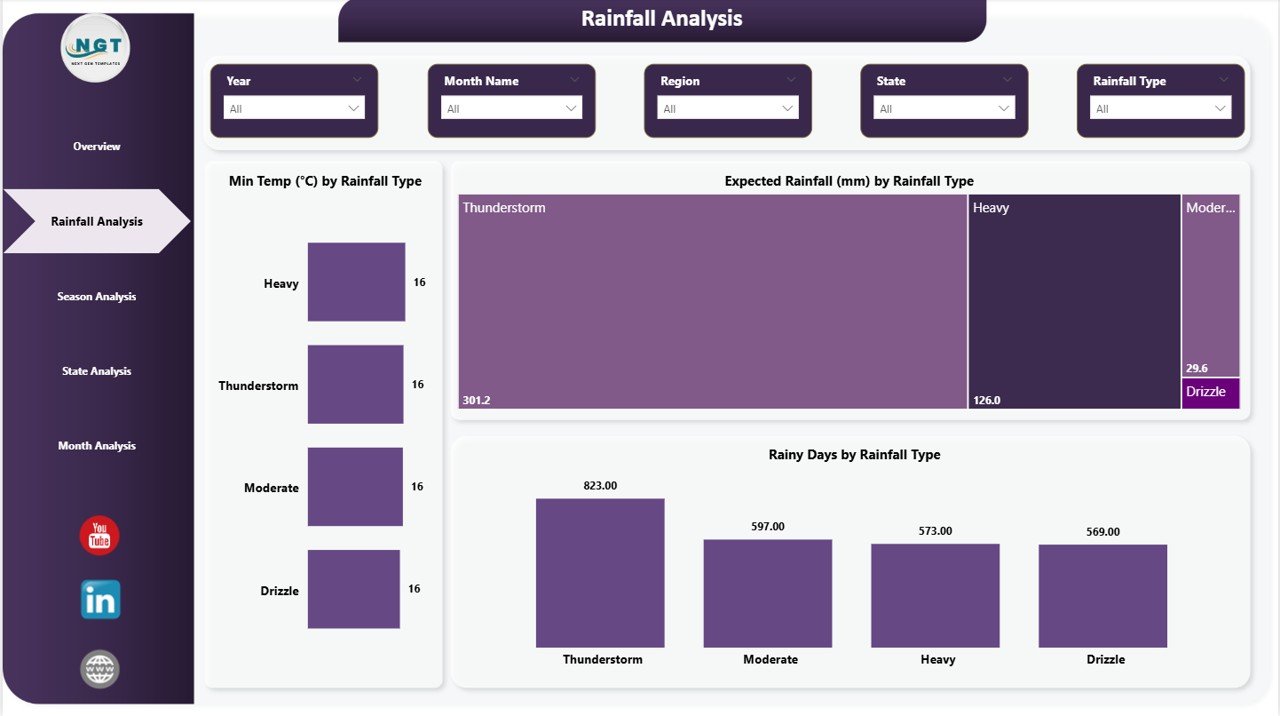
🌧️ Page 2 – Rainfall Analysis
Dive deep into rainfall type classifications with charts for Min Temp (°C) by Rainfall Type revealing temperature patterns associated with different precipitation categories, Expected Rainfall (mm) by Rainfall Type comparing anticipated precipitation volumes, and Rainy Days by Rainfall Type showing how frequently each type occurs. This page is essential for understanding the relationship between rainfall classification and weather metrics. Explore our Blood Banks Dashboard in Power BI and Blockchain Development Dashboard in Power BI for more industry-specific Power BI solutions.
Rainfall Analysis
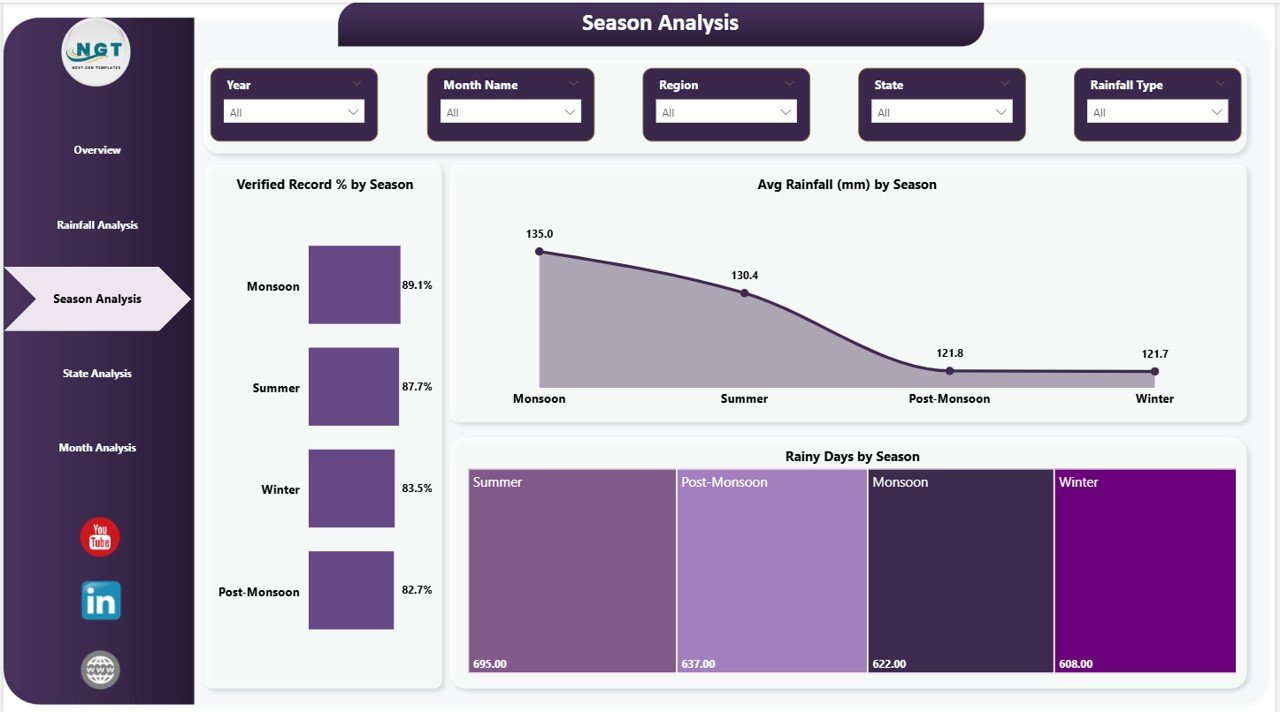
📅 Page 3 – Season Analysis
Understand how rainfall behaves throughout the seasons with Verified Record % by Season indicating data completeness for each seasonal period, Avg Rainfall (mm) by Season comparing average precipitation across spring, summer, monsoon, autumn, and winter, and Rainy Days by Season showing how wet days are distributed throughout the year. This page is invaluable for crop planning, water reservoir management, and seasonal preparedness strategies.
Season Analysis
📈 Page 4 – State Analysis
Zoom into state-level rainfall performance with Verified Record % by State showing data reliability across each state, Max Temp (°C) by State comparing peak temperatures geographically, and Expected Rainfall (mm) by State tracking anticipated precipitation totals by location. This page empowers regional planners, government agencies, and agricultural departments with the comparative perspective they need for resource allocation and policy decisions.
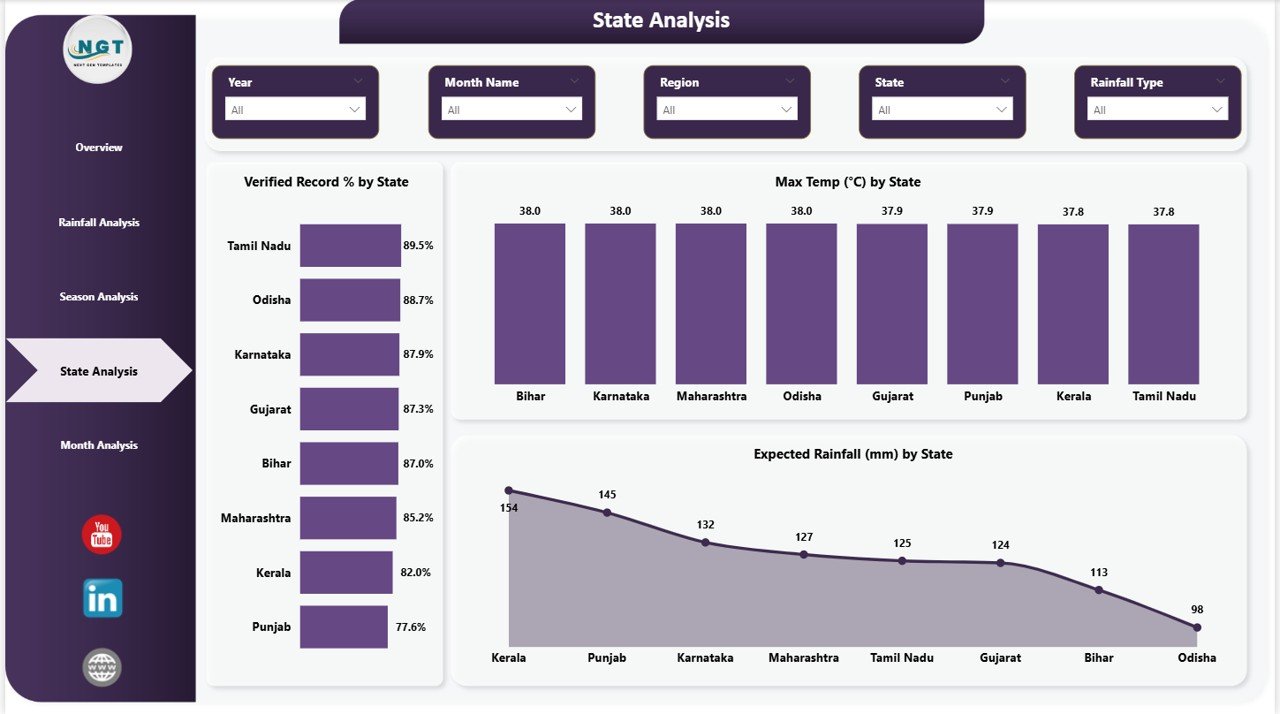
State Analysis
🔍 Page 5 – Month Analysis
Get granular monthly insights with Cumulative Rainfall (mm) by Month Name showing how total precipitation accumulates across each calendar month, Total Record by Month Name displaying data volume distribution over the year, and Rainy Days by Month Name tracking the frequency of wet days month by month. This page is the go-to resource for hydrologists, disaster preparedness officers, and infrastructure planners who need fine-grained temporal detail.
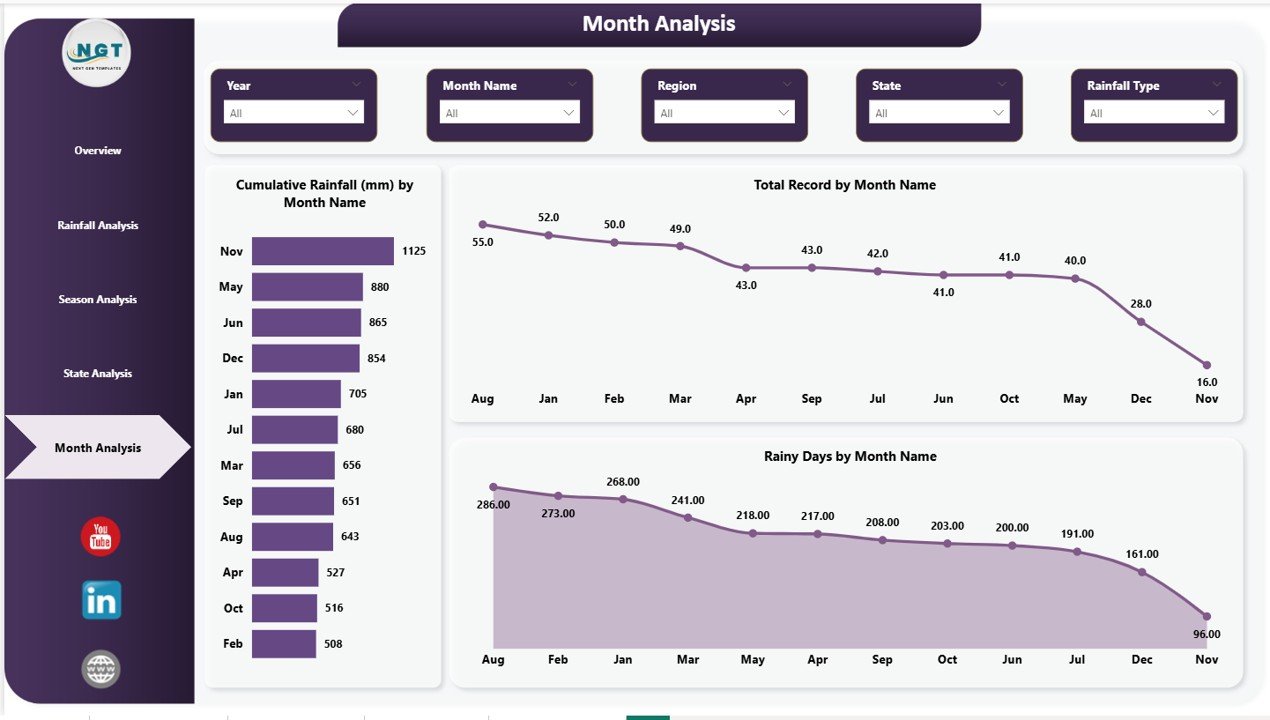
Month Analysis
⚙️ How to Use the Rainfall Report Management Dashboard in Power BI
1️⃣ Download the .zip file and extract the Power BI (.pbix) file
2️⃣ Open the file in Microsoft Power BI Desktop
3️⃣ Navigate to the data source settings and connect your own rainfall dataset
4️⃣ Ensure your data columns match the template’s expected fields (Date, Region, State, Rainfall mm, Temperature, Season)
5️⃣ Click Refresh to load your data into all 5 dashboard pages
6️⃣ Use the slicers and filters on each page to explore state, seasonal, and monthly insights
7️⃣ Share the .pbix file or publish to Power BI Service for team-wide access and live reporting
👥 Who Can Benefit from This Rainfall Report Management Dashboard in Power BI
🌿 Meteorological Departments – Streamline daily and monthly rainfall reporting with automated visualizations
🏛️ Government and Municipal Agencies – Support flood risk management, urban planning, and water policy decisions
🌾 Agricultural Planners and Agri-Businesses – Align planting schedules and irrigation strategies with accurate seasonal data
💧 Water Resource Managers – Monitor reservoir inflows, drought conditions, and catchment area performance
🔬 Environmental Researchers and Scientists – Conduct longitudinal climate studies and publish data-backed findings
🏗️ Infrastructure and Construction Engineers – Assess rainfall impact on project timelines and site safety
📖 Click here to read the Detailed Blog Post
🎥 Visit our YouTube channel to learn step-by-step video tutorials
👉 YouTube.com/@NextGenTemplates


Reviews
There are no reviews yet.