



Cargo Drone Startups Dashboard Key Features
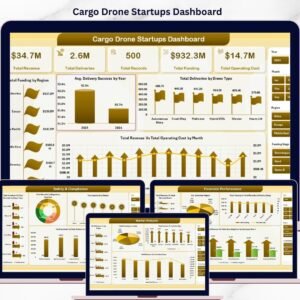
Introducing the Cargo Drone Startups Dashboard, a powerful and ready-to-use digital product designed to simplify and enhance your data analysis for cargo drone startups. This dynamic Excel-based dashboard allows you to effortlessly update your data in the Data Sheet and refresh all visuals with a single click from the Data tab in the Excel Ribbon. It’s the ultimate tool for tracking and analyzing your startup’s performance across multiple critical dimensions.
With multiple interactive pages, this dashboard offers in-depth insights into your operations, financials, fleet analytics, safety, compliance, and market trends. Each page features intuitive slicers and visually appealing charts that help you make data-driven decisions quickly and efficiently.
What’s Inside the Cargo Drone Startups Dashboard
This comprehensive dashboard includes the following sheets, each focusing on essential aspects of your cargo drone business:
1. Overview Page
The Overview page provides a high-level snapshot of your startup’s key metrics using cards and charts. It includes:
- 📊 Total Revenue: Displays your overall revenue generated.
- 🚚 Total Deliveries: Shows the total number of deliveries completed.
- 📁 Total Records: Tracks the total data entries you’ve logged.
- 💰 Total Funding: Highlights the funding raised across all stages.
- 💸 Total Operating Cost: Summarizes your monthly operating expenses.
Charts on this page include:
- Total Funding by Region: Visualizes funding distribution geographically to identify top-performing regions.
- Average Delivery Success by Year: Tracks yearly improvements or declines in delivery success rates.
- Total Deliveries by Drone Type: Compares delivery volume across different drone models.
- Total Revenue Vs Total Operating Cost by Month: Monitors profitability trends over time.

Cargo Drone Startups Dashboard
2. Fleet Analytics
Analyze your drone fleet performance with charts such as:
- 🚁 Total Fleet Vs Total Records by Drone Type
- 🌍 Total Deliveries by Region
- 📦 Average Payload Capacity by Payload Category
- 💼 Total Fleet Vs Total Records by Funding Stage

Fleet Analytics
3. Financial Performance
Gain in-depth financial insights with analysis on:
- 💵 Total Revenue Vs Total Fleet by Month
- 🌐 Net Income by Region
- 📊 Total Funding Vs Total Records by Funding Stage
- 🏢 Total Revenue Vs Total Operating Cost by Company Name

Financial Performance
4. Safety & Compliance
Track safety metrics and regulatory adherence:
- ⚠️ Total Incidents Vs Total Records by Drone Type
- ✅ Total Records by Regulatory Approval
- 🌎 Total Approved by Region
- 🚨 Total Incidents Vs Total Deliveries by Payload Category

Safety & Compliance
5. Market Analysis
Understand market dynamics with charts including:
- 💼 Total Revenue by Region
- 🌍 Total Funding by Country
- 🚁 Total Revenue by Drone Type
- 📈 Total Revenue by Funding Stage

Market Analysis
6. Data Sheet Tab
Here, you input your raw data in a structured format to feed the entire dashboard. This sheet is the backbone of the dashboard’s dynamic updates.

Data Sheet tab
7. Support Sheet
This hidden sheet contains multiple pivot tables powering the dashboard’s interactivity. It enables seamless data refresh and dynamic updates when you click Refresh All.

Support sheet tab
How to Use the Cargo Drone Startups Dashboard
Getting started with your Cargo Drone Startups Dashboard is effortless. Simply follow these steps:
- 🗂️ Update your data accurately in the Data Sheet tab.
- 🔄 Go to the Data tab in the Excel Ribbon.
- ⚡ Click Refresh All to update all pivot tables and charts automatically.
- 📊 Navigate through the multiple sheets to analyze various aspects of your startup’s performance.
- 🎯 Use slicers and filters to drill down into specific regions, drone types, or funding stages.
The dashboard’s intuitive layout ensures even users with basic Excel skills can generate professional insights in minutes.
Who Can Benefit from This Cargo Drone Startups Dashboard
This dashboard is tailored for a wide range of users involved in the cargo drone industry, including:
- 🚀 Startup Founders: Quickly monitor your business growth and financial health.
- 📈 Business Analysts: Perform deep-dive analytics to support strategic decisions.
- 🛠️ Operations Managers: Track delivery success rates and fleet performance efficiently.
- 💼 Investors & Stakeholders: Get a transparent view of funding, revenue, and market trends.
- 🔒 Compliance Officers: Monitor safety incidents and regulatory approvals to ensure industry standards.
- 🎯 Marketing Teams: Analyze market penetration and funding distribution by region.
Whether you are scaling your drone startup or looking to optimize your operations, this dashboard serves as a vital tool to keep all key metrics at your fingertips.
Click here to read the Detailed blog post.
Visit our YouTube channel to learn step-by-step video tutorials
Watch the step-by-step video tutorial:
Compatibility and Requirements
- Works in Microsoft Excel desktop (Excel 2016 or later, or Microsoft 365).
- The dashboard is built on pivot tables. Click Refresh All on the Data tab after you update the Data Sheet. Microsoft explains the basics in Create a PivotTable to analyze worksheet data.
Frequently Asked Questions
Which pages does the dashboard have?
Overview, Fleet Analytics, Financial Performance, Safety & Compliance and Market Analysis, plus a Data Sheet tab and a hidden Support sheet that holds the pivot tables.
How do I update the dashboard with my own data?
Enter your records in the Data Sheet tab, then go to the Data tab in the Excel Ribbon and click Refresh All. All pivot tables and charts update.
What does the Overview page show?
Cards for Total Revenue, Total Deliveries, Total Records, Total Funding and Total Operating Cost. Charts show funding by region, average delivery success by year, deliveries by drone type, and revenue against operating cost by month.
Can I filter by region, drone type or funding stage?
Yes. Each page has slicers and filters so you can drill down into specific regions, drone types or funding stages.
Is there a Power BI version?
Yes. See the Cargo Drone Startups Dashboard in Power BI.
Related Drone and Logistics Templates
- Cargo Drone Startups Dashboard in Power BI: the same dashboard for Power BI
- Drone Delivery Services Dashboard in Excel: delivery operations for drone services
- Drone Services Dashboard in Excel: a wider view of drone service performance
- Logistics Tech Startups Dashboard in Excel: a startup dashboard for logistics companies
- Shipping & Cargo Dashboard in Excel: cargo tracking in Excel
Browse all Excel dashboards.























Reviews
There are no reviews yet.