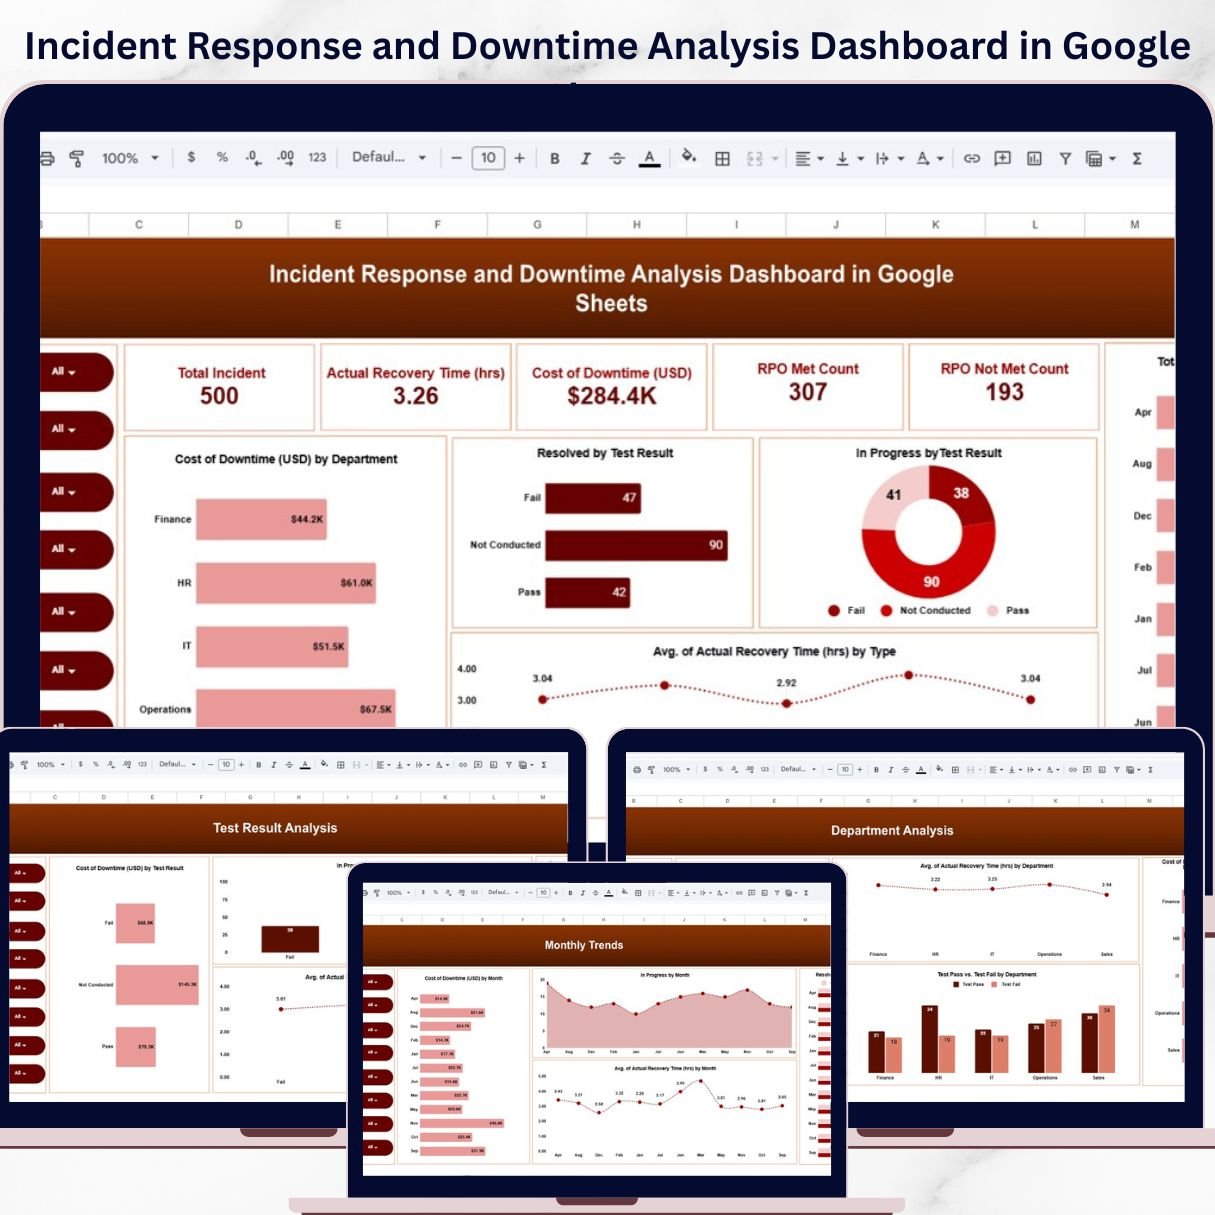

Introducing the Incident Response and Downtime Analysis Dashboard in Google Sheets — a powerful, ready-to-use tool designed to help you monitor incidents, reduce downtime, and improve response efficiency—all in one place.
In today’s digital world, even a few minutes of downtime can lead to huge financial losses and damaged reputation. However, many organizations still rely on scattered data and manual reports, making it difficult to identify root causes and act quickly.
That’s where this smart dashboard comes in! 🚀
It transforms complex incident data into clear, interactive insights. As a result, you can track performance, reduce risks, and make faster, data-driven decisions.
✨ Key Features of Incident Response and Downtime Analysis Dashboard in Google Sheets
🚨 Real-Time Incident Tracking
Monitor total incidents, their status, and progress in a centralized dashboard.
⏱️ Recovery Time Analysis
Track average recovery time to improve incident response efficiency.
💰 Downtime Cost Calculation
Understand the financial impact of downtime across departments.
📊 RPO Performance Monitoring
Track Recovery Point Objective (RPO) compliance with clear success/failure metrics.
📈 Multi-Dimensional Analysis
Analyze incidents by type, department, test results, and time.
📅 Monthly Trend Tracking
Identify patterns and recurring issues over time.
🎯 Interactive & Dynamic Dashboard
Use filters and slicers to drill down into specific insights instantly.
⚡ Actionable Insights
Quickly identify bottlenecks and improve operational workflows.
📂 What’s Inside the Incident Response and Downtime Analysis Dashboard in Google Sheets
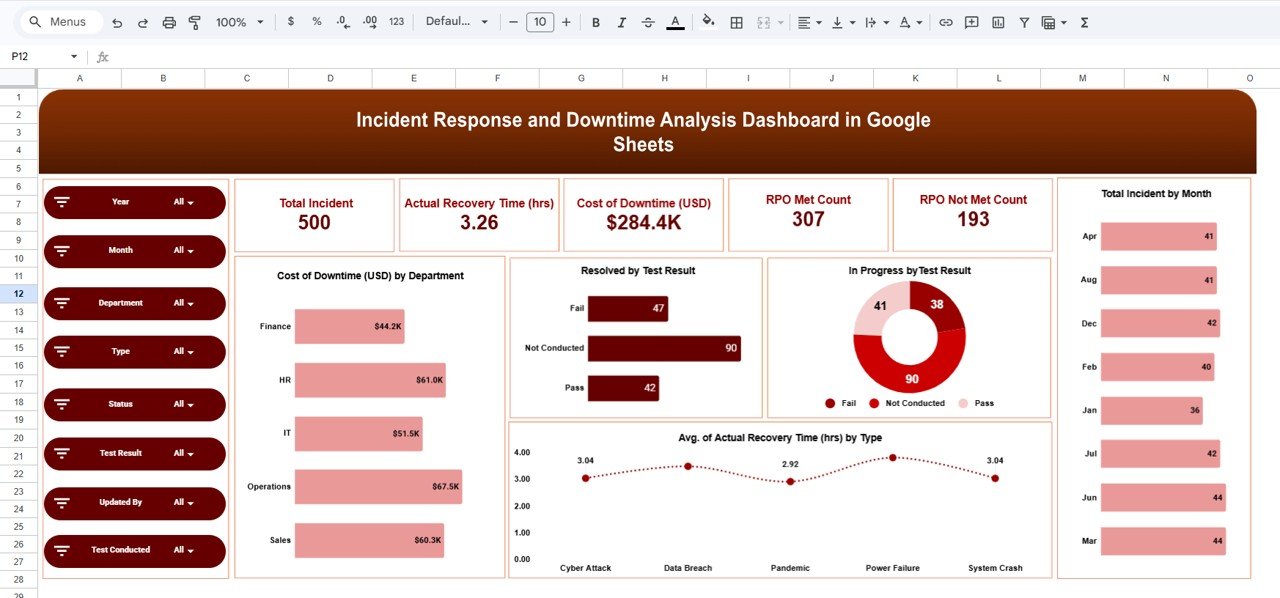
📌 Overview Dashboard
Get a complete snapshot with KPIs like Total Incidents, Avg Recovery Time, Downtime Cost, and RPO metrics.
📌 Incident Type Analysis
Understand which types of incidents cause the most downtime and cost.
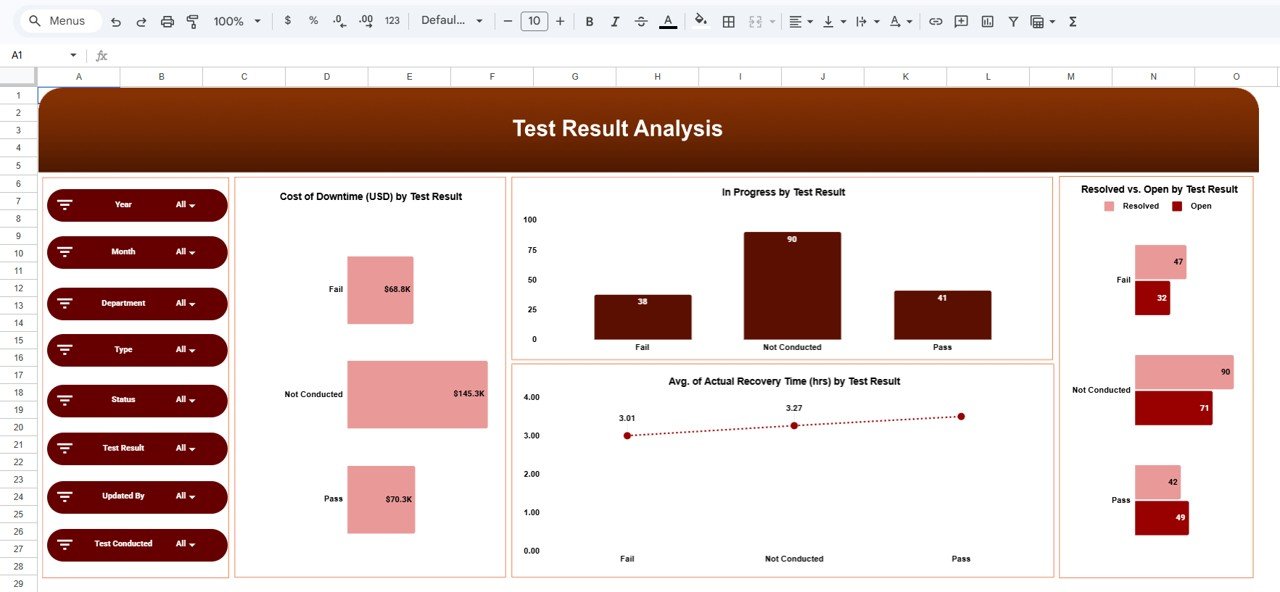
📌 Test Result Analysis
Evaluate system reliability with pass/fail insights and recovery performance.
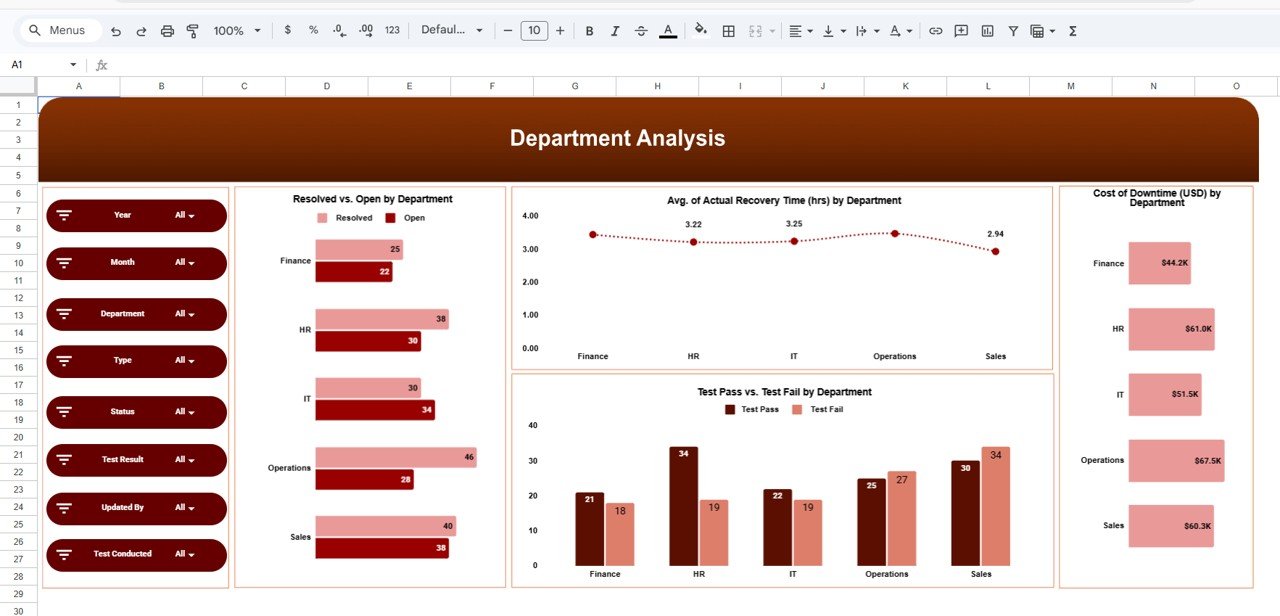
📌 Department Analysis
Identify which teams need improvement based on incident resolution and performance.
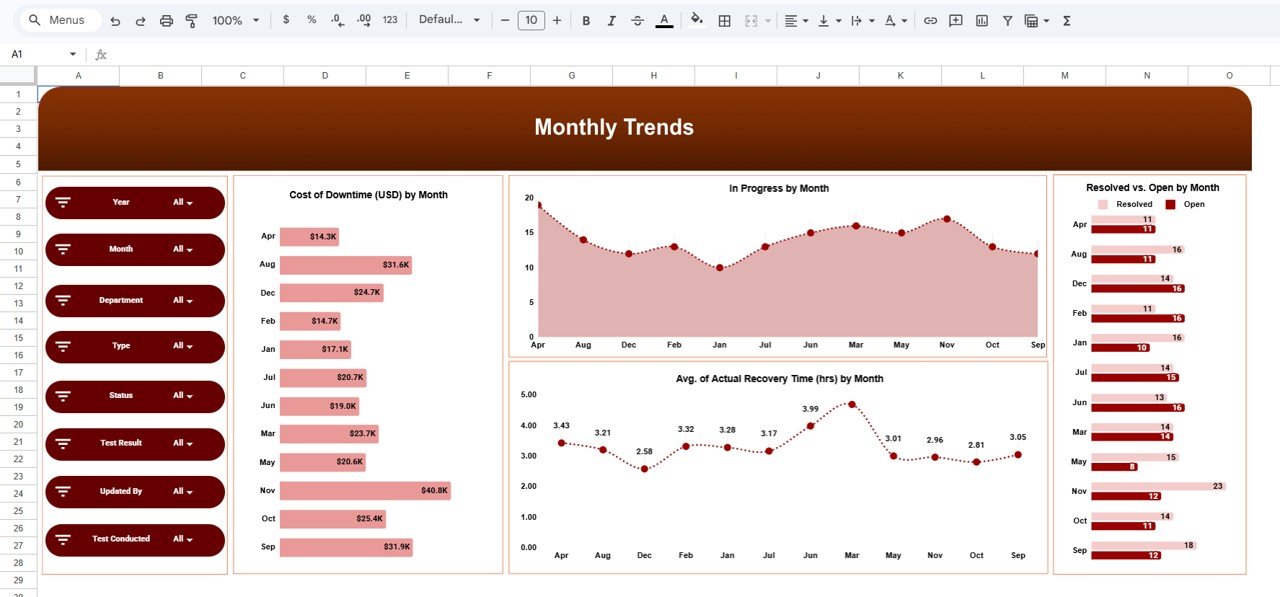
📌 Monthly Trends Analysis
Track downtime, incidents, and recovery performance across months.
🛠️ How to Use the Incident Response and Downtime Analysis Dashboard in Google Sheets
Using this dashboard is simple and beginner-friendly! 💡
1️⃣ Enter Incident Data
Input details like incident type, department, recovery time, and test results.
2️⃣ Update the Dashboard
Refresh or update data to reflect current performance.
3️⃣ Apply Filters & Views
Analyze incidents by department, type, or time period.
4️⃣ Review KPIs & Charts
Understand performance through visual insights.
5️⃣ Take Action
Identify bottlenecks and improve response processes.
👥 Who Can Benefit from This Incident Response and Downtime Analysis Dashboard in Google Sheets
💻 IT Teams – Track system failures and improve recovery time
🛡️ Cybersecurity Teams – Monitor incidents and reduce risks
📊 Operations Managers – Improve operational efficiency
📈 Data Analysts – Generate insights quickly
🏢 Business Owners – Reduce downtime costs and improve reliability
💡 Why This Dashboard is a Game-Changer?
✔ Reduce downtime and financial losses
✔ Improve incident response time
✔ Gain complete visibility into operations
✔ Identify root causes faster
✔ Enhance system reliability
👉 If you want to build a resilient, efficient, and data-driven organization, this dashboard is a must-have tool!
📖 Click here to read the Detailed blog post
Watch the step-by-step video tutorial:


