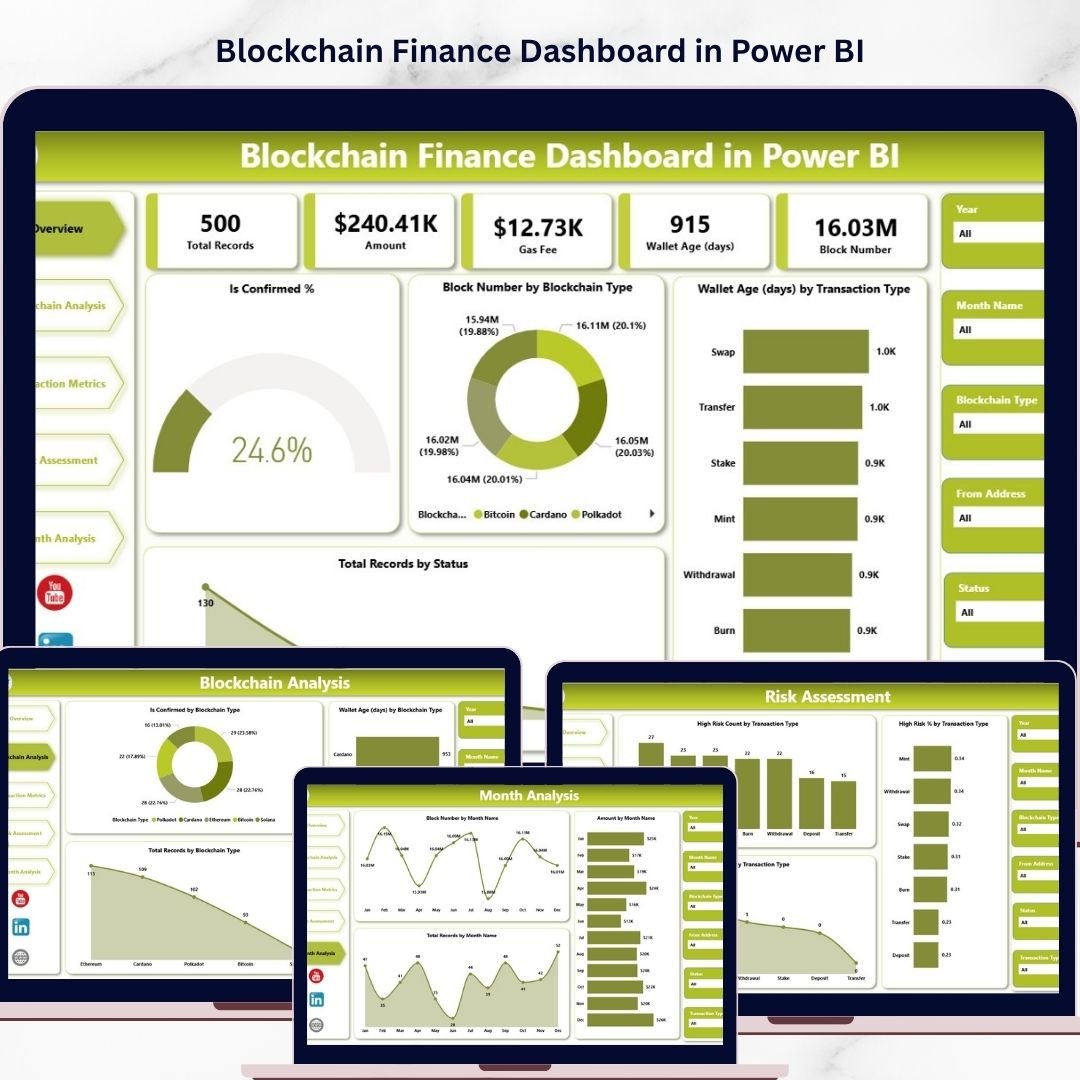

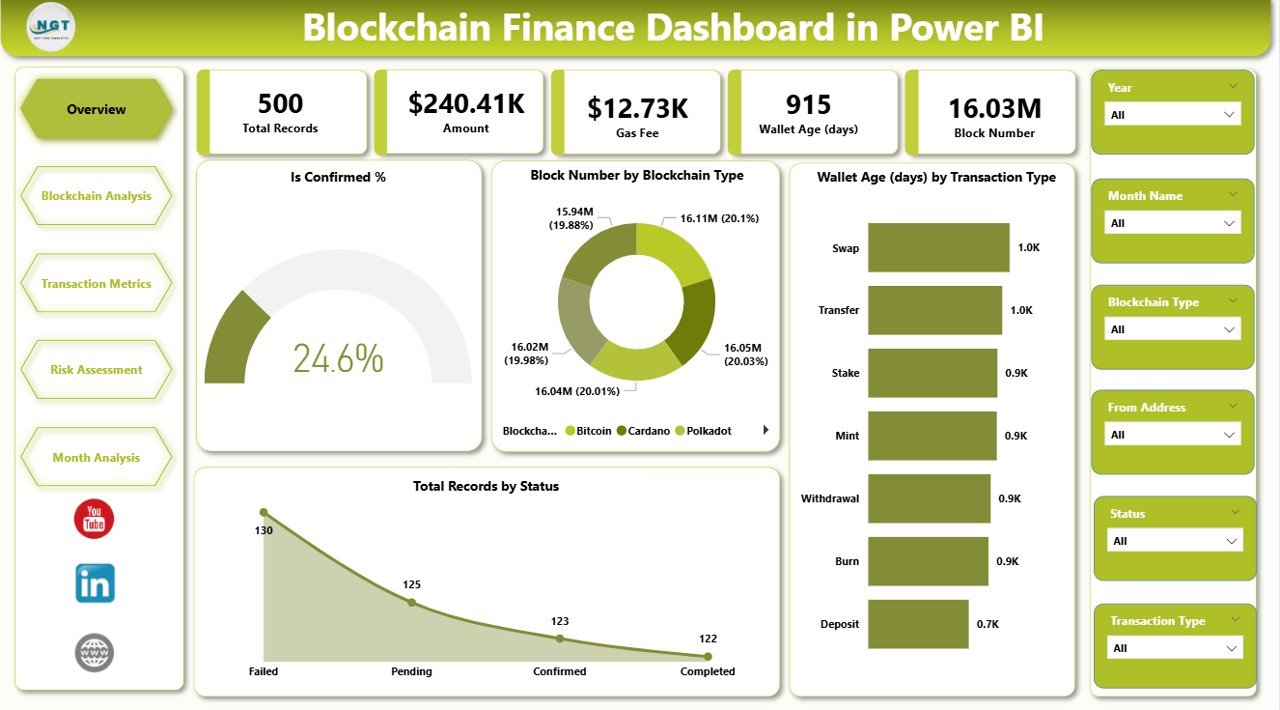
Take control of your blockchain financial data with the Blockchain Finance Dashboard in Power BI 🚀. In today’s rapidly evolving financial ecosystem, thousands of crypto transactions and smart contract activities occur every second. However, managing this massive data manually can be overwhelming.
That’s where this powerful and ready-to-use dashboard becomes a game-changing solution.
It converts complex blockchain data into interactive visuals, KPI insights, and real-time analytics, helping you track transactions, monitor risks, and make faster, smarter financial decisions.
🚀 Key Feature of Blockchain Finance Dashboard in Power BI
✅ 📊 Interactive Power BI Dashboard
Visualize blockchain data using dynamic charts and slicers.
✅ 📈 Real-Time KPI Monitoring
Track transactions, gas fees, wallet behavior, and performance.
✅ 🔍 Advanced Filtering (Slicers)
Analyze data by blockchain type, transaction type, and status.
✅ ⚠️ Risk Detection System
Identify high-risk transactions instantly.
✅ 📅 Trend Analysis
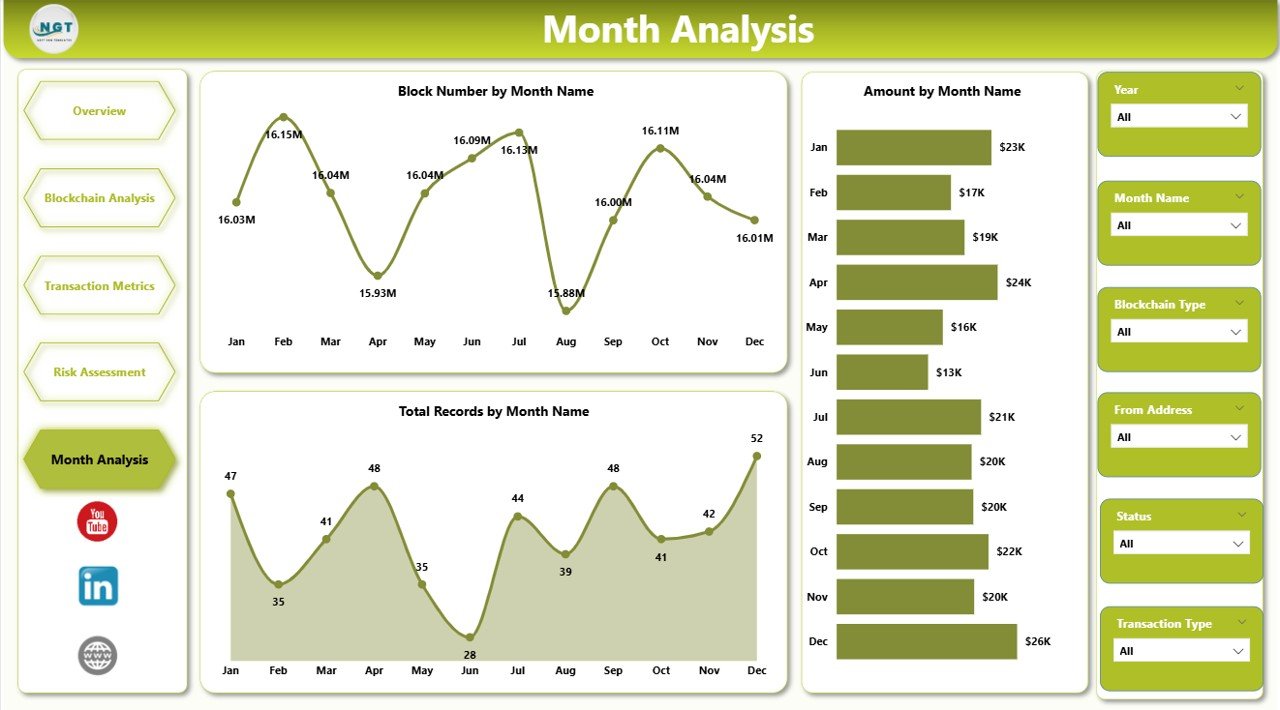
Monitor monthly performance and growth patterns.
✅ 📊 Multi-Page Analytics
Explore insights across multiple dimensions.
✅ ⚡ Automated Data Insights
Reduce manual reporting and save time.
📦 What’s Inside the Blockchain Finance Dashboard in Power BI
This dashboard includes 5 powerful and interactive pages:
🏠 Overview Page – Snapshot of key KPIs and overall performance
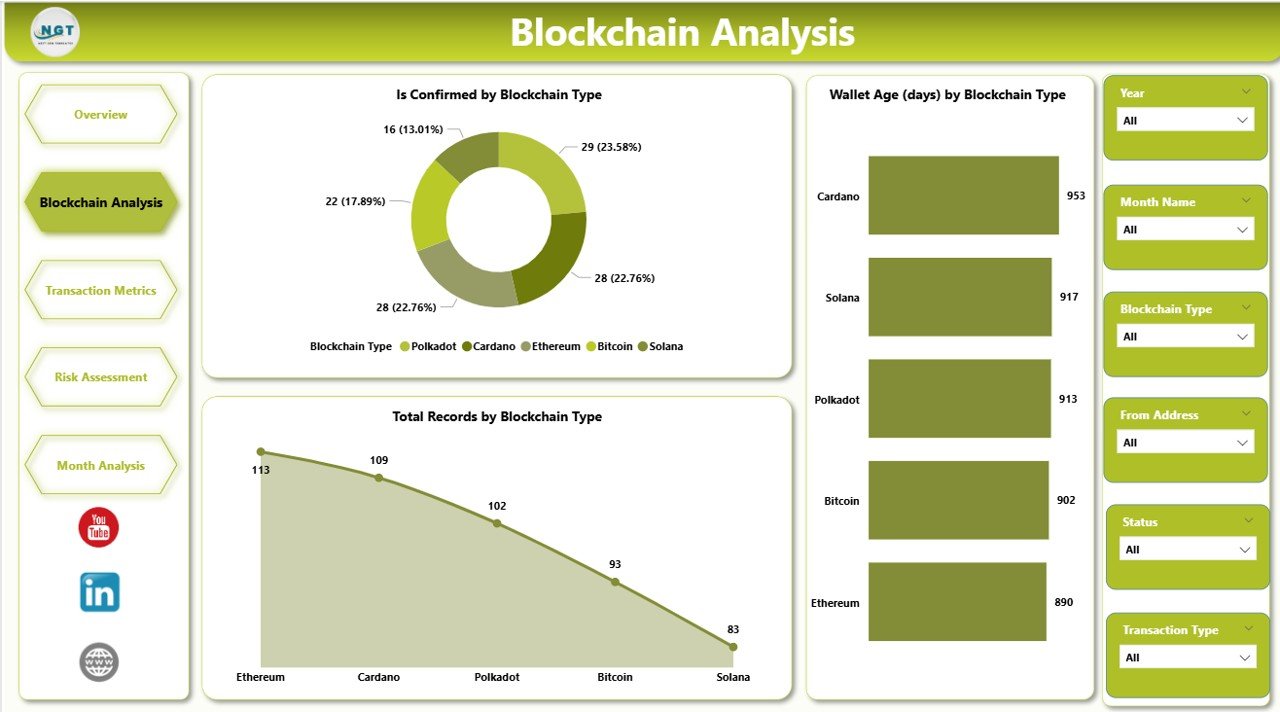
🔗 Blockchain Analysis – Compare performance across blockchain networks
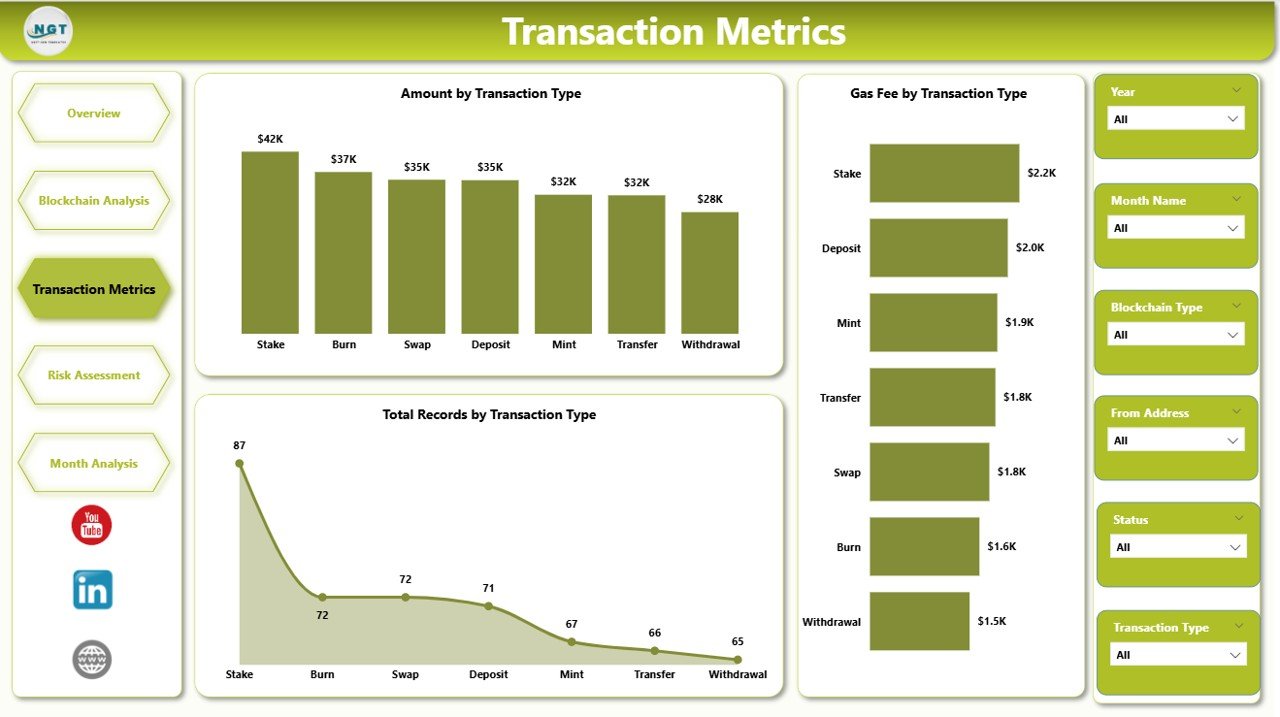
💸 Transaction Metrics – Analyze transaction values and gas fees
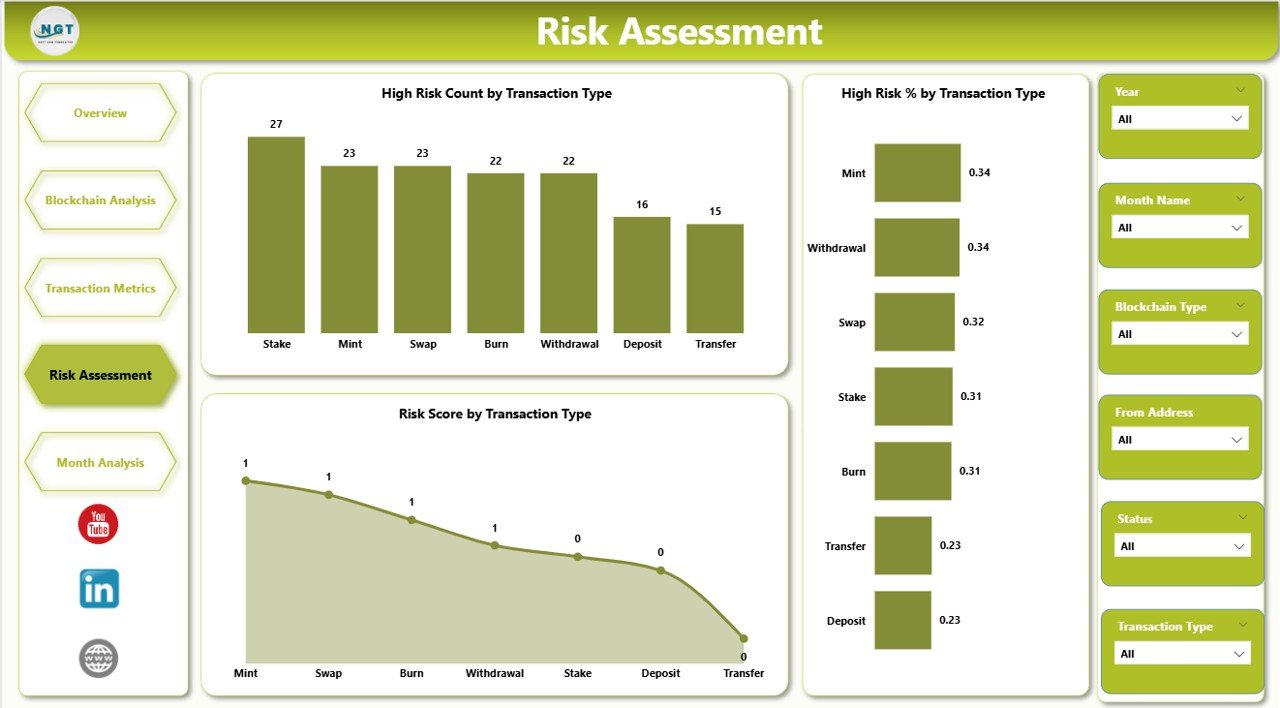
⚠️ Risk Assessment Page – Detect suspicious and high-risk activities
📅 Month Analysis – Track trends and performance over time
👉 Together, these pages provide a complete 360° view of blockchain financial data.
⚙️ How to Use the Blockchain Finance Dashboard in Power BI
Getting started is simple:
👉 Import your blockchain data into Power BI
👉 Connect it to the dashboard
👉 Use slicers to filter data dynamically
👉 Analyze KPI cards and visual charts
👉 Identify trends, risks, and performance gaps
Within minutes, you can transform raw blockchain data into actionable financial insights 📊.
👨💻 Who Can Benefit from This Blockchain Finance Dashboard in Power BI
This dashboard is ideal for:
💼 Financial Analysts – Analyze blockchain financial performance
🪙 Crypto Traders & Investors – Track transactions and risks
💻 Blockchain Developers – Monitor network activity
🏦 FinTech Companies – Improve financial analytics
🔐 Risk & Compliance Teams – Detect fraud and high-risk activities
👉 Anyone working with blockchain finance and analytics can benefit from this tool.
🔗 Click hare to read the Detailed blog post
Explore the complete guide with features, advantages, and best practices.
👉 Visit our YouTube channel to learn step-by-step video tutorials:
https://youtube.com/@PKAnExcelExpert
Watch the step-by-step video tutorial:
Compatibility and Requirements
- Open the report in Power BI Desktop, which is free. Microsoft explains how to install it in Get Power BI Desktop.
- Slicers on the pages filter by blockchain type, transaction type and status. Sharing a report online needs a Power BI account, but building and viewing it in Desktop does not.
Frequently Asked Questions
What pages are in the Blockchain Finance Dashboard?
Five pages: Overview, Blockchain Analysis, Transaction Metrics, Risk Assessment and Month Analysis.
What does the dashboard track?
Transactions, transaction values, gas fees, wallet behavior and performance across blockchain networks.
How does the risk page work?
The Risk Assessment page highlights suspicious and high-risk transactions so you can review them.
Can I filter the data?
Yes. Use the slicers to filter by blockchain type, transaction type and status.
Is there an Excel version?
Yes, see the Blockchain Finance Dashboard in Excel.
Related Blockchain and Crypto Templates
- Blockchain Finance Dashboard in Excel: the same dashboard in Excel.
- Blockchain & Cryptocurrency Dashboard in Power BI: a broader crypto market view.
- Blockchain & Cryptocurrency KPI Dashboard in Power BI: monthly KPIs against targets.
- Crypto Portfolio Dashboard in Power BI: track holdings and returns.
- Fintech Dashboard in Power BI: for fintech operations.
Browse all Power BI dashboards or the Power BI KPI dashboards.