The digital Astrology Apps Dashboard has experienced tremendous growth in recent years. Millions of users now rely on astrology applications to check daily horoscopes, explore zodiac compatibility, receive birth chart insights, and access spiritual guidance. With the rapid expansion of mobile technology, astrology apps have become a major segment of the digital wellness and entertainment industry.
However, as astrology applications grow in popularity, they also generate massive amounts of data. App developers and business owners must track multiple metrics such as user engagement, subscription revenue, ad revenue, in-app purchases, feature usage, and platform performance. Managing this information through scattered spreadsheets and manual reports can make analysis difficult and time-consuming.
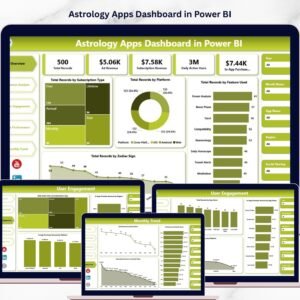
To solve this challenge, businesses increasingly adopt centralized analytics systems. One powerful solution is the Astrology Apps Dashboard in Power BI.
The Astrology Apps Dashboard in Power BI is a ready-to-use business intelligence solution designed to transform complex application data into interactive visual insights. Using Microsoft Power BI’s advanced visualization capabilities, the dashboard converts raw datasets into dynamic charts, KPI indicators, and interactive filters that help businesses analyze app performance efficiently.
Instead of manually analyzing thousands of records, decision-makers can explore app performance through an interactive dashboard that updates automatically whenever new data is refreshed.
This dashboard helps astrology app companies monitor key metrics such as total users, subscription plans, advertising revenue, in-app purchases, feature usage, zodiac sign engagement, and monthly performance trends.
With the help of Power BI’s powerful filtering capabilities, users can analyze data based on subscription type, platform, region, zodiac sign, feature usage, or time period. As a result, businesses can quickly identify user preferences, optimize marketing campaigns, and improve monetization strategies.
The dashboard includes five analytical pages, each designed to provide insights into a different area of application performance. These pages include Overview, Revenue Analysis, User Engagement, App Performance, and Month Analysis.
Whether you manage a horoscope application, zodiac compatibility platform, tarot reading service, or spiritual wellness app, this dashboard provides a complete analytics framework to monitor performance and growth.
By transforming complex application data into meaningful visual insights, the Astrology Apps Dashboard in Power BI enables businesses to improve user engagement, optimize revenue strategies, and enhance product development decisions.
✨ Key Feature of Astrology Apps Dashboard in Power BI
🔮 Interactive Astrology App Analytics
Monitor app performance through dynamic Power BI visuals and KPI indicators.
📊 User Engagement Monitoring
Track how users interact with astrology features such as horoscopes, tarot readings, and compatibility reports.
💰 Revenue & Subscription Tracking
Analyze subscription plans, advertising revenue, and in-app purchases.
📱 Platform Performance Analysis
Compare performance across Android, iOS, and web platforms.
🌟 Zodiac Sign Engagement Insights
Understand which zodiac sign users interact with the most.
📈 Feature Usage Analysis
Identify which astrology features generate the highest user activity.
🌍 Regional Revenue Monitoring
Track revenue and engagement across different regions.
📅 Monthly Performance Trends
Monitor user growth and revenue patterns across months.
🎛 Interactive Filters & Slicers
Analyze data instantly by platform, subscription type, or feature.
⚙️ Power BI Automated Data Visualization
Convert large datasets into easy-to-understand dashboards.
📊 What’s Inside the Astrology Apps Dashboard in Power BI
The dashboard includes five analytical pages, each designed to analyze astrology application performance from a different perspective.
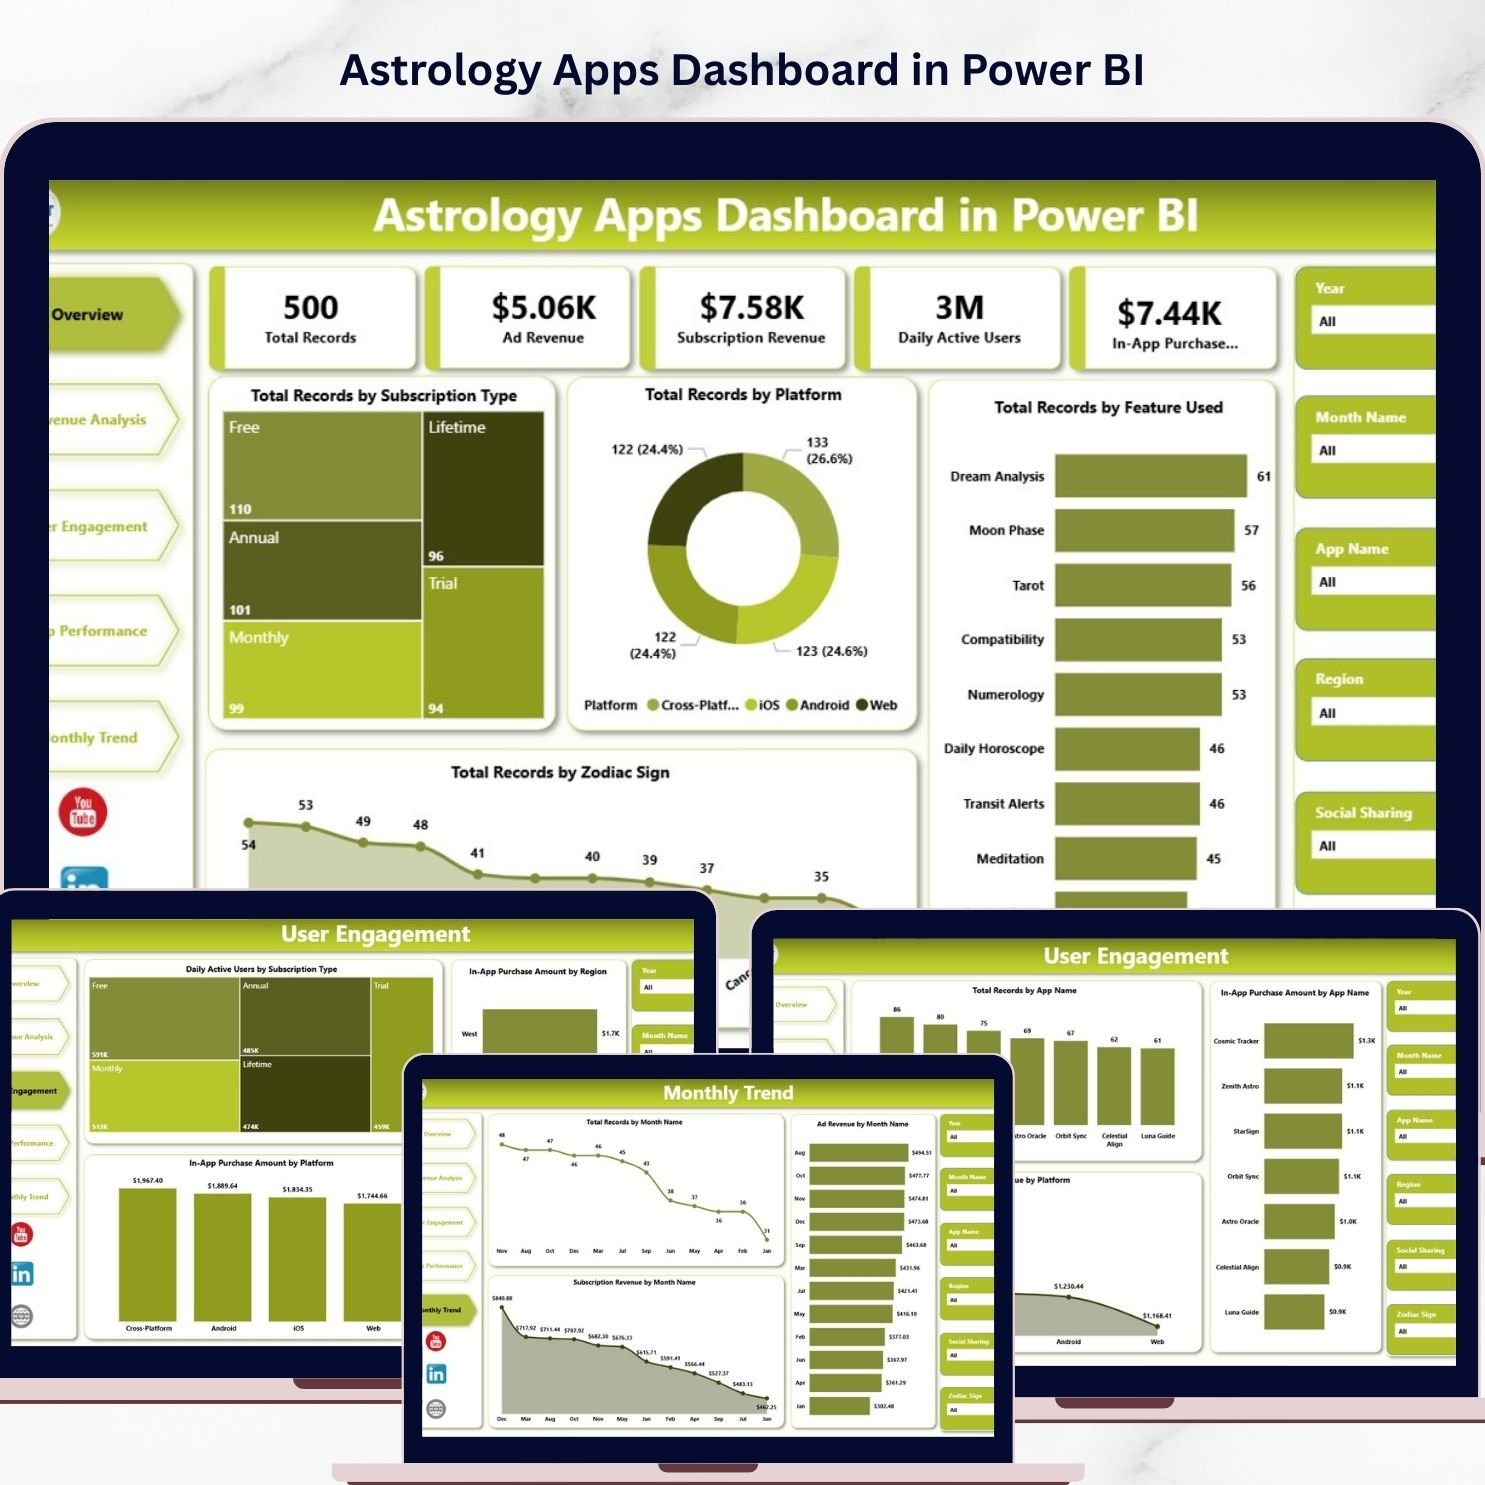
🔮 Overview Page – Application Performance Snapshot
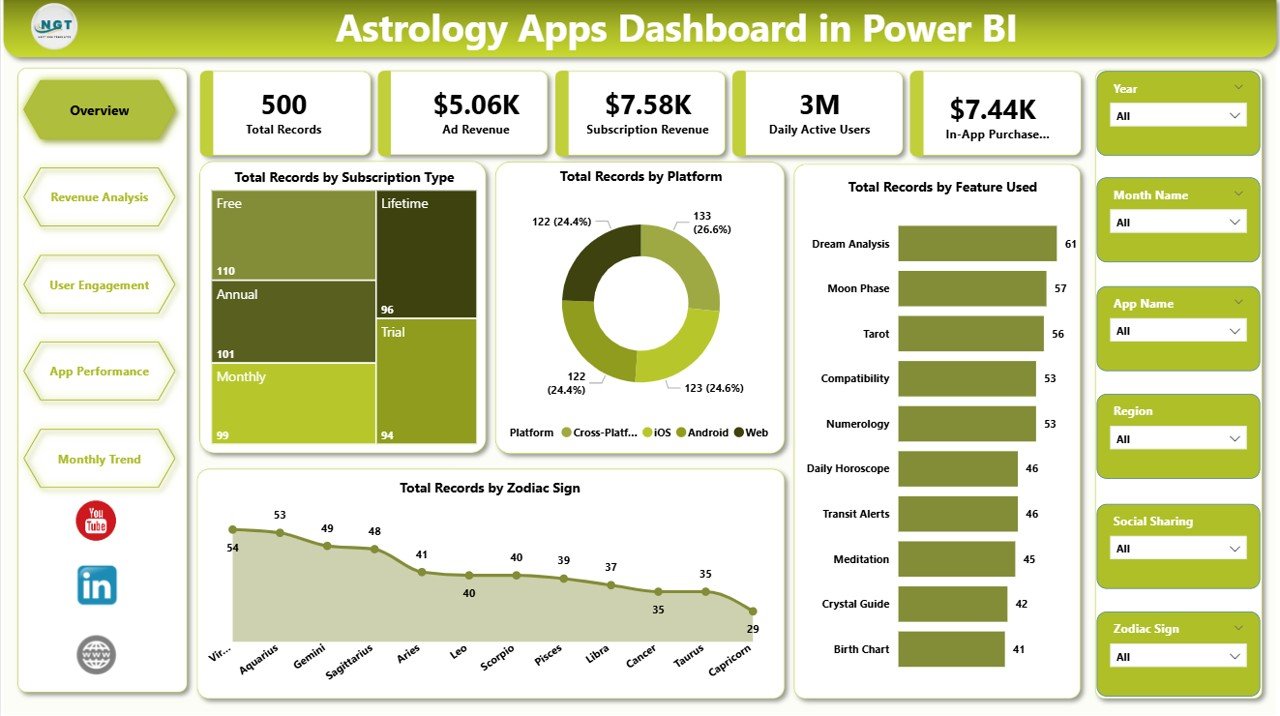
The Overview Page provides a high-level summary of application analytics.
This page includes interactive slicers and KPI cards that display key metrics.
KPI Cards Included
• Total Records by Subscription Type
• Total Records by Platform
• Total Records by Feature Used
• Total Records by Zodiac Sign
These KPIs allow managers to quickly evaluate overall app activity and user preferences.
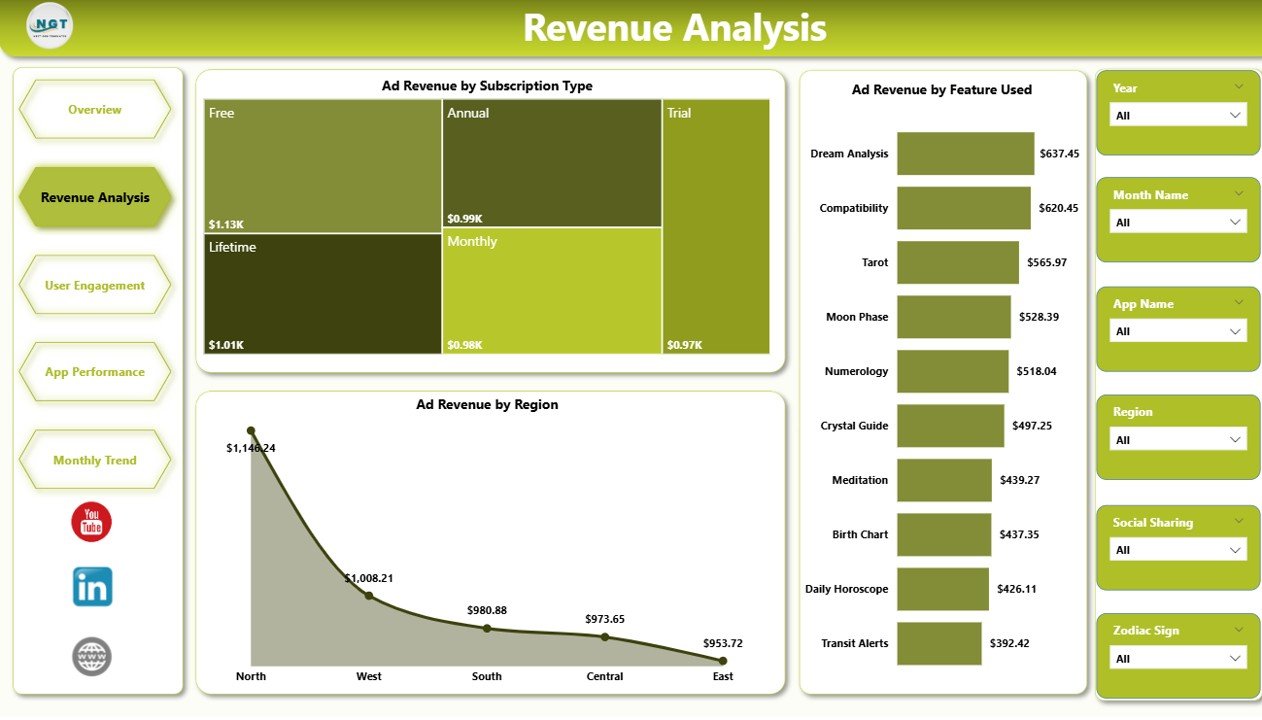
💰 Revenue Analysis Page
Revenue tracking is essential for astrology applications. The Revenue Analysis Page focuses on advertising and monetization insights.
Charts included:
• Ad Revenue by Subscription Type
• Ad Revenue by Feature Used
• Ad Revenue by Region
This analysis helps businesses understand which features and markets generate the highest revenue.
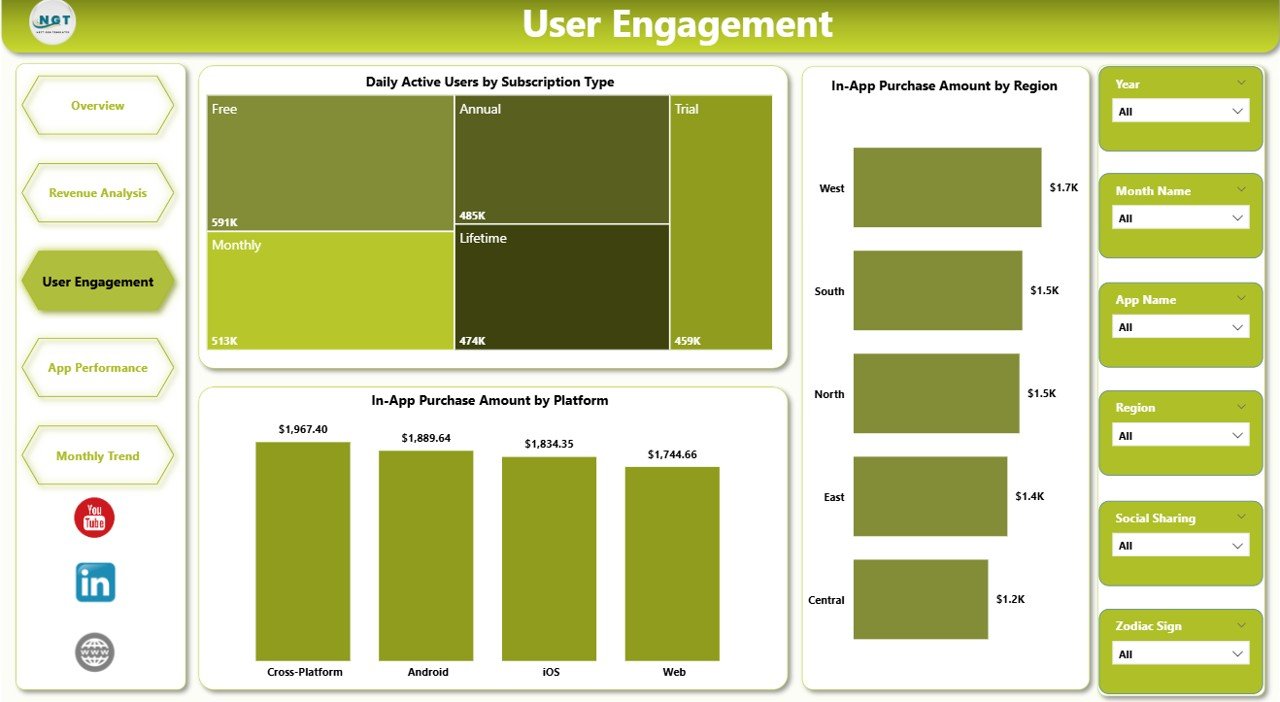
📈 User Engagement Page
The User Engagement Page analyzes how active users are within the application.
Charts included:
• Daily Active Users by Subscription Type
• In-App Purchase Amount by Region
• In-App Purchase Amount by Platform
These metrics help product teams evaluate engagement and purchase behavior.
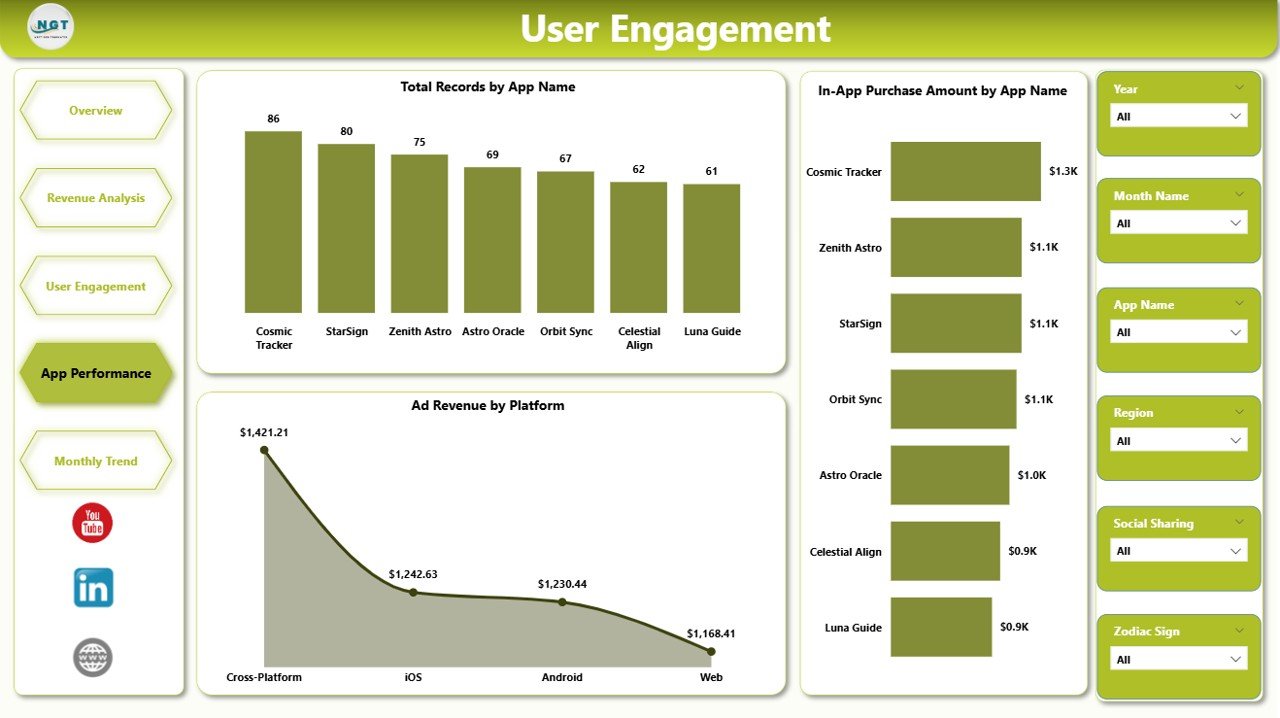
📱 App Performance Page
Companies that operate multiple astrology apps must compare their performance.
Charts included:
• Total Records by App Name
• In-App Purchase Amount by App Name
• Ad Revenue by Platform
This analysis helps businesses identify the most successful apps and platforms.
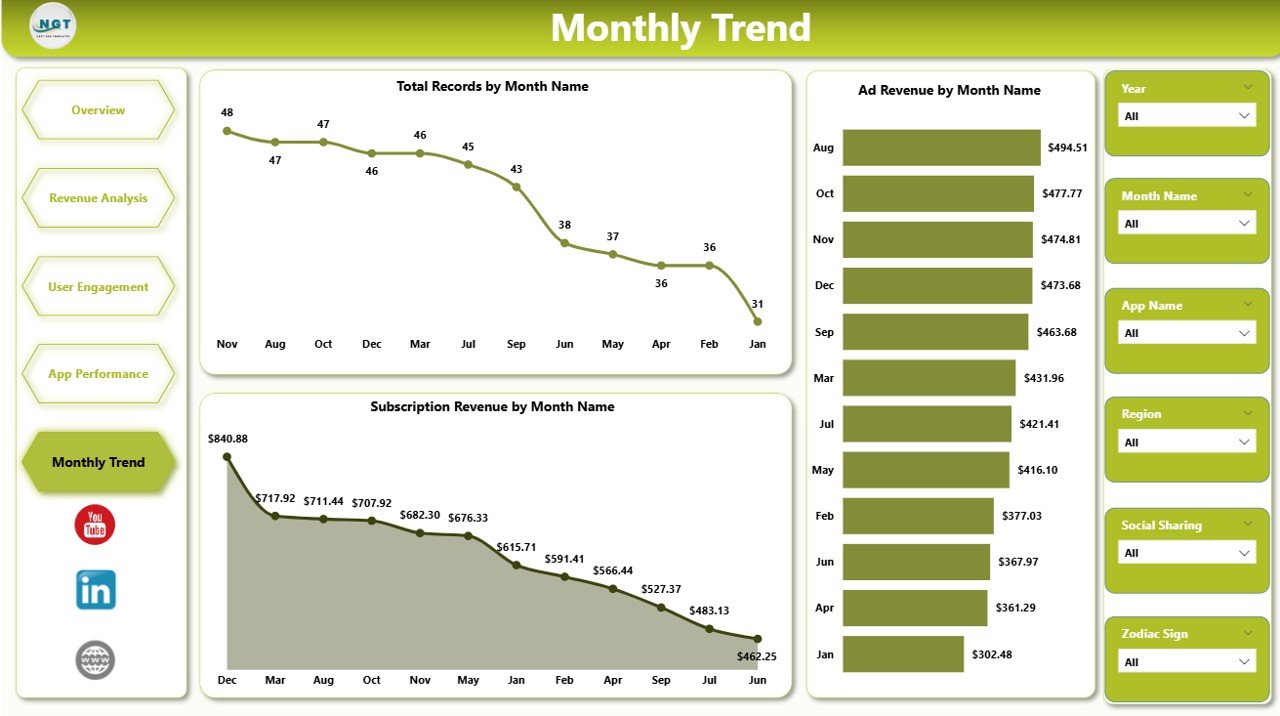
📅 Month Analysis Page
The Month Analysis Page tracks performance trends across time.
Charts included:
• Total Records by Month
• Ad Revenue by Month
• Subscription Revenue by Month
This page helps companies analyze seasonal engagement patterns and revenue growth.
⚙️ How to Use the Astrology Apps Dashboard in Power BI
Using this dashboard is straightforward.
1️⃣ Import astrology app data into Power BI.
2️⃣ Ensure the dataset includes subscription type, platform, revenue, feature usage, and zodiac sign activity.
3️⃣ Use interactive slicers to filter data dynamically.
4️⃣ Analyze performance insights across the different dashboard pages.
5️⃣ Refresh data regularly to keep analytics accurate.
Within seconds, Power BI converts raw application data into powerful visual insights.
👥 Who Can Benefit from This Dashboard
This dashboard is ideal for professionals working in mobile app analytics.
📱 Astrology App Developers
📊 Product Managers
📈 Data Analysts
📣 Marketing Teams
🚀 Startup Founders
💰 App Monetization Strategists
These professionals can use the dashboard to monitor growth, analyze user behavior, and optimize revenue strategies.
### Click hare to read the Detailed blog post
Visit our YouTube channel to learn step-by-step video tutorials
https://youtube.com/@PKAnExcelExpert