

Managing personal finances successfully requires discipline, regular monitoring, and clear financial goals. Many individuals attempt to track their income, expenses, savings, and investments using simple spreadsheets. However, without a structured financial monitoring system, it becomes difficult to understand financial performance, identify spending patterns, and measure progress toward financial goals.
This is where the Personal Finance KPI Scorecard in Excel becomes an extremely powerful and practical solution.
The Personal Finance KPI Scorecard in Excel is a ready-to-use financial monitoring template designed to help individuals evaluate their financial health using Key Performance Indicators (KPIs). Instead of manually reviewing multiple financial records, this scorecard converts your financial data into visual insights, performance indicators, and trend analysis.
With this template, you can easily track important financial metrics such as income growth, savings rate, expense ratio, investment performance, debt levels, and net worth growth. Moreover, the scorecard compares your Actual financial results against Target values, helping you clearly see whether you are on track with your financial goals.
Because the template uses Excel’s powerful features such as formulas, conditional formatting, and trend charts, it transforms complex financial data into easy-to-understand visual performance indicators.
As a result, you can quickly identify areas where your finances are performing well and areas that require improvement.
Whether you want to improve your budgeting discipline, increase savings, reduce debt, or monitor investments, this scorecard helps you stay focused and financially organized.
💰 Key Feature of Personal Finance KPI Scorecard in Excel
📊 Comprehensive Financial KPI Monitoring
Track key financial indicators such as Savings Rate, Expense Ratio, Investment Growth, Debt Ratio, and Net Worth Growth.
📈 MTD and YTD Performance Tracking
Monitor Month-to-Date and Year-to-Date financial performance to evaluate your progress over time.
🎯 Actual vs Target Comparison
Compare your actual financial performance against planned targets to measure financial discipline.
🟢 Visual Performance Indicators
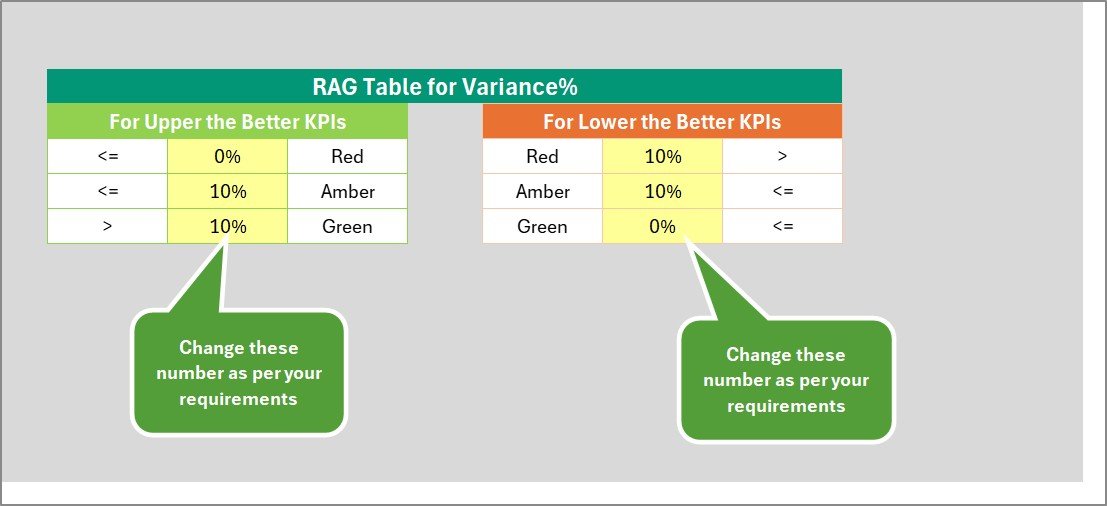
Conditional formatting highlights financial results using colors such as green, yellow, and red for easy performance evaluation.
📉 KPI Trend Analysis
Analyze financial progress using trend charts that display actual, target, and previous year performance.
📂 Four Organized Worksheets
The template includes Scorecard, KPI Trend, Input Data, and KPI Definition sheets to keep financial data structured.
⚙️ Easy Data Entry System
The Input Data sheet allows users to enter financial information quickly and efficiently.
📊 Excel-Based and Fully Customizable
Because the template is built in Excel, users can easily customize KPIs, targets, and financial metrics.
📦 What’s Inside the Personal Finance KPI Scorecard in Excel
This ready-to-use Excel template includes four structured worksheets designed to provide complete financial KPI monitoring.
1️⃣ Scorecard Sheet
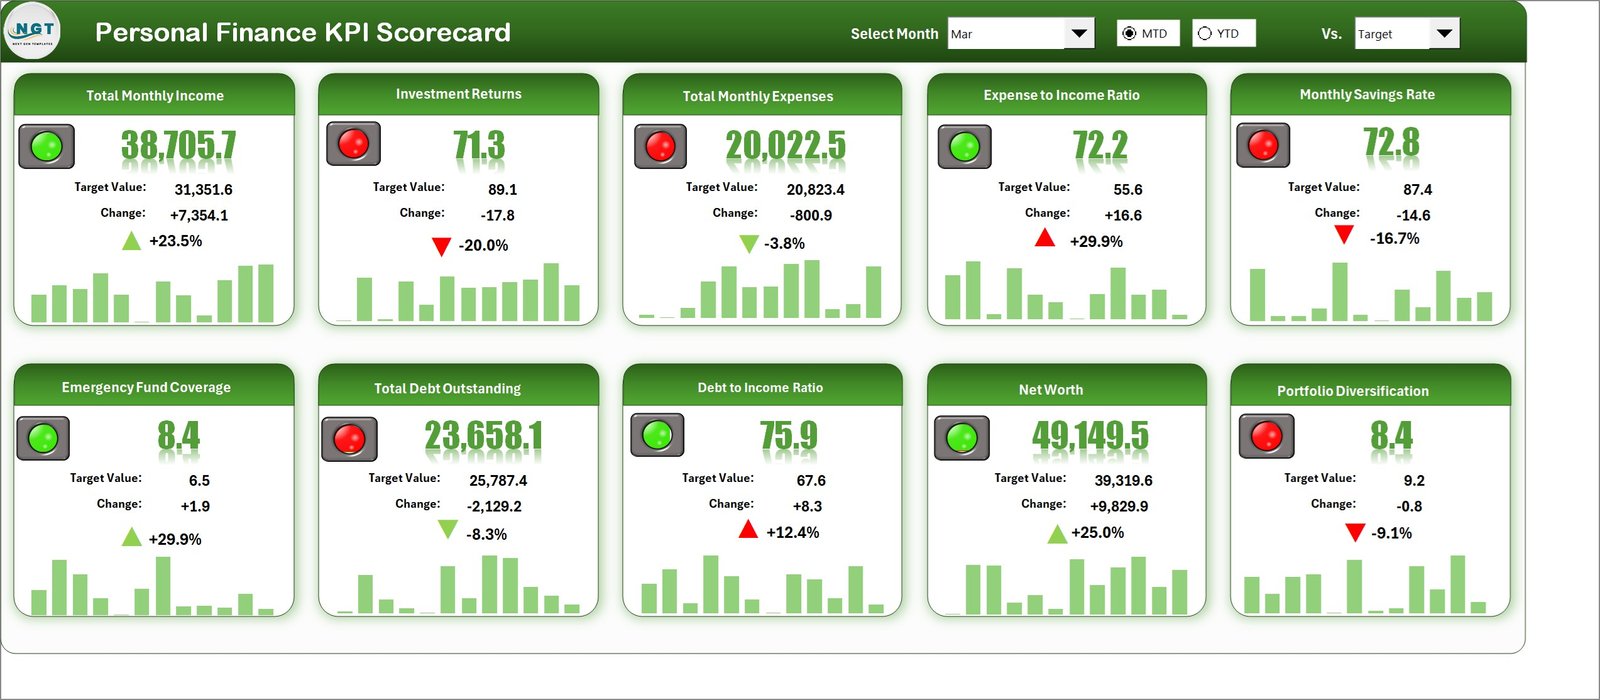
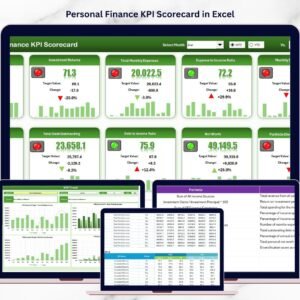
This is the main dashboard where users can view overall financial KPI performance. The sheet includes dropdown selections for Month, MTD, and YTD views. It displays Actual vs Target comparisons and visual indicators that highlight financial performance.
2️⃣ KPI Trend Sheet
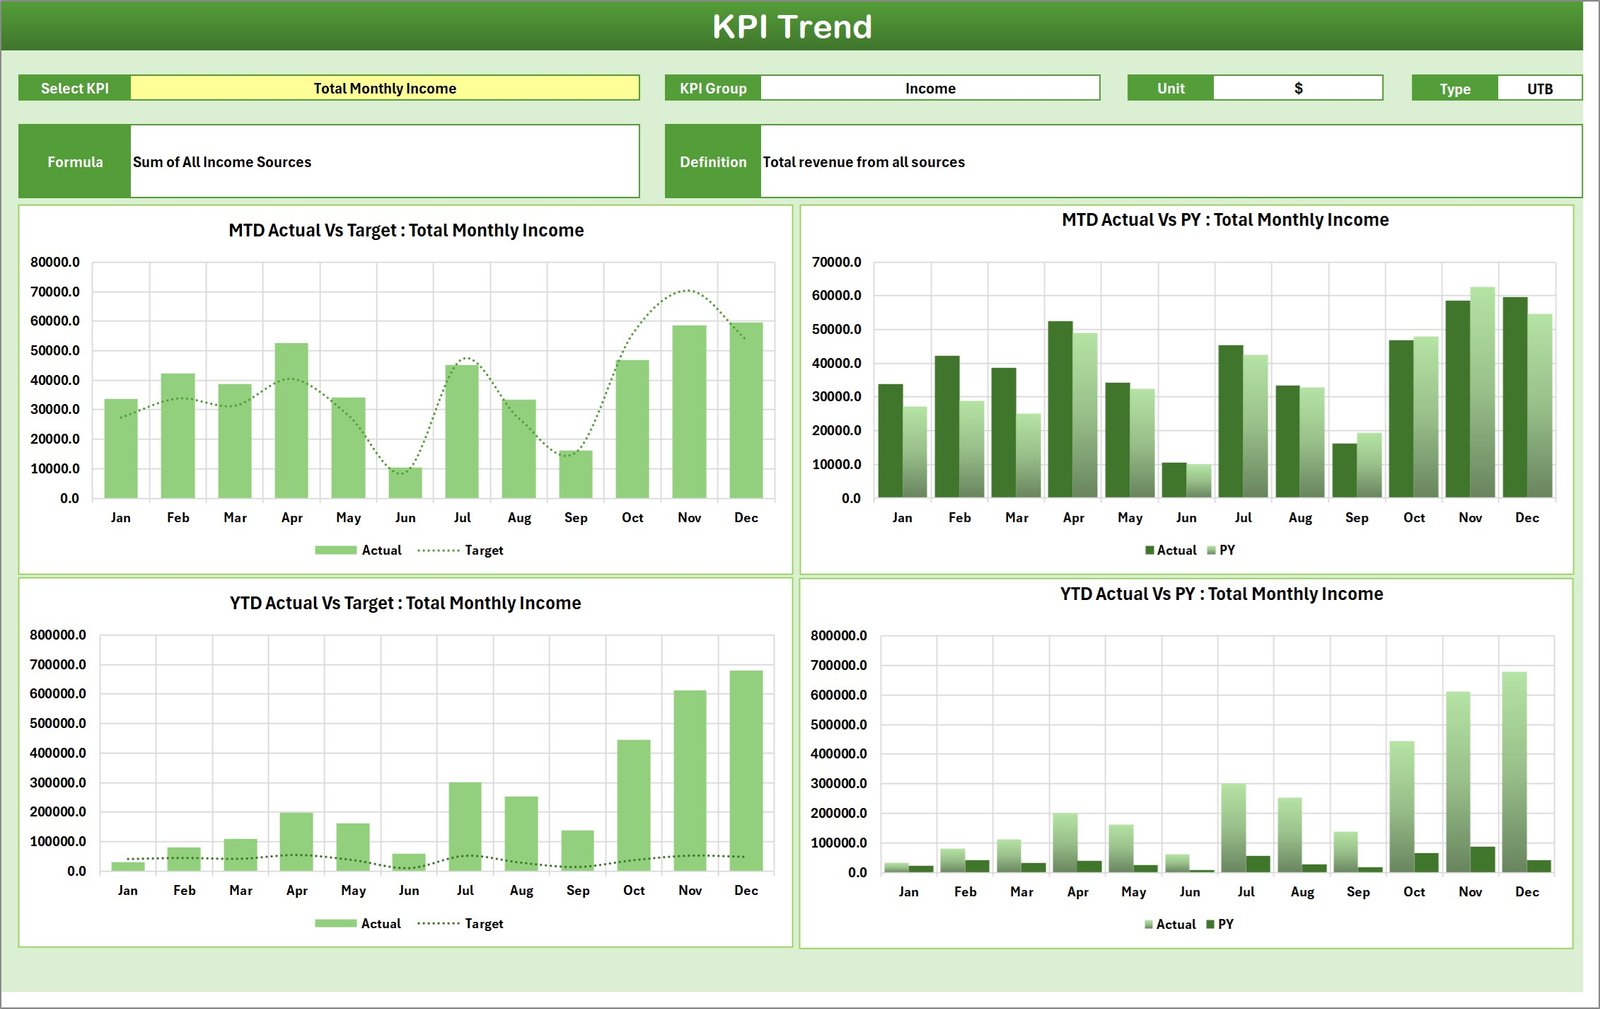
This sheet allows users to analyze financial KPI performance over time. By selecting a KPI from the dropdown menu, users can view trend charts showing MTD and YTD performance, including Actual values, Target values, and Previous Year results.
3️⃣ Input Data Sheet
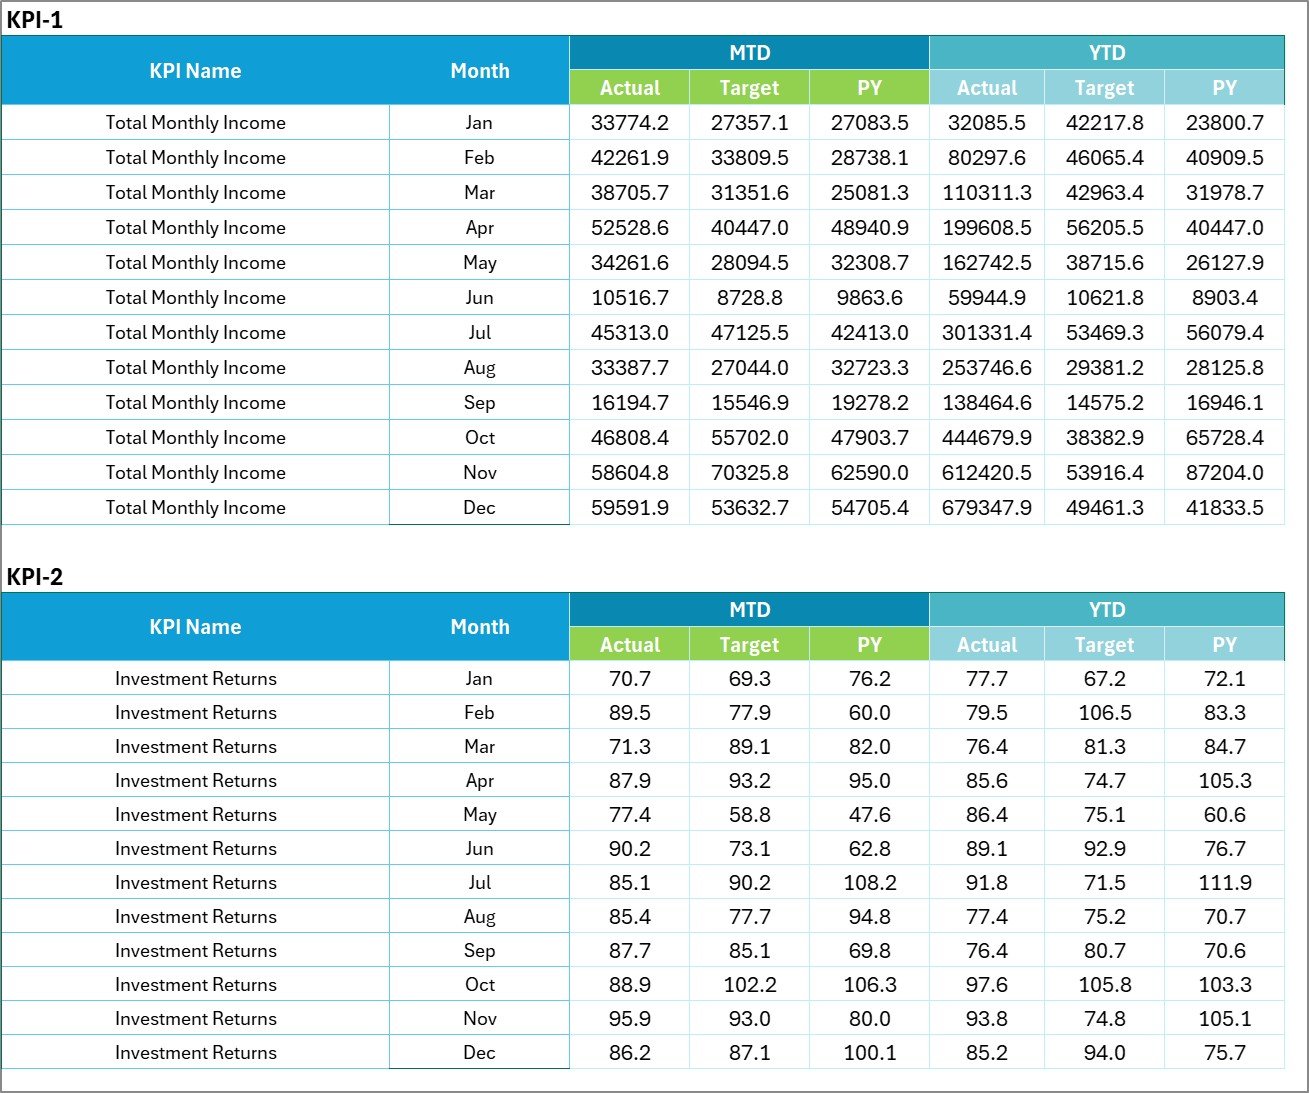
This sheet serves as the primary data entry area. Users can record financial details such as income, expenses, savings, investments, debt balances, and budget targets.
4️⃣ KPI Definition Sheet
The KPI Definition sheet explains each KPI used in the scorecard. It includes KPI Name, KPI Group, KPI Unit, KPI Formula, and KPI Definition to ensure financial metrics are clearly understood.
Together, these sheets create a powerful financial monitoring system that helps individuals track and improve their financial performance.
⚙️ How to Use the Personal Finance KPI Scorecard in Excel
Using this scorecard is simple and intuitive.
First, enter your financial data into the Input Data Sheet. This includes information such as monthly income, expenses, savings, investments, and debt balances.
Next, the Scorecard sheet automatically calculates KPIs and displays performance indicators. You can choose the reporting period using the dropdown menus for Month, MTD, or YTD analysis.
To analyze trends, go to the KPI Trend Sheet and select a specific KPI from the dropdown menu. The dashboard will display charts showing how your financial performance changes over time.
By regularly updating your financial data, you can monitor your financial progress, identify improvement areas, and stay aligned with your financial goals.
👨💼 Who Can Benefit from This Personal Finance KPI Scorecard in Excel
💰 Individuals Managing Personal Finances
Track income, spending, savings, and investments efficiently.
👨👩👧 Families Planning Household Budgets
Monitor family financial goals and spending habits.
📊 Financial Coaches and Advisors
Help clients track financial progress using KPI-based monitoring.
🎓 Students Learning Financial Management
Develop strong financial discipline and money management habits.
🏢 Small Business Owners
Track personal financial health alongside business income.
Anyone who wants better control over their financial future can benefit from this structured KPI scorecard.
Click here to read the Detailed blog post
Visit our YouTube channel to learn step-by-step video tutorials
👉 https://youtube.com/@PKAnExcelExpert
Watch the step-by-step video tutorial:
Compatibility and Requirements
- Works in Microsoft Excel desktop (Excel 2016 or later, or Microsoft 365).
- Green, yellow and red results come from conditional formatting. Microsoft explains it in Use conditional formatting to highlight information.
Frequently Asked Questions
Which financial KPIs does the scorecard track?
Savings rate, expense ratio, investment growth, debt ratio and net worth growth, among others.
Can I compare results with my targets?
Yes. The Scorecard sheet shows actual against target values for Month, MTD and YTD views, picked from dropdowns.
How do I see trends?
On the KPI Trend sheet, pick a KPI from the dropdown to see MTD and YTD charts with actual, target and previous year values.
Where do I enter my numbers?
On the Input Data sheet: income, expenses, savings, investments, debt balances and budget targets.
What does the KPI Definition sheet hold?
The KPI name, group, unit, formula and definition for every KPI, so each measure is clear.
Related Personal Finance Templates
- Personal Finance KPI Dashboard in Excel: a dashboard view of your finance KPIs
- Personal Finance Dashboard in Excel: income and spending analysis in Excel
- Personal Finance Tracker in Excel: record daily income and expenses
- Personal Finance Net Worth Tracker in Google Sheets: follow your net worth over time
- KPI Scorecard Mega Pack: 12 KPI scorecards in one download
Browse all Excel KPI dashboards or the Excel financial tools.