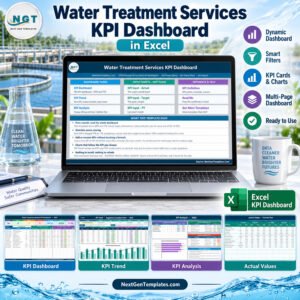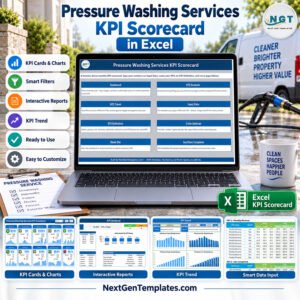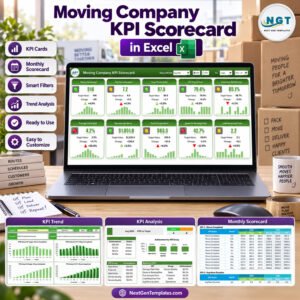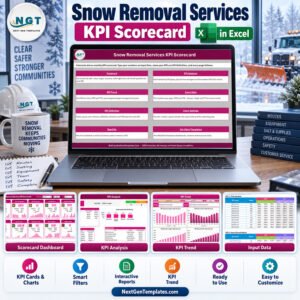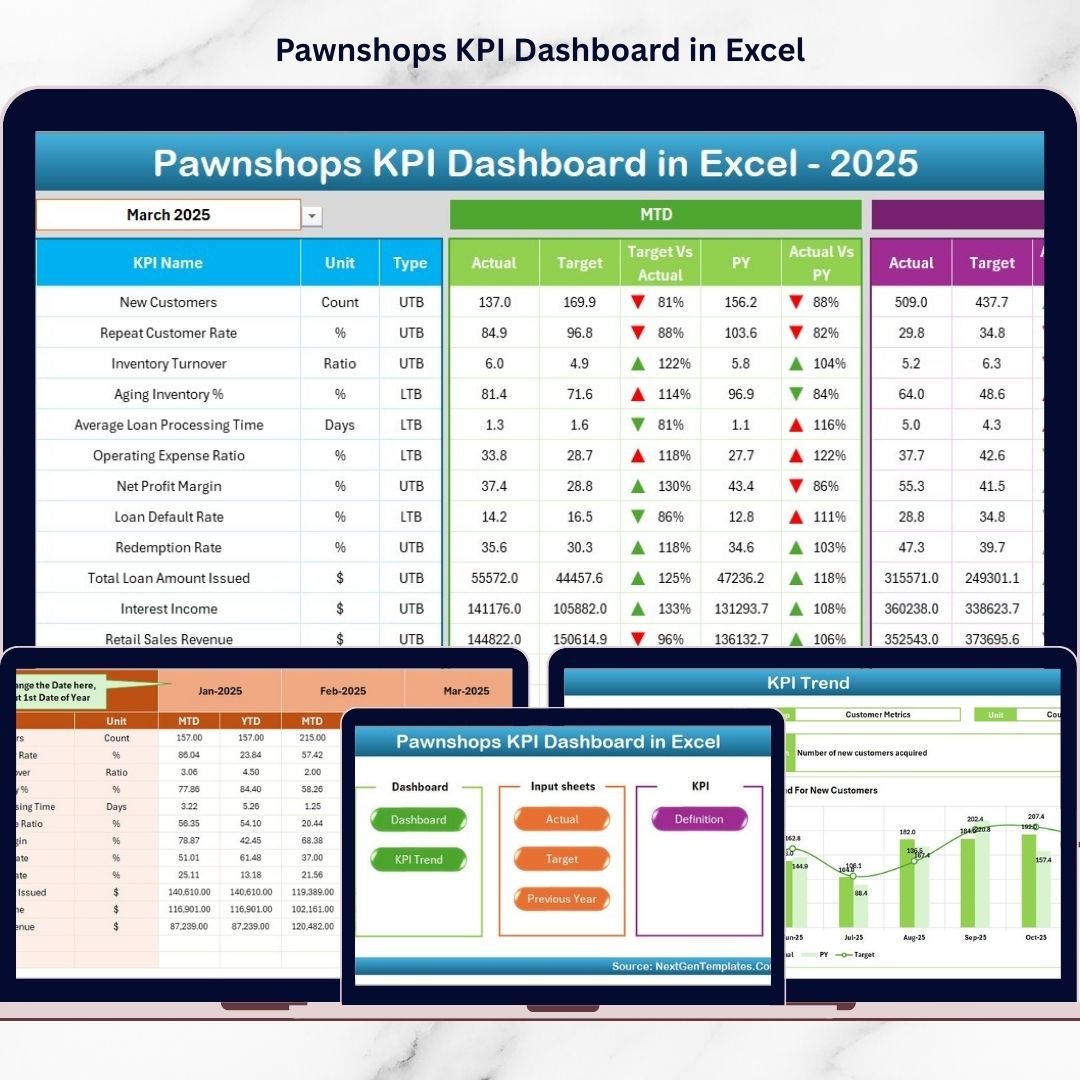

That is exactly why we created the Pawnshops KPI Dashboard in Excel — a powerful, ready-to-use performance management system built specifically for pawnshop owners and managers.
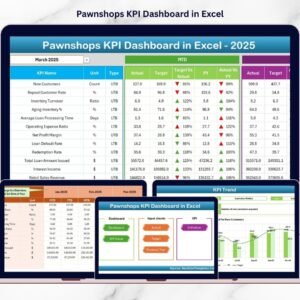
This structured Excel template centralizes all your key performance indicators into one dynamic dashboard. You can track MTD and YTD results, compare Actual vs Target, analyze Previous Year performance, and monitor risk indicators — all within seconds.
If you want better control, faster decisions, and stronger profitability, this dashboard is your solution.
🚀 Key Feature of Pawnshops KPI Dashboard in Excel
This dashboard includes 7 structured worksheets designed to simplify KPI tracking and business monitoring.
🏠 Home Sheet – Interactive navigation center with clickable buttons for quick access.
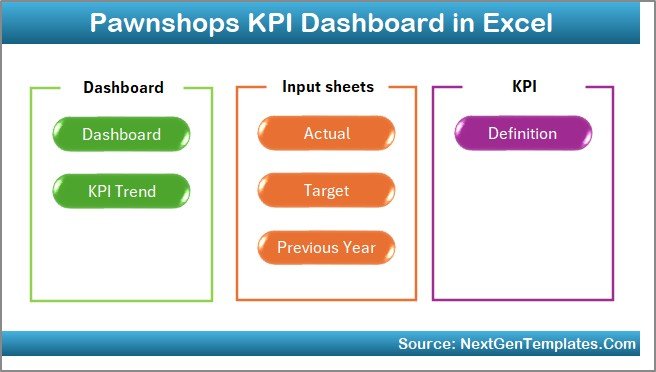
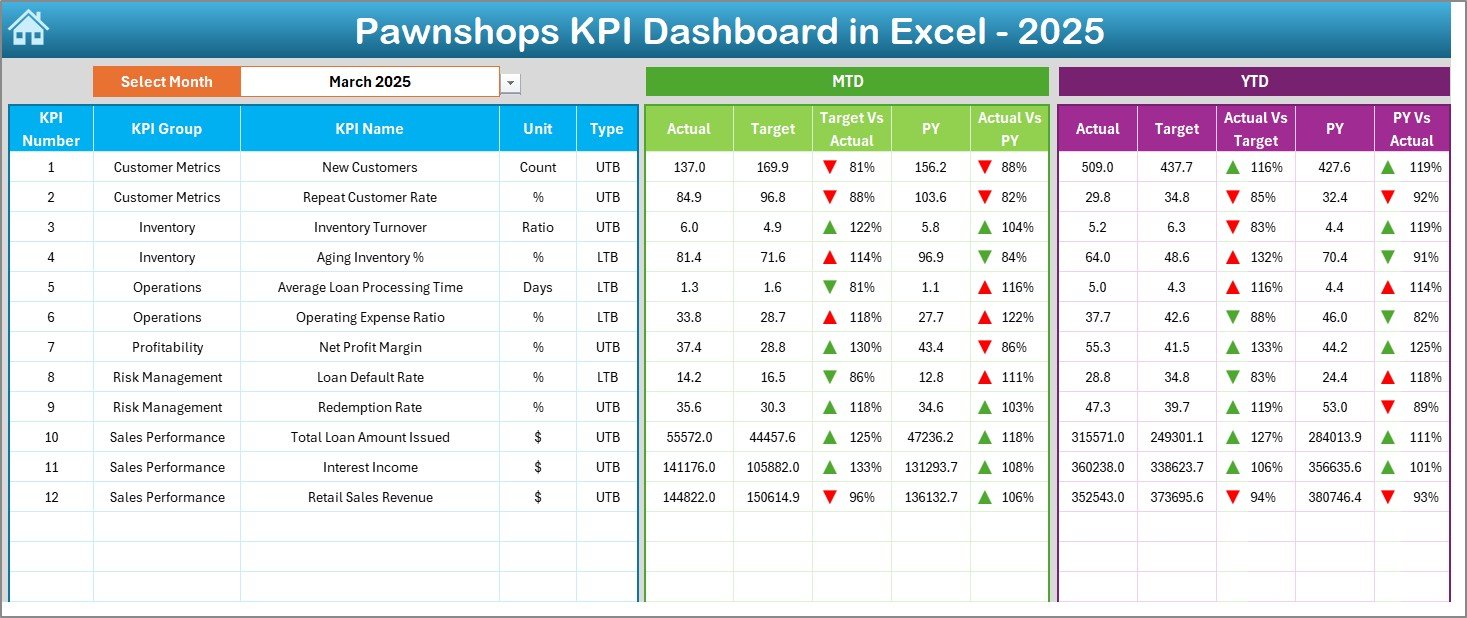
📊 Dashboard Sheet – Main performance view with Month Selector (Cell D3), MTD & YTD analysis, and visual indicators.
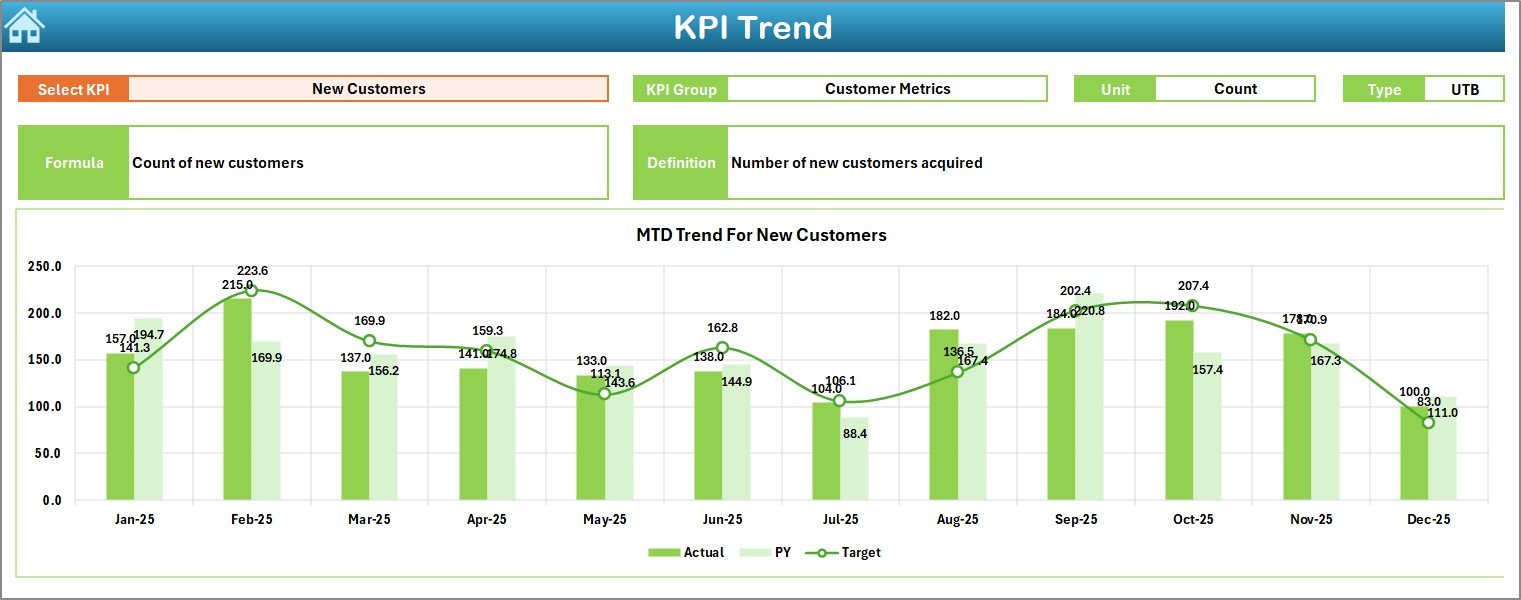
📈 KPI Trend Sheet – Deep KPI analysis with trend charts for Actual, Target, and Previous Year.
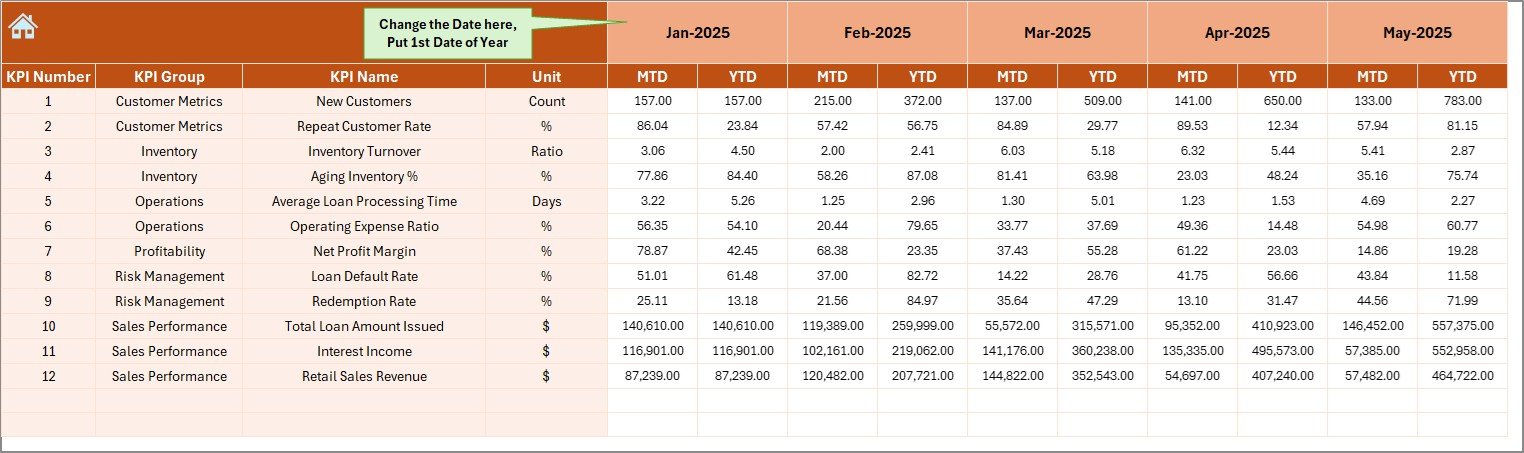
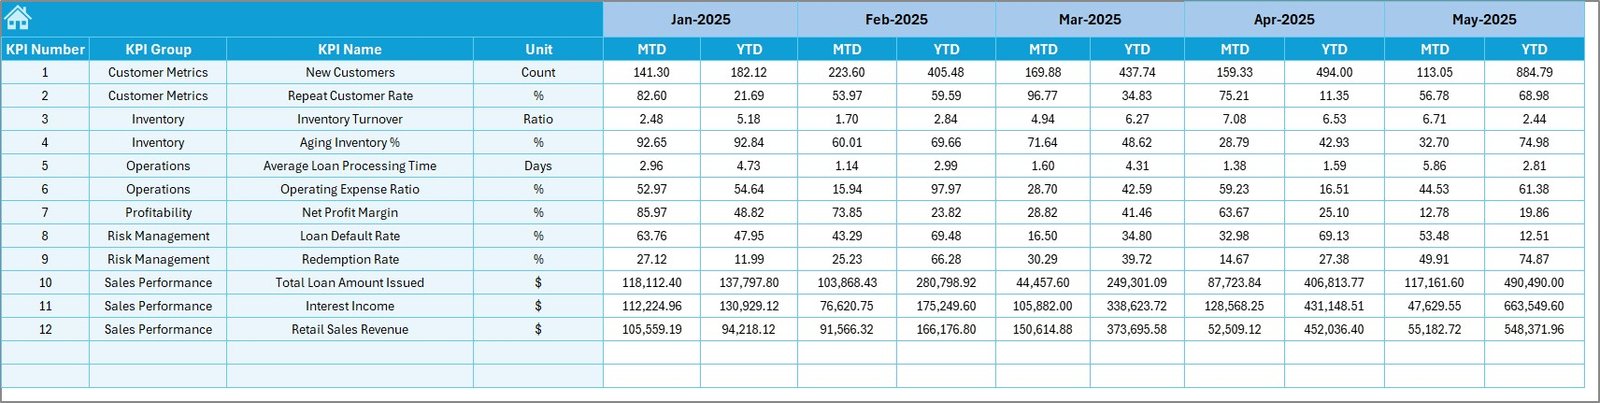
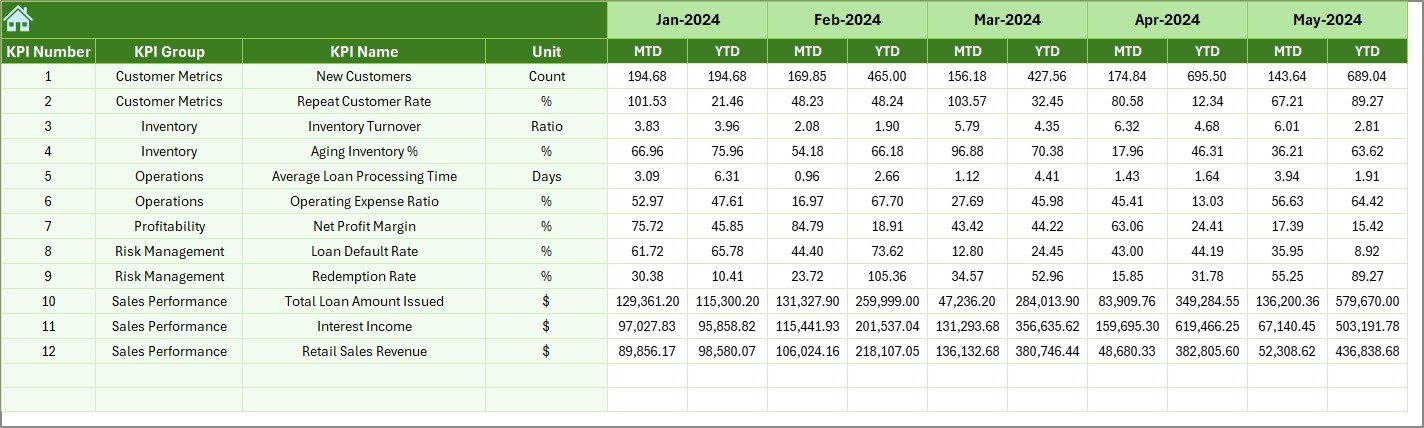
📝 Actual Numbers Input Sheet – Structured data entry page with controlled monthly setup.
🎯 Target Sheet – Define monthly MTD and YTD goals clearly.
📅 Previous Year Sheet – Year-on-year comparison for strategic planning.
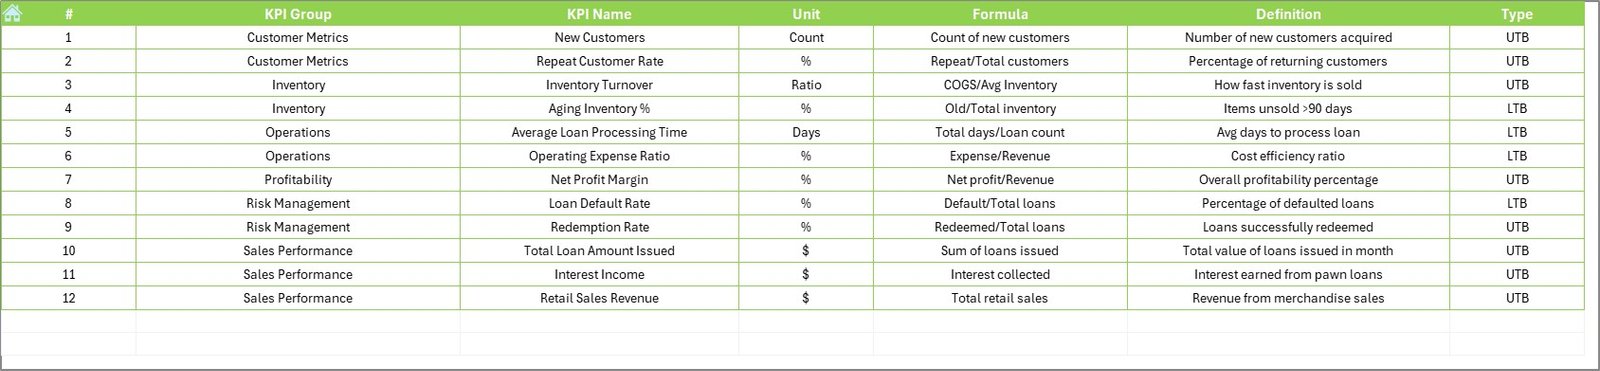
📘 KPI Definition Sheet – Define KPI Name, Unit, Formula, Group, and Type (LTB/UTB).
Because everything is interconnected, your dashboard updates automatically when you select a month.
📦 What’s Inside the Pawnshops KPI Dashboard in Excel
This ready-to-use workbook includes:
✔ Dynamic Month Selection (Cell D3)
✔ Automated MTD & YTD calculations
✔ Target vs Actual comparison
✔ Previous Year vs Current Year analysis
✔ Conditional formatting (Green ▲ / Red ▼ indicators)
✔ Visual KPI trend charts
✔ Structured data input sheets
✔ Fully customizable KPI framework
You only update data in input sheets. The dashboard handles the calculations and visuals.
🛠 How to Use the Pawnshops KPI Dashboard in Excel
Using the dashboard is simple:
1️⃣ Set the first month of the financial year in the Actual Input sheet (Cell E1).
2️⃣ Enter MTD and YTD actual values monthly.
3️⃣ Define targets in the Target sheet.
4️⃣ Add previous year data for comparison.
5️⃣ Select the desired month from Cell D3 in the Dashboard.
Instantly, the dashboard refreshes.
For example:
If Default Rate increases, the red arrow alerts you immediately.
If Loan Redemption Rate improves compared to last year, the green arrow confirms progress.
If Inventory Holding Days increase, you can investigate cash flow impact quickly.
Because everything is visual and automated, decision-making becomes faster.
👥 Who Can Benefit from This Pawnshops KPI Dashboard in Excel
This dashboard is ideal for:
💼 Independent Pawnshop Owners
🏪 Multi-Branch Pawnshop Chains
📊 Finance Managers
📈 Operations Managers
👨💼 Business Analysts
Whether you operate a single branch or manage multiple locations, this dashboard improves:
✔ Loan performance monitoring
✔ Risk management
✔ Profit margin control
✔ Inventory turnover tracking
✔ Customer behavior analysis
When you measure performance clearly, growth becomes structured.
💰 How This Dashboard Improves Profitability
Profitability in pawnshops depends on controlling defaults, improving redemption rates, and optimizing inventory turnover.
This dashboard helps you:
Monitor default ratios early
Improve loan recovery performance
Track inventory holding days
Compare branch-level results
Measure profit margins monthly
Instead of reacting to financial stress, you prevent it.
And prevention protects your cash flow.
Click hare to read the Detailed blog post
Visit our YouTube channel to learn step-by-step video tutorials
Watch the step-by-step video tutorial:
Compatibility and Requirements
- Works in Microsoft Excel desktop (Excel 2016 or later, or Microsoft 365).
- The Dashboard sheet has a month selector in cell D3, and the trend charts update when you change it. Microsoft explains charts in Create a chart from start to finish.
Frequently Asked Questions
How many worksheets does the dashboard have?
Seven: Home, Dashboard, KPI Trend, Actual Numbers Input, Target, Previous Year and KPI Definition.
How do I change the month shown on the dashboard?
Select the month in cell D3 on the Dashboard sheet. The MTD and YTD figures, the arrows and the charts update from your input sheets.
Where do I enter my data?
Enter MTD and YTD actuals in the Actual Numbers Input sheet, your goals in the Target sheet and last year’s figures in the Previous Year sheet. Set the first month of your financial year in cell E1 of the Actual Numbers Input sheet.
How do I know when a KPI is off target?
Conditional formatting shows a green up arrow or a red down arrow next to each KPI, so you can see at once where results are behind target or last year.
Can I change the KPIs?
Yes. The KPI Definition sheet holds each KPI’s name, unit, formula, group and type (Lower the Better or Upper the Better), and you can edit them to fit your shop.
Is there a Power BI version?
Yes. See the Pawnshops KPI Dashboard in Power BI.
Related KPI Dashboard Templates
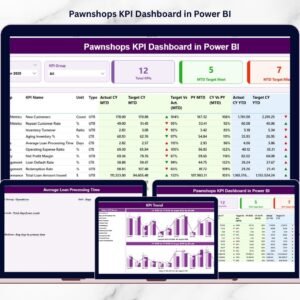
- Pawnshops KPI Dashboard in Power BI: the same pawnshop KPIs in Power BI
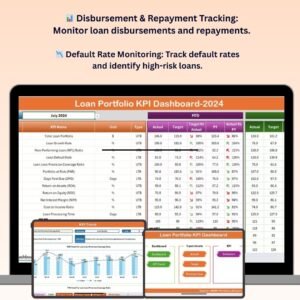
- Loan Portfolio KPI Dashboard in Excel: loan performance tracking in Excel
- Warehouse Management KPI Dashboard in Excel: stock and inventory KPIs
- KPI Dashboard Library (Excel): 15 Excel KPI dashboards in one download
Browse all Excel KPI dashboards.