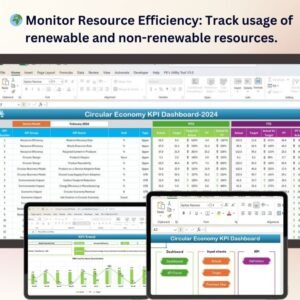
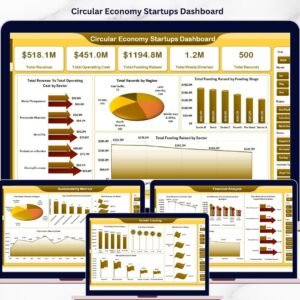
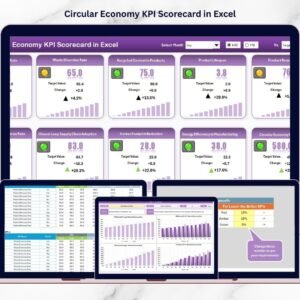
Organizations today are moving beyond traditional profit-focused strategies and embracing sustainability-driven business models. Companies now measure success not only through financial performance but also through environmental responsibility, resource efficiency, and waste reduction. However, tracking sustainability performance without a structured system often becomes complex and time-consuming.That is where the Circular Economy KPI Scorecard in Excel becomes a game-changing solution.This ready-to-use Excel template helps organizations monitor circular economy performance using clearly defined KPIs, automated calculations, and interactive dashboards. Instead of managing scattered spreadsheets, businesses can track sustainability metrics in one centralized and easy-to-understand scorecard.
Designed for simplicity and performance, this tool enables organizations to measure environmental impact, evaluate progress, and make data-driven sustainability decisions — all within Microsoft Excel.
🚀 Key Feature of Circular Economy KPI Scorecard in Excel
✅ Interactive KPI Scorecard Dashboard – Monitor sustainability KPIs from one dynamic screen with instant performance visibility.
✅ MTD & YTD Analysis – Switch between Month-to-Date and Year-to-Date views using simple dropdown selections.
✅ Actual vs Target Comparison – Quickly identify performance gaps and improvement opportunities.
✅ Conditional Formatting Indicators – Visual color coding instantly highlights KPI status.
✅ KPI Trend Analysis – Analyze historical performance using automated trend charts.
✅ Centralized Data Entry System – Enter data once and automatically update the entire dashboard.
✅ Standardized KPI Documentation – Maintain clear KPI definitions and formulas for transparency.

✅ Flexible KPI Customization – Modify KPIs easily based on organizational or industry needs.
📦 What’s Inside the Circular Economy KPI Scorecard in Excel
This professionally designed Excel workbook includes four structured worksheets:
1️⃣ Scorecard Sheet (Main Dashboard)
The central performance view displaying all KPIs with MTD and YTD comparisons, targets, and visual indicators.
2️⃣ KPI Trend Sheet
Dynamic trend analysis with selectable KPIs, showing Actual vs Target vs Previous Year comparisons through charts.
3️⃣ Input Data Sheet
A structured data entry area where users update monthly KPI values and targets efficiently.
4️⃣ KPI Definition Sheet
A documentation hub containing KPI names, formulas, units, and definitions to ensure consistency across teams.
Together, these sheets create a complete sustainability performance management system.
⚙️ How to Use the Circular Economy KPI Scorecard in Excel
Using the template is simple and requires no advanced technical skills:
Define KPIs in the KPI Definition sheet.
Enter targets and actual values in the Input Data sheet.
Select the reporting month or YTD view.
Review KPI performance instantly on the Scorecard dashboard.
Analyze trends using the KPI Trend sheet.
Take corrective actions based on insights.
Because calculations and visuals are automated, users spend less time preparing reports and more time improving sustainability outcomes.
👥 Who Can Benefit from This Circular Economy KPI Scorecard in Excel
This template is ideal for organizations and professionals focused on sustainability and performance improvement:
🌱 Sustainability Managers
📊 ESG Analysts
🏭 Manufacturing Organizations
♻️ Recycling & Waste Management Companies
⚡ Energy & Utilities Firms
📦 Logistics & Supply Chain Teams
🏢 Corporate Strategy Departments
📈 Business Analysts & Consultants
Whether a company is starting its sustainability journey or enhancing ESG reporting, this scorecard provides a practical and scalable solution.
By implementing this KPI scorecard, organizations gain improved transparency, stronger accountability, and clearer performance insights. Excel’s flexibility ensures easy adoption without expensive software investments, making sustainability tracking accessible for businesses of all sizes.
Ultimately, the Circular Economy KPI Scorecard in Excel transforms complex environmental metrics into actionable insights, helping organizations align operational performance with long-term sustainability goals.
Click here to read the Detailed blog post
Watch the step-by-step video tutorial:
Visit our YouTube channel to learn step-by-step video tutorials
https://Youtube.com/@PKAnExcelExpert
Compatibility and Requirements
- Works in Microsoft Excel desktop (Excel 2016 or later, or Microsoft 365).
- You pick the reporting month and the KPI from dropdown lists, and conditional formatting colors each KPI by status. Microsoft explains the feature in Use conditional formatting to highlight information in Excel.
Frequently Asked Questions
Which sheets are included?
Four sheets: Scorecard, KPI Trend, Input Data and KPI Definition.
How do I update the scorecard?
Enter your monthly actual values and targets in the Input Data sheet. Then select the reporting month or the YTD view on the Scorecard sheet and it updates.
Can I switch between month-to-date and year-to-date views?
Yes. Use the dropdown selection on the Scorecard sheet to switch between MTD and YTD.
How do I see the trend for one KPI?
Open the KPI Trend sheet and select a KPI. The charts compare Actual, Target and Previous Year.
Can I change the KPIs?
Yes. The KPI Definition sheet holds the KPI names, formulas, units and definitions, and you can edit them to fit your organization or industry.
Is there a dashboard version of this template?
Yes. See the Circular Economy KPI Dashboard in Excel, the Google Sheets edition and the Power BI edition.
Related Sustainability and KPI Scorecard Templates
- Circular Economy KPI Dashboard in Excel: circular economy KPIs in a dashboard format
- Circular Economy KPI Dashboard in Google Sheets: the Google Sheets edition
- Circular Economy KPI Dashboard in Power BI: the Power BI edition
- Environmental KPI Scorecard in Excel: a scorecard for environmental metrics
- Energy KPI Scorecard in Excel: a scorecard for energy performance
Browse all Excel KPI dashboards or see the Template Bundles.