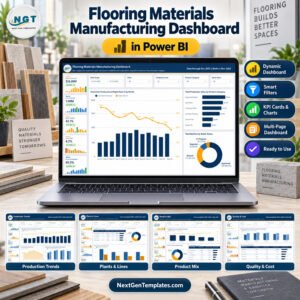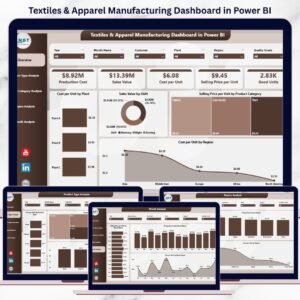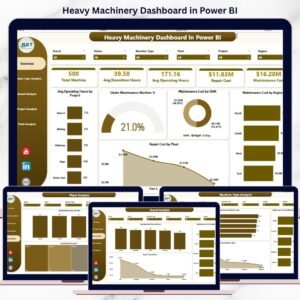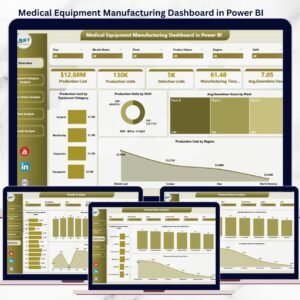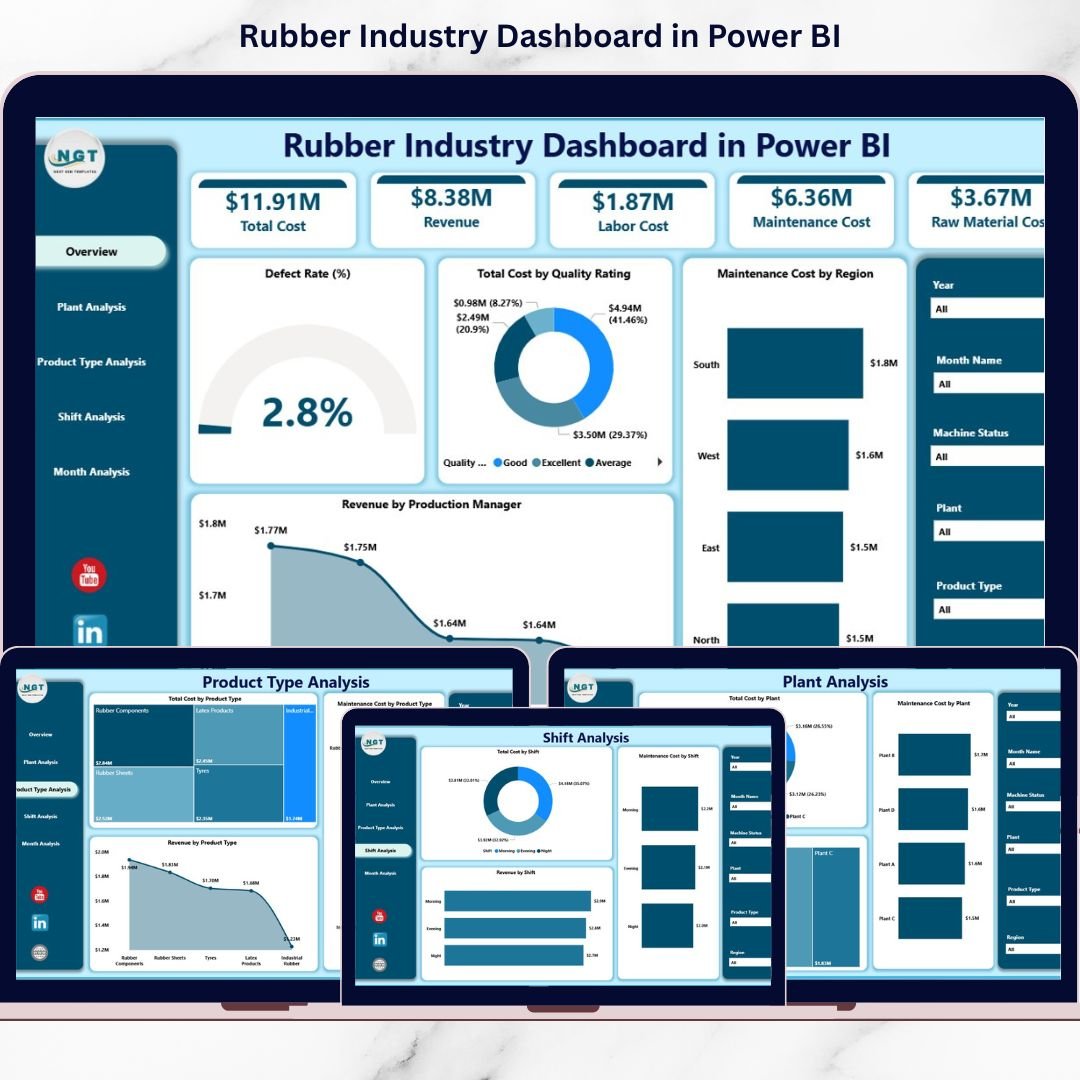

This ready-to-use Power BI solution transforms raw production and financial data into real-time, drill-down insights. Instead of waiting for manual reports, you can filter, analyze, and act instantly.
🚀 Key Feature of Rubber Industry Dashboard in Power BI
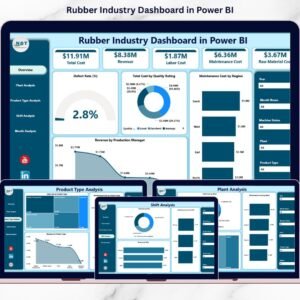
📊 5 Fully Interactive Dashboard Pages – Overview, Plant, Product Type, Shift, and Month Analysis.
📈 Executive KPI Cards – Instant visibility into defect rate, cost, and revenue.
🏭 Multi-Plant Performance Tracking – Compare profitability and maintenance efficiency.
📦 Product-Level Profitability Insights – Identify high-margin product categories.
🔧 Maintenance Cost Monitoring – Detect rising downtime and equipment issues.
👨🏭 Shift Productivity Analysis – Evaluate cost and revenue by shift.
📅 Monthly Trend Tracking – Forecast seasonal performance changes.
🎛 Dynamic Slicers & Drill-Down – Filter by Plant, Product, Region, Shift, and Month.
⚡ Real-Time Data Refresh – Always work with updated insights.
📦 What’s Inside the Rubber Industry Dashboard in Power BI
This professional Power BI Desktop file includes 5 structured analytical pages, designed specifically for rubber manufacturers.
1️⃣ Overview Page – The Executive Command Center
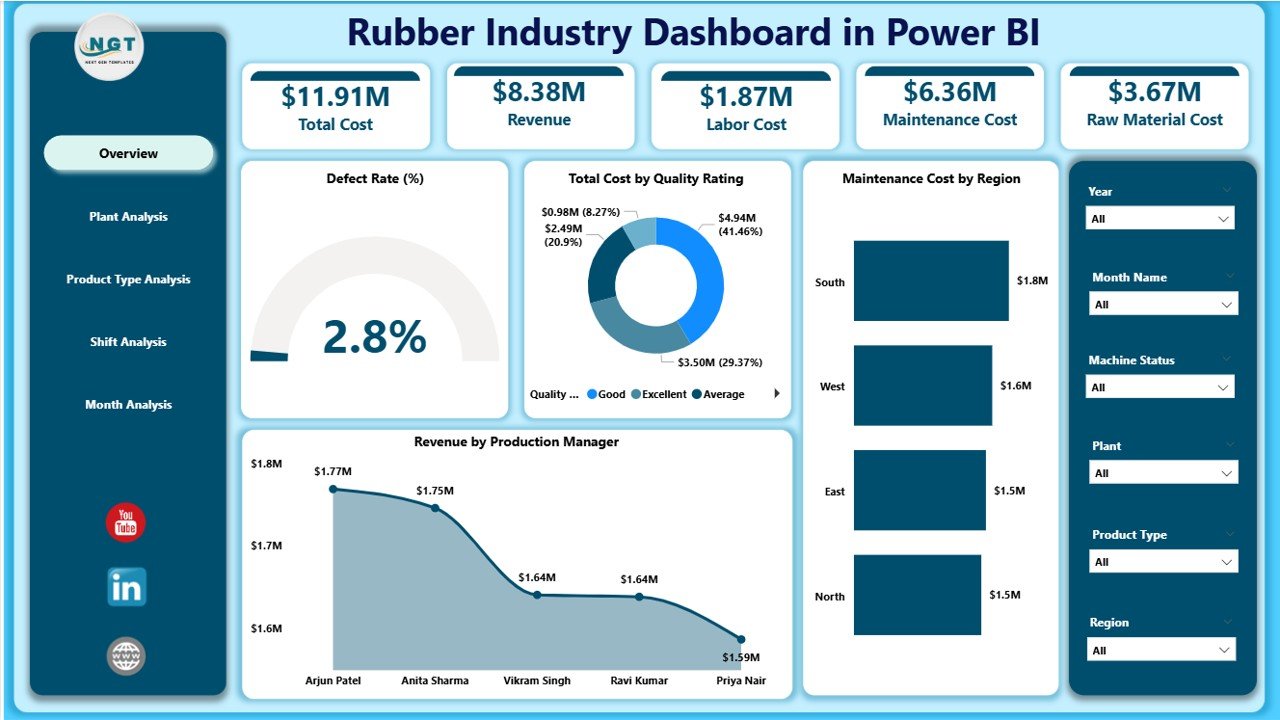
The first page delivers a high-level operational snapshot.
✔ Interactive Slicers
Plant
Product Type
Region
Shift
Month
✔ KPI Cards
Defect Rate %
Total Cost by Quality Rating
Maintenance Cost by Region
Revenue by Production Manager
Overall Financial Snapshot
✔ Core Visuals
Maintenance & Quality Performance
Revenue Breakdown
Cost Distribution
Executives can instantly detect rising defect rates or cost spikes — and act immediately.
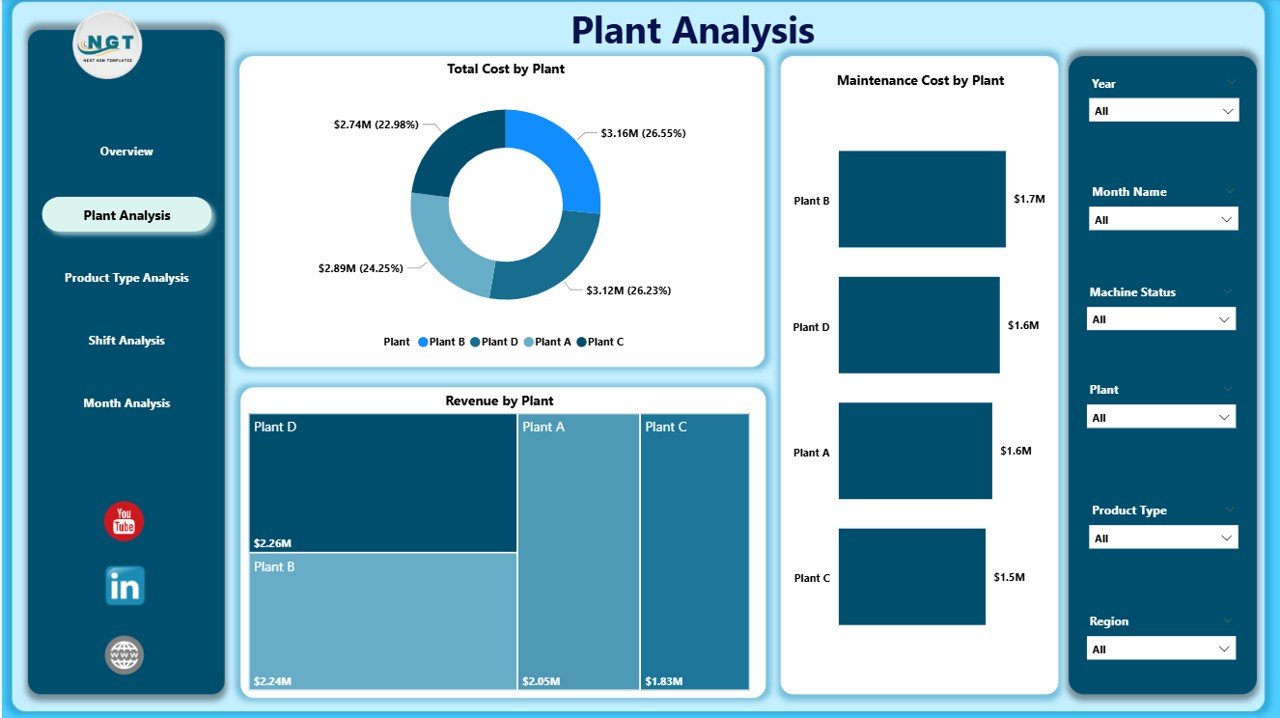
2️⃣ Plant Analysis – Compare Manufacturing Units
Track plant-level performance in detail.
✔ Total Cost by Plant
✔ Maintenance Cost by Plant
✔ Revenue by Plant
Identify high-cost plants, compare operational efficiency, and optimize resource allocation across locations.
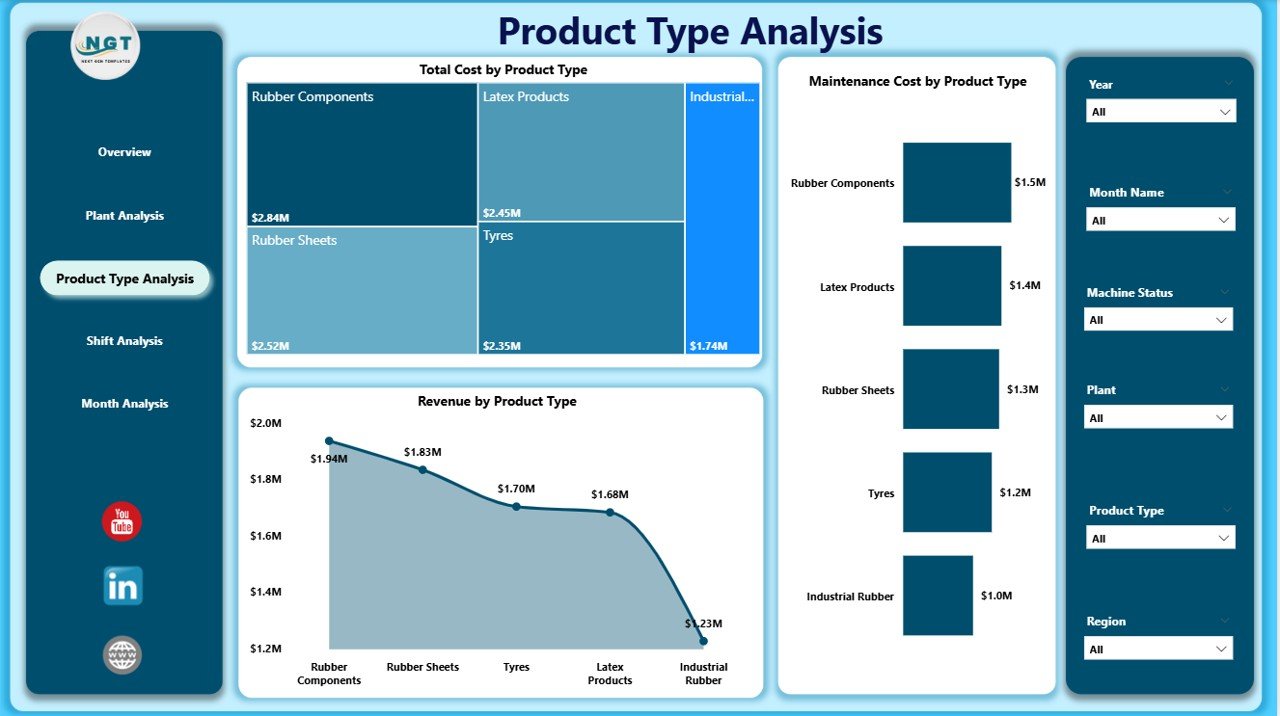
3️⃣ Product Type Analysis – Which Products Drive Profit?
Analyze performance across categories like:
Tires
Industrial Rubber Sheets
Rubber Belts
Seals & Gaskets
Automotive Components
✔ Total Cost by Product Type
✔ Maintenance Cost by Product Type
✔ Revenue by Product Type
Focus on profitable products. Improve pricing strategy. Eliminate low-margin items.
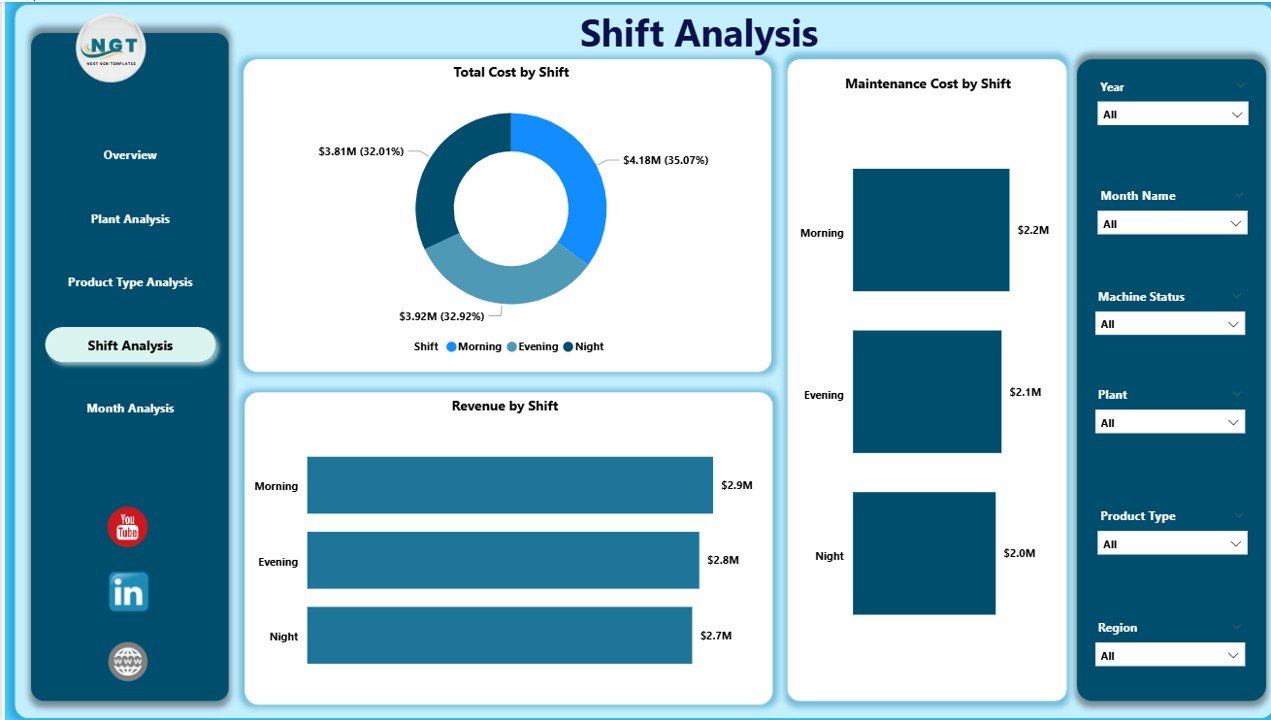
4️⃣ Shift Analysis – Optimize Workforce Productivity
Manufacturing shifts often perform differently.
✔ Total Cost by Shift
✔ Maintenance Cost by Shift
✔ Revenue by Shift
Identify underperforming shifts. Improve supervision. Reduce waste and downtime.
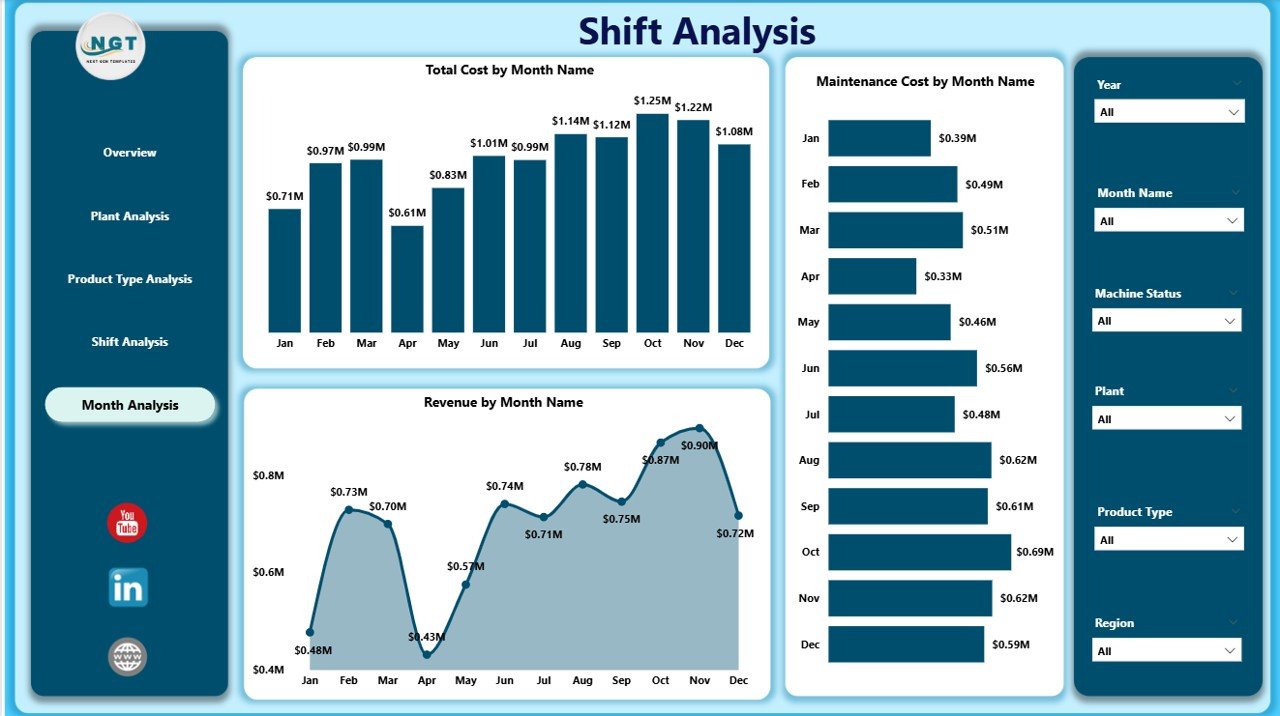
5️⃣ Month Analysis – Monitor Performance Trends
✔ Total Cost by Month
✔ Maintenance Cost by Month
✔ Revenue by Month
Detect seasonal fluctuations. Plan budgets better. Forecast revenue accurately.
🛠 How to Use the Rubber Industry Dashboard in Power BI
1️⃣ Import structured production data
2️⃣ Connect ERP or Excel data source
3️⃣ Refresh Power BI model
4️⃣ Apply slicers to filter analysis
5️⃣ Review Overview page
6️⃣ Drill into plant, product, or shift details
7️⃣ Take data-driven action
Within minutes, you gain complete production clarity.
👥 Who Can Benefit from This Dashboard?
✔ Plant Managers
✔ Production Heads
✔ Quality Control Teams
✔ Maintenance Supervisors
✔ Finance Managers
✔ Operations Directors
✔ Business Owners
Whether you manage a single plant or multiple facilities, this dashboard centralizes control.
📊 Key Metrics You Can Track
Defect Rate %
Production Volume
Maintenance Cost
Cost per Unit
Revenue per Product Type
Downtime Hours
Quality Rating Score
Yield Percentage
Shift Productivity
Monthly Revenue Trends
These KPIs directly impact profitability and operational efficiency.
💰 How This Dashboard Improves Profitability
When you monitor:
✔ Defect rates in real time
✔ Maintenance cost trends
✔ Shift productivity gaps
✔ Product-level margins
✔ Plant performance differences
You reduce waste.
You minimize downtime.
You optimize production planning.
You increase profit margins.
Data clarity drives manufacturing excellence.
🔥 Advantages of Rubber Industry Dashboard in Power BI
✅ Real-Time Decision Making
✅ Centralized Operational Visibility
✅ Improved Cost Control
✅ Better Quality Monitoring
✅ Increased Accountability
✅ Faster Executive Reporting
✅ Multi-Plant Scalability
✅ ERP & Excel Integration
✅ Mobile-Friendly Access
Power BI makes industrial analytics powerful and simple.
Best Practices for Maximum Results
✔ Schedule automatic data refresh
✔ Define clear and measurable KPIs
✔ Avoid cluttered visuals
✔ Train managers on drill-down usage
✔ Monitor defect rate weekly
✔ Review plant performance monthly
✔ Validate ERP data accuracy
Consistency ensures reliable decision-making.
Click here to read the Detailed blog post
Visit our YouTube channel to learn step-by-step video tutorials
YouTube Channel
Watch the step-by-step video tutorial:
Compatibility and Requirements
- Works in Power BI Desktop, which is free to download. Microsoft explains how to get it in Get Power BI Desktop.
- The data source can be Excel or an ERP system.
Frequently Asked Questions
How many pages does the dashboard have?
Five pages: Overview, Plant Analysis, Product Type Analysis, Shift Analysis and Month Analysis.
Which filters can I use?
Slicers for Plant, Product Type, Region, Shift and Month. They are on the Overview page and you can drill down from there.
Which KPIs are on the Overview page?
Defect Rate %, Total Cost by Quality Rating, Maintenance Cost by Region and Revenue by Production Manager.
Can I compare plants and shifts?
Yes. The Plant Analysis and Shift Analysis pages show total cost, maintenance cost and revenue for each plant and each shift.
Can I connect my own data?
Yes. Connect an ERP or Excel data source, then refresh the Power BI model.
Is there an Excel version of this dashboard?
Yes. See the Rubber Industry Dashboard in Excel.
Related Rubber Industry Templates
- Rubber Industry Dashboard in Excel: the same dashboard for Excel users
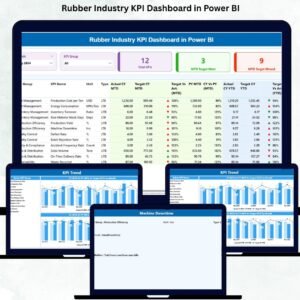
- Rubber Industry KPI Dashboard in Power BI: a KPI-focused Power BI edition for rubber plants
- Rubber Industry KPI Dashboard in Excel: rubber industry KPIs in Excel
- Textile Industry KPI Dashboard in Power BI: a manufacturing KPI dashboard for another industry
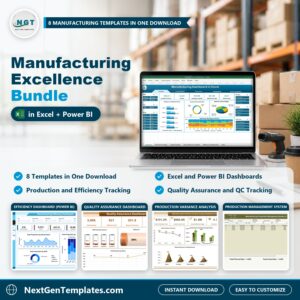
- Manufacturing Excellence Bundle: 8 manufacturing templates in one download
Browse all Power BI dashboards.