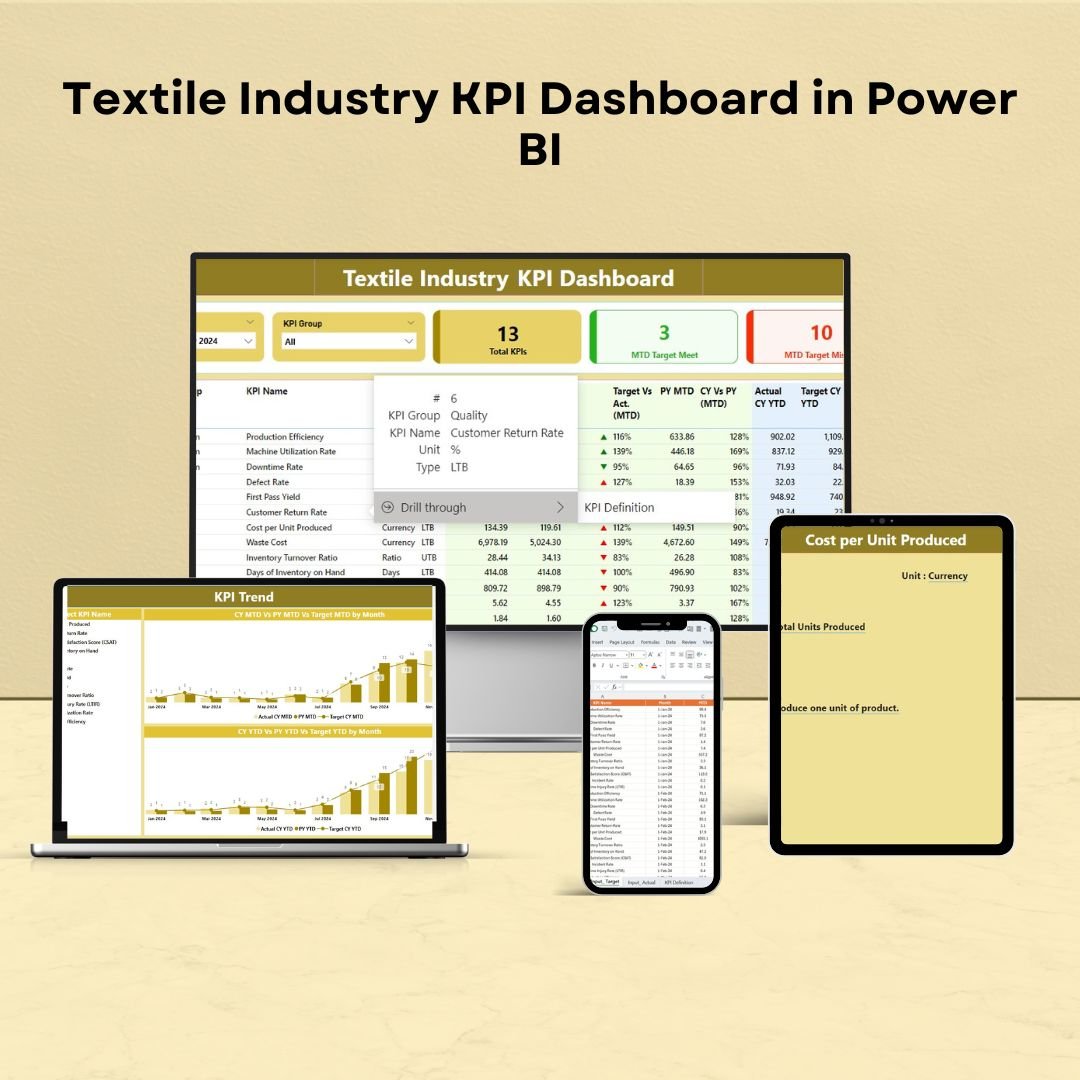


The Textile Industry KPI Dashboard in Power BI is a comprehensive tool designed specifically for textile manufacturers, producers, and suppliers to monitor key performance indicators (KPIs) across various stages of the textile production process. This Power BI dashboard provides real-time data visualizations, enabling textile businesses to track operational efficiency, monitor production costs, assess quality, and optimize supply chain performance.
The dashboard integrates data from various sources, allowing you to visualize critical metrics such as production yield, defect rates, inventory levels, and on-time deliveries. It’s a valuable resource for decision-makers in the textile industry, helping them drive performance improvements, reduce waste, and ensure timely delivery of high-quality products.
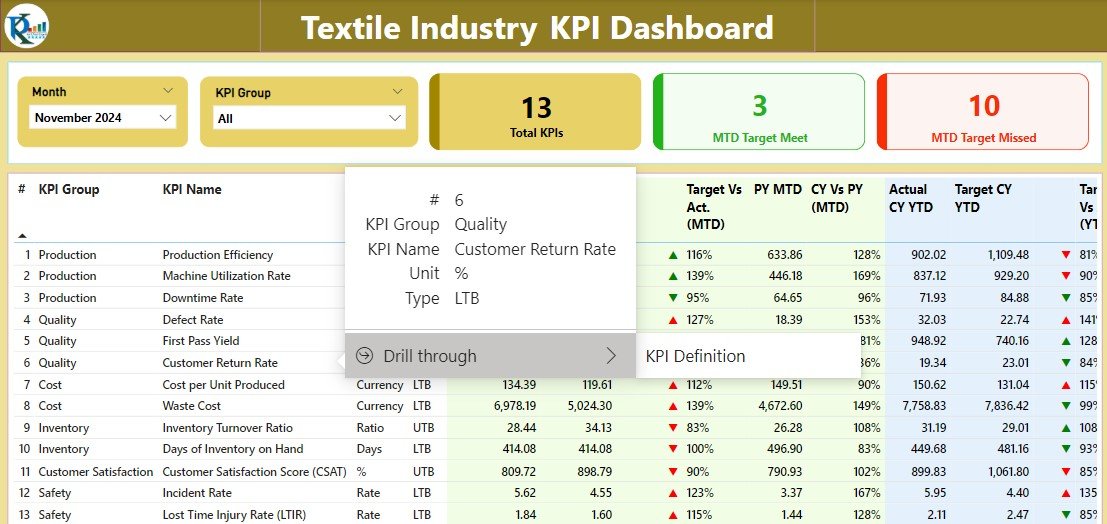
Key Features of the Textile Industry KPI Dashboard in Power BI
📊 Production Efficiency Tracking
Track key metrics related to production, such as machine uptime, production rates, and yield. Identify bottlenecks and optimize processes to improve production efficiency.
📉 Quality Control Monitoring
Monitor defect rates, rework times, and product quality to ensure your textiles meet industry standards and customer expectations. Make data-driven decisions to enhance quality control processes.
📈 Inventory & Supply Chain Management
Track inventory levels, raw material usage, and product stock across multiple stages of production. Monitor on-time deliveries, reducing stockouts and ensuring that production stays on track.
⏱ Cycle Time & Delivery Performance
Track production cycle times, order lead times, and on-time delivery rates to ensure that products are manufactured and delivered efficiently. Identify opportunities to reduce delays and improve customer satisfaction.
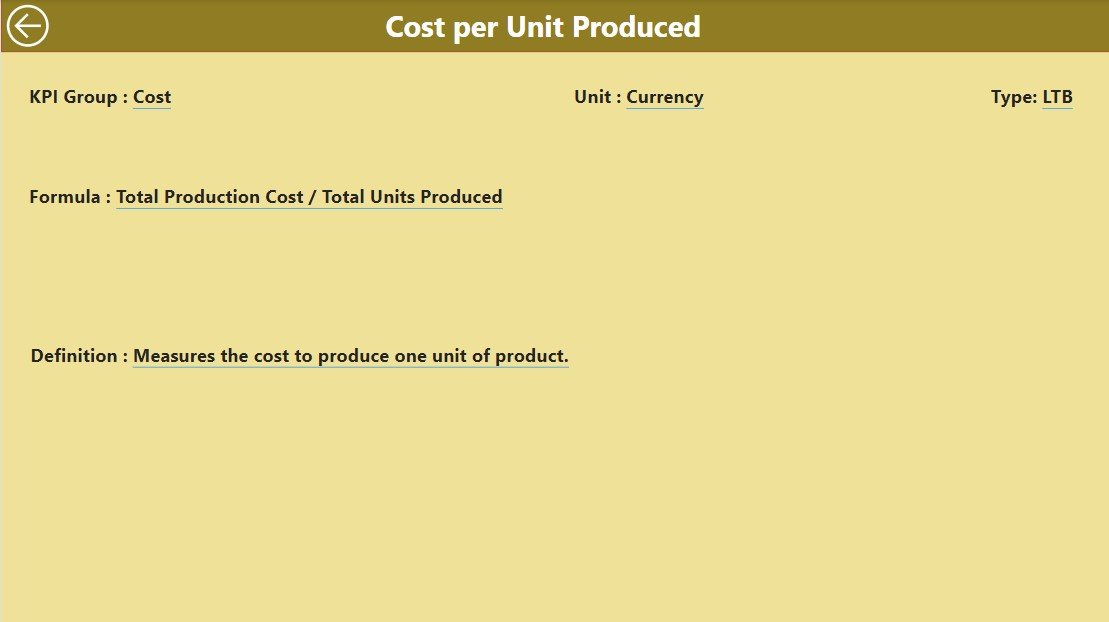
⚙️ Customizable KPIs & Metrics
Customize the dashboard to track the most relevant KPIs for your specific business goals. Whether you are focusing on production, quality control, or supply chain performance, the dashboard can be tailored to meet your needs.
🔑 Real-Time Data Integration
Integrate data from different sources, including ERP systems, production tools, and supply chain management platforms, to get real-time updates on your key metrics and improve decision-making.
Why You’ll Love the Textile Industry KPI Dashboard in Power BI
✅ Comprehensive Performance Insights
Access a 360-degree view of your textile production performance, from efficiency to quality and delivery times. Monitor all critical metrics in real-time to improve operational outcomes.
✅ Increase Production Efficiency
Track and optimize production yields, machine uptime, and overall production rates to boost operational efficiency and reduce waste.
✅ Enhance Product Quality
Monitor product quality metrics, such as defect rates and rework times, and identify areas for improvement in your production process to ensure high-quality products.
✅ Optimize Inventory & Supply Chain
Track inventory levels, raw material usage, and delivery performance to avoid delays and ensure smooth supply chain operations.
✅ Scalable & Customizable
Tailor the dashboard to fit your specific textile business needs. Add custom KPIs and modify the layout to reflect your company’s goals and performance metrics.
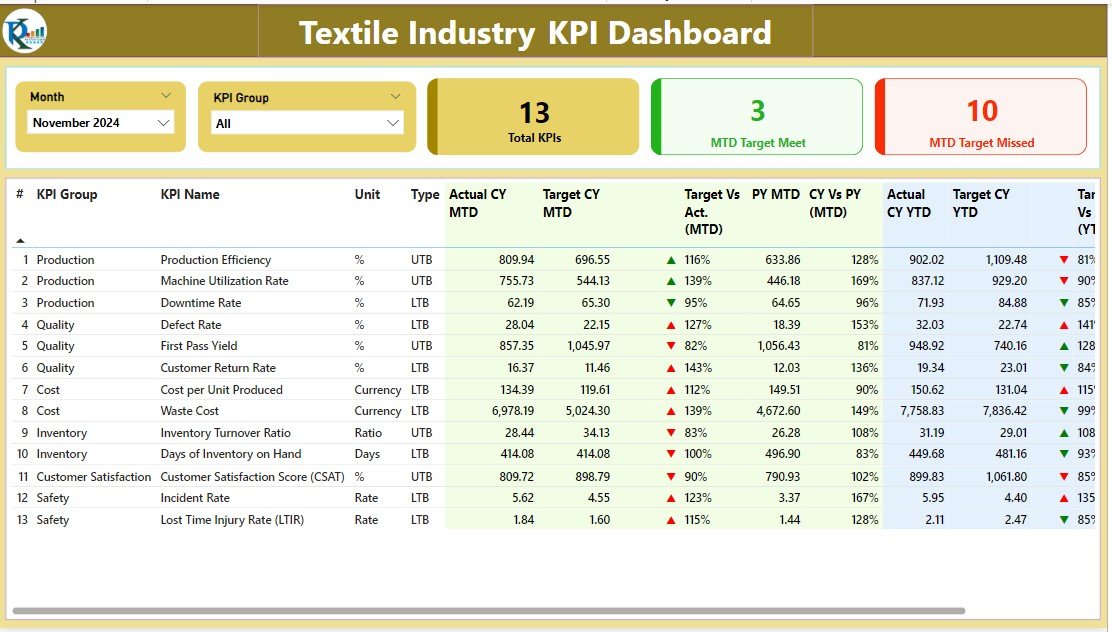
What’s Inside the Textile Industry KPI Dashboard in Power BI?
-
Production Efficiency Tracking: Monitor machine uptime, production rates, and yield.
-
Quality Control Metrics: Track defect rates and rework times.
-
Inventory & Supply Chain Management: Monitor inventory levels, raw material usage, and on-time deliveries.
-
Cycle Time & Delivery Tracking: Track production cycle times, order lead times, and delivery performance.
-
Customizable KPIs: Tailor the dashboard to track the KPIs that matter most for your business.
-
Real-Time Data Integration: Get real-time updates and make data-driven decisions.
How to Use the Textile Industry KPI Dashboard in Power BI
1️⃣ Download the Template: Get access to the Textile Industry KPI Dashboard in Power BI instantly.
2️⃣ Integrate Your Data Sources: Connect the dashboard to your ERP systems, production tools, and inventory management platforms.
3️⃣ Track Key Metrics: Monitor important KPIs like production rates, defect rates, and inventory levels.
4️⃣ Analyze Performance Trends: Use historical data to track performance trends and identify areas for improvement.
5️⃣ Optimize Operations: Use insights from the dashboard to optimize production efficiency, improve product quality, and streamline your supply chain.
Who Can Benefit from the Textile Industry KPI Dashboard in Power BI?
🔹 Textile Manufacturers
🔹 Supply Chain Managers
🔹 Quality Control Teams
🔹 Production Managers
🔹 Inventory & Warehouse Managers
🔹 Textile Business Owners & Executives
🔹 Large Enterprises in the Textile Sector
Ensure that your textile production processes are running smoothly and efficiently with the Textile Industry KPI Dashboard in Power BI. Track key metrics, optimize performance, and make informed decisions that drive business success.
Click here to read the Detailed blog post
Visit our YouTube channel to learn step-by-step video tutorials
Youtube.com/@PKAnExcelExpert


Reviews
There are no reviews yet.