

Managing an office vehicle fleet is far more than tracking how many vehicles an organization owns. Fleet managers must monitor purchase costs, fuel expenses, maintenance, insurance, utilization, downtime, and vendor performance—all while ensuring cost control and operational efficiency. However, when this data is spread across multiple spreadsheets or manual reports, fleet management becomes slow, inefficient, and error-prone.
That is exactly why the Office Vehicle Fleet Dashboard in Google Sheets becomes a powerful, ready-to-use solution.
This dashboard converts raw fleet data into clear KPIs, interactive visuals, and actionable insights using Google Sheets. Instead of manually compiling reports, organizations can instantly track fleet costs, usage patterns, and performance from a single centralized dashboard. Because it is built in Google Sheets, it is cloud-based, collaborative, cost-effective, and easy to customize—without the need for complex BI tools or technical expertise.
🚘 Key Features of Office Vehicle Fleet Dashboard
📊 Centralized Fleet KPIs
Track all key fleet metrics—vehicles, costs, fuel efficiency, and utilization—in one place.
🔍 Interactive Filters
Analyze data dynamically by:
Vehicle Type
Fuel Type
Department
Region
Vendor
All charts and KPIs update instantly.
💰 Cost Visibility
Monitor purchase cost, maintenance, insurance, and total operating cost clearly.
📈 Trend Analysis
Identify monthly cost patterns and efficiency changes over time.
🔎 Search & Drill-Down
Find vehicle-level records instantly using search by keyword and field name.
📦 What’s Inside the Office Vehicle Fleet Dashboard
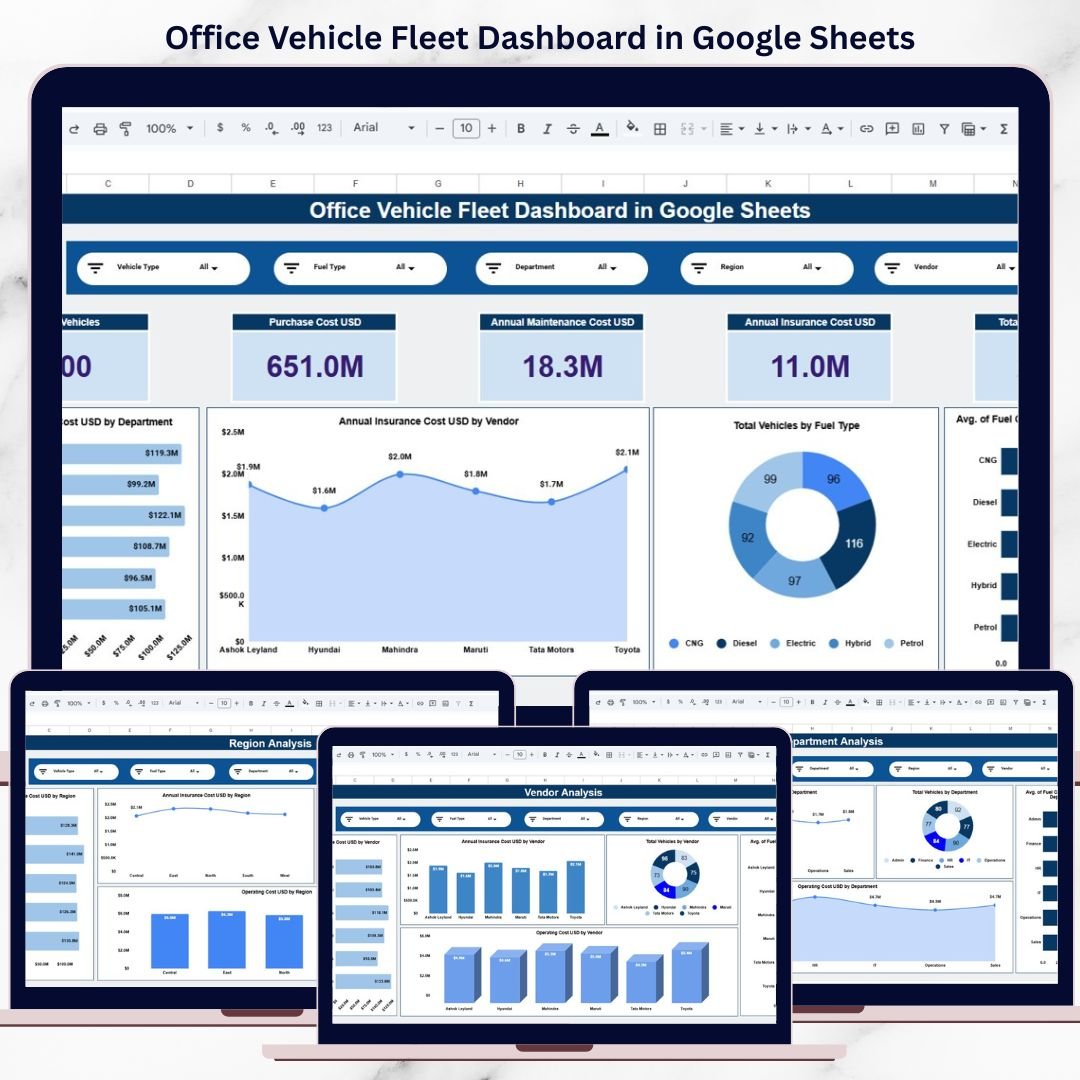
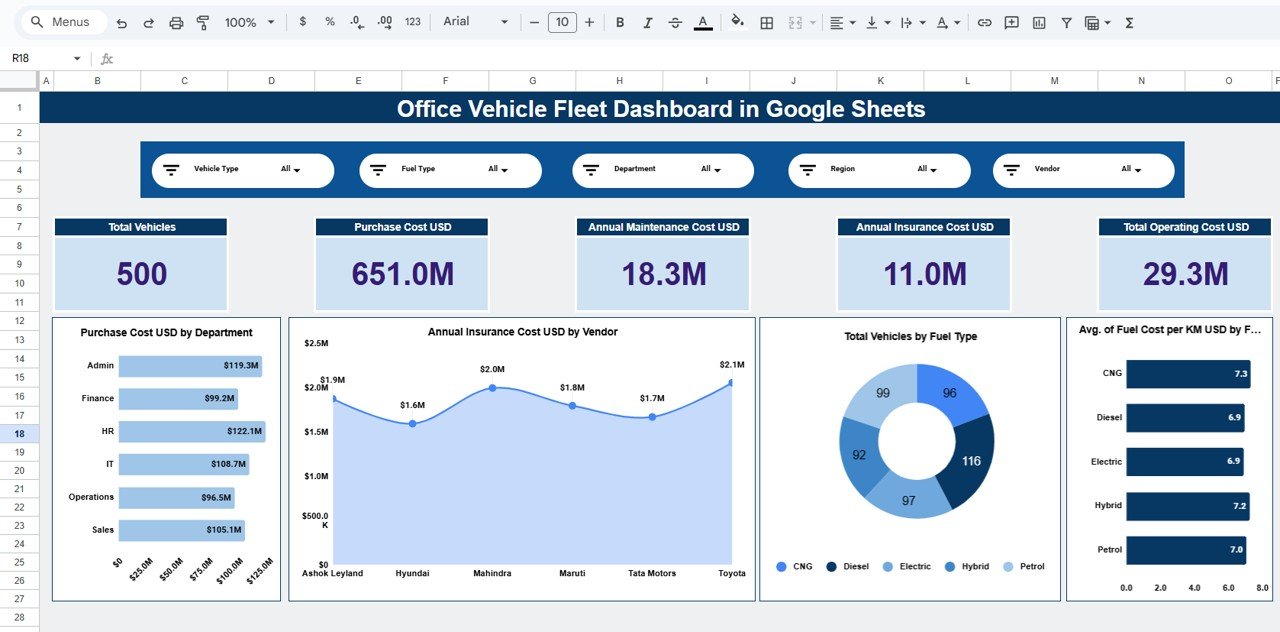
🧭 Overview Sheet – Fleet Performance Snapshot
The Overview sheet provides a high-level view of fleet performance for leadership and decision-makers.
KPI Cards Display:
Total Vehicles
Purchase Cost (USD)
Annual Maintenance Cost (USD)
Annual Insurance Cost (USD)
Total Operating Cost (USD)
Charts Included:
Purchase Cost (USD) by Department
Annual Insurance Cost (USD) by Vendor
Total Vehicles by Fuel Type
Average Fuel Cost per KM by Fuel Type
This page gives instant clarity on overall fleet health.
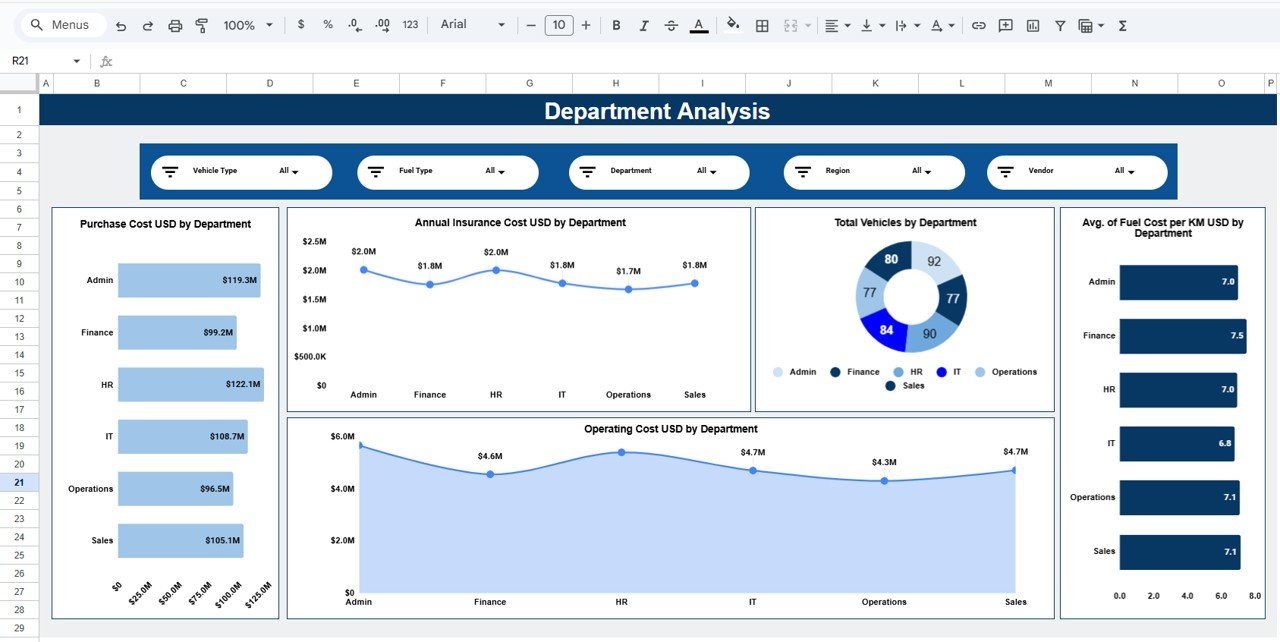
🏢 Department Analysis – Internal Cost Control
This sheet focuses on fleet usage and cost by department.
Charts Included:
Purchase Cost (USD) by Department
Annual Insurance Cost (USD) by Department
Total Vehicles by Department
Operating Cost (USD) by Department
Average Fuel Cost per KM by Department
It helps identify cost-heavy departments and optimize allocation.
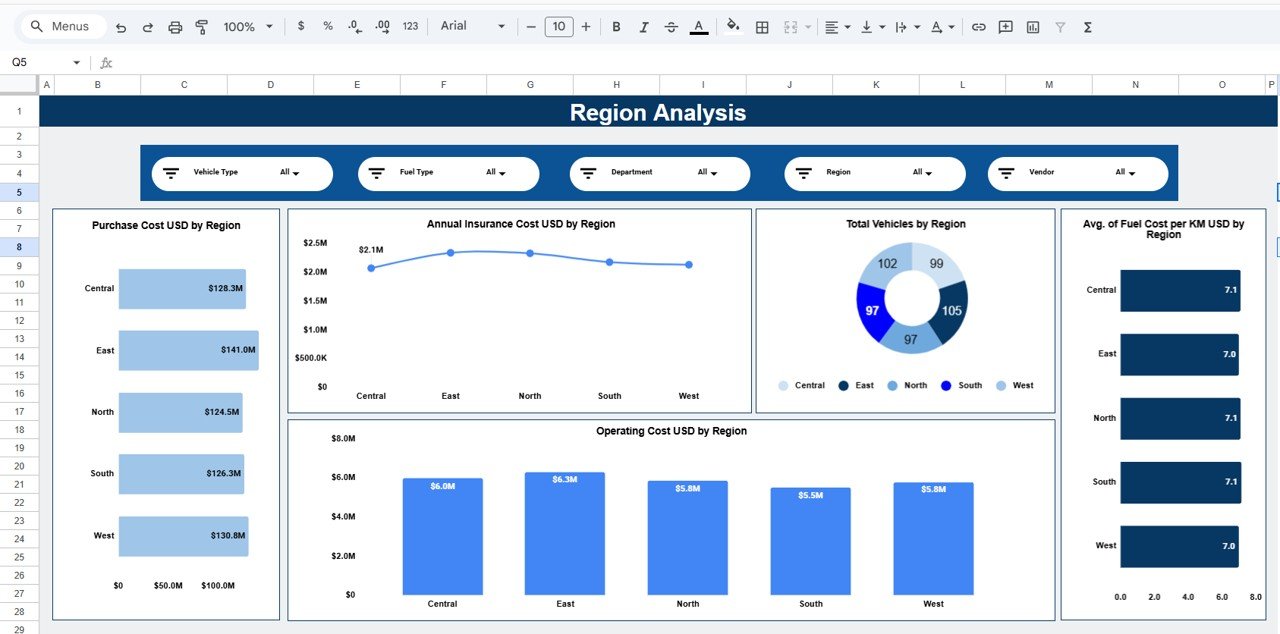
🌍 Region Analysis – Location-Wise Performance
This page highlights regional fleet performance.
Charts Included:
Purchase Cost (USD) by Region
Annual Insurance Cost (USD) by Region
Total Vehicles by Region
Operating Cost (USD) by Region
Average Fuel Cost per KM by Region
This analysis supports regional efficiency comparisons and planning.
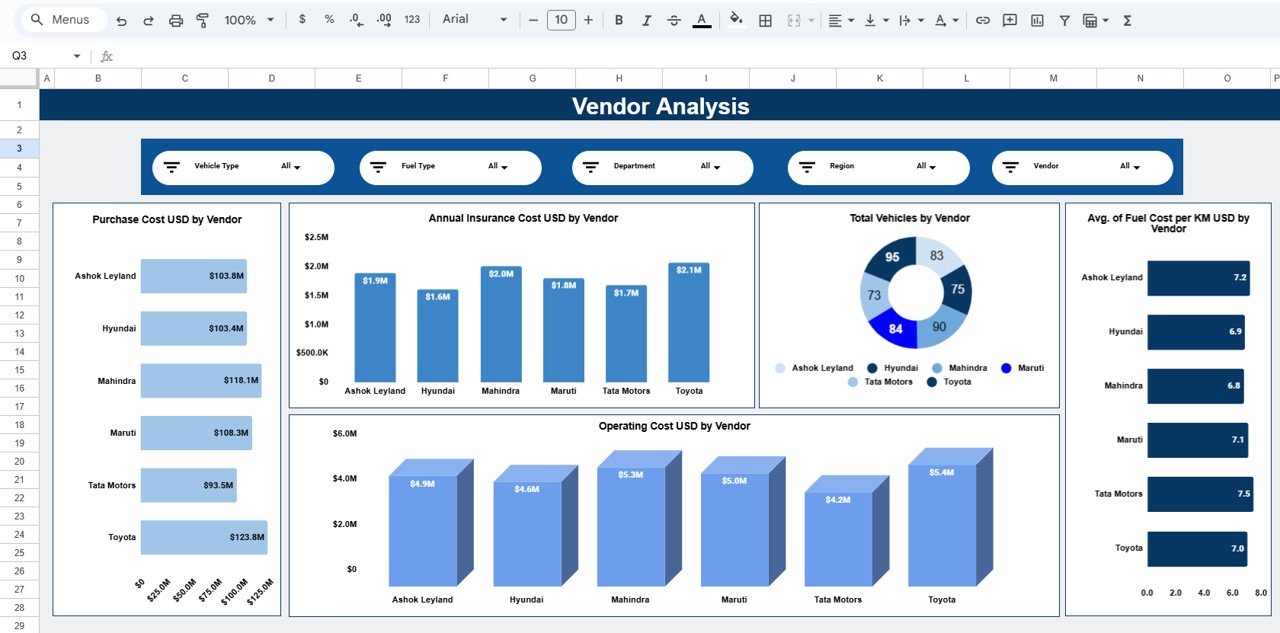
🤝 Vendor Analysis – Supplier Evaluation
The Vendor Analysis page helps evaluate supplier and service provider performance.
Charts Included:
Purchase Cost (USD) by Vendor
Annual Insurance Cost (USD) by Vendor
Total Vehicles by Vendor
Operating Cost (USD) by Vendor
Average Fuel Cost per KM by Vendor
This is extremely useful for vendor negotiations and procurement strategy.
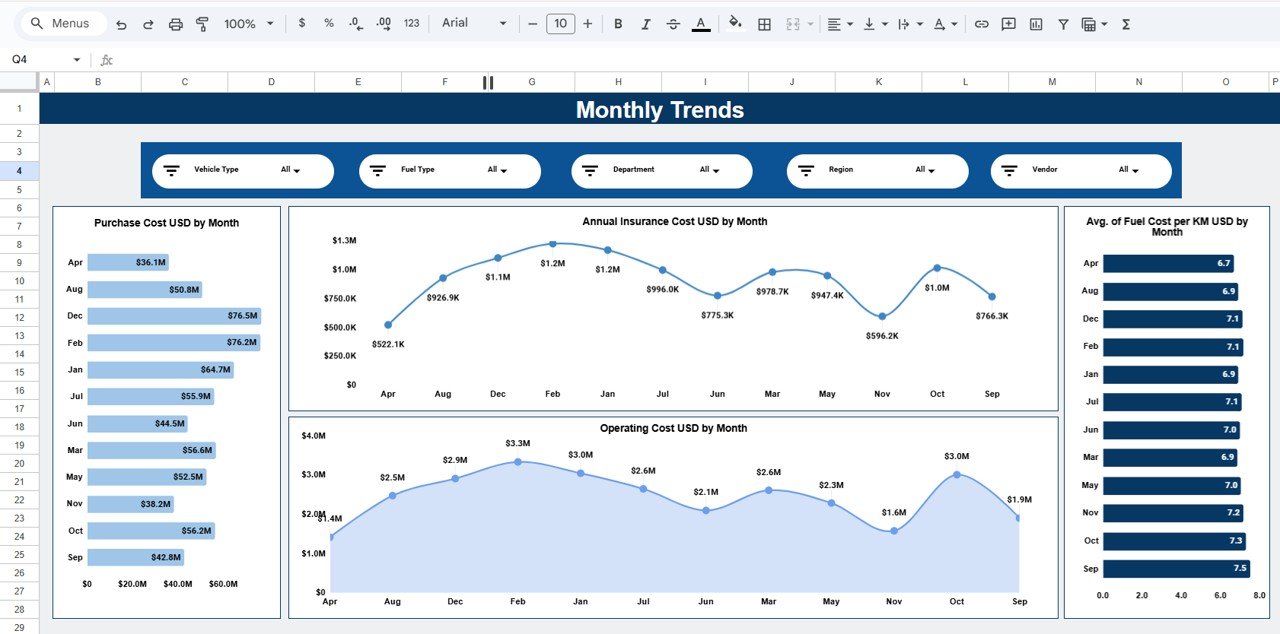
📅 Monthly Trends – Cost & Efficiency Over Time
This page tracks fleet behavior across months.
Trend Charts:
Purchase Cost (USD) by Month
Annual Insurance Cost (USD) by Month
Operating Cost (USD) by Month
Average Fuel Cost per KM by Month
It helps identify seasonal spikes and cost fluctuations.
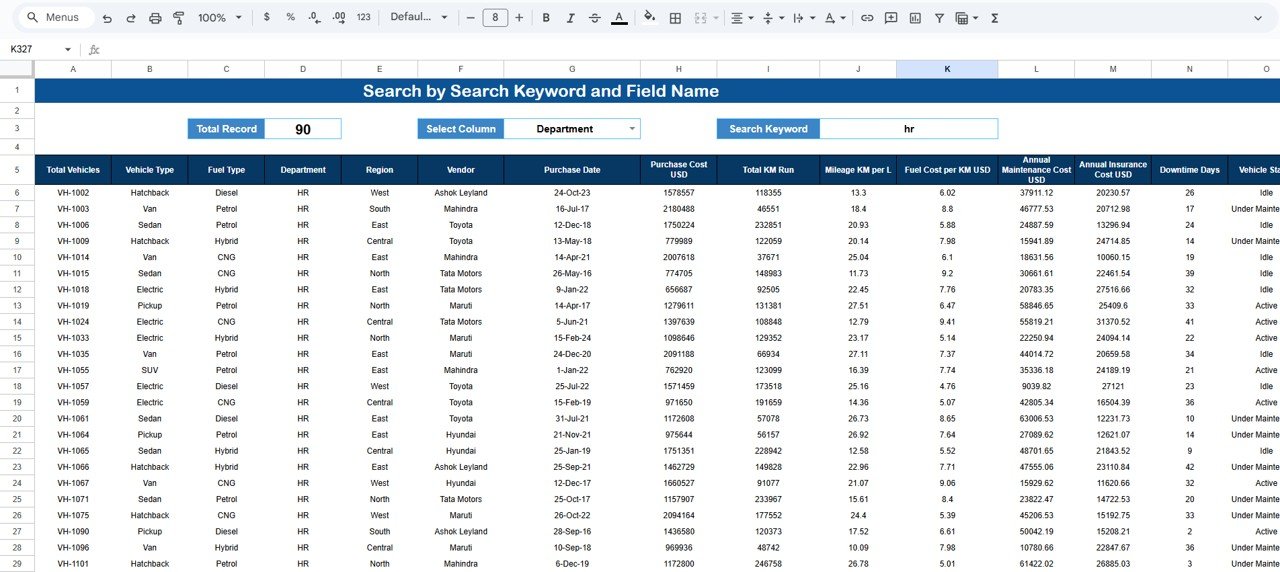
🔎 Data & Search Sheet – Detailed Fleet Records
This sheet contains vehicle-level data such as:
Vehicle ID & Type
Fuel Type
Department & Region
Vendor
Purchase Cost & Date
Mileage & Fuel Cost per KM
Maintenance & Insurance Cost
Downtime Days & Vehicle Status
A Search by Search Keyword and Field Name feature allows instant record lookup.
👥 Who Can Benefit from This Dashboard
Fleet Managers
Operations Teams
Admin & Finance Departments
Facility Management Teams
Corporate Procurement Teams
Growing organizations with office vehicles
⚙️ How to Use the Office Vehicle Fleet Dashboard
Enter fleet data in the data sheet
Apply slicers for focused analysis
Review KPIs and charts
Identify high-cost areas and inefficiencies
Take data-driven fleet decisions
No advanced Google Sheets skills required.
### Click here to read the Detailed blog post
Watch the step-by-step video tutorial:































Reviews
There are no reviews yet.