

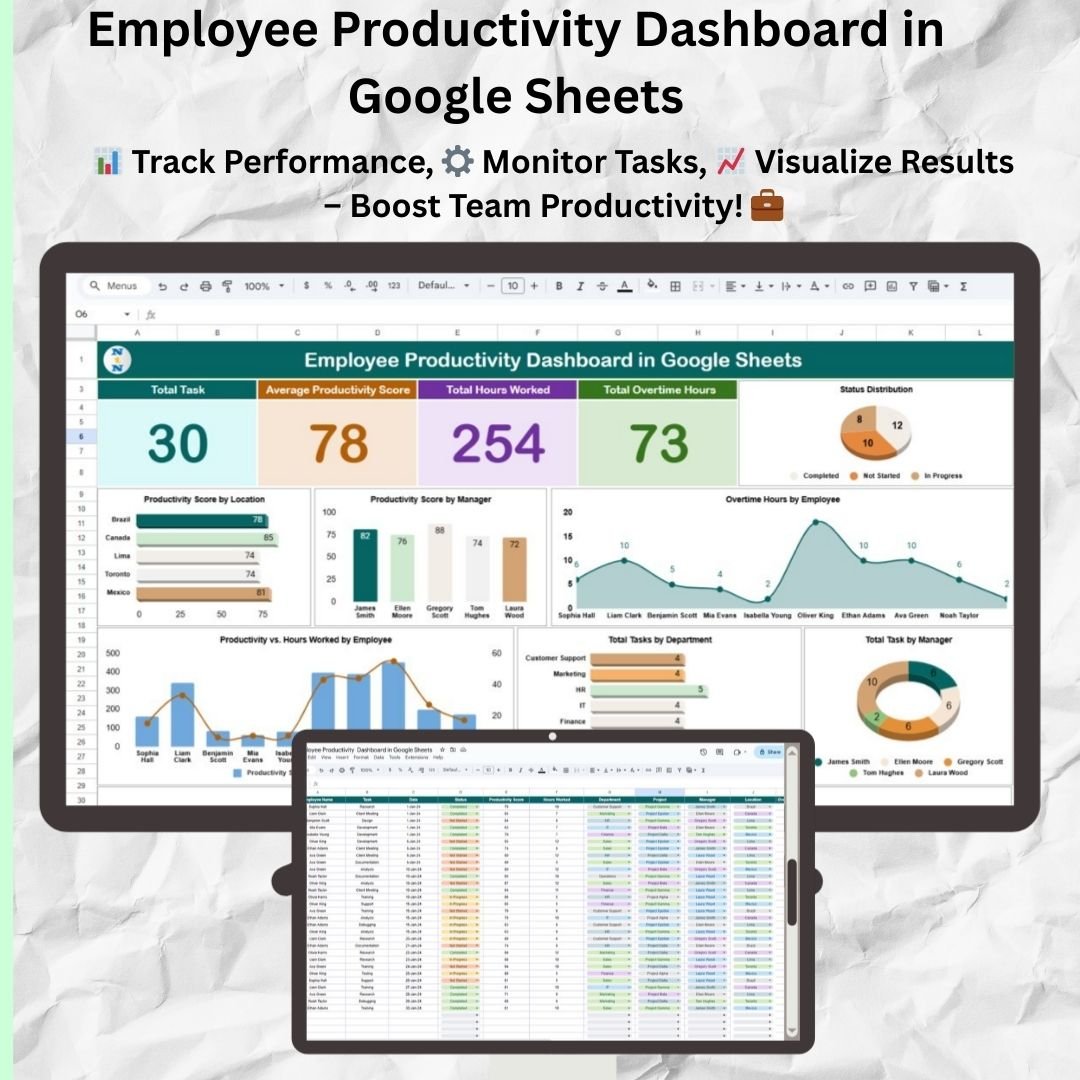


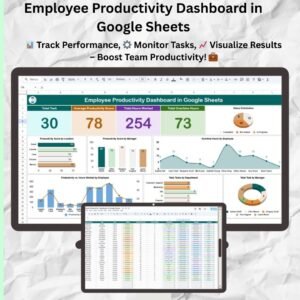
The Employee Productivity Dashboard in Google Sheets is a ready-made template for managers and team leaders who want to track and improve employee performance. It brings task completion rates, attendance, efficiency and project timelines into one Google Sheets file, so you can spot trends and make better decisions for your team.
Updates appear as you enter data, so you can follow your team’s progress and check whether goals are being met. Because it tracks several productivity indicators at once, project deadlines and individual performance stay visible. This is true whether you manage a few people or a larger team.

Key Features of the Employee Productivity Dashboard in Google Sheets
- Productivity metrics: Track task completion, efficiency and overall team performance.
- Customizable KPIs: Choose the performance indicators that matter to your business or team.
- Project tracking: Monitor project timelines, task progress and completion rates as data is updated.
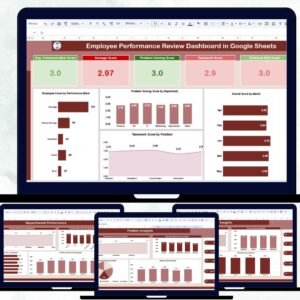
- Visual insights: See team performance and individual progress through graphs, charts and color-coded cells.
- Employee efficiency tracking: Assess productivity against key metrics and find areas for improvement.
- Real-time collaboration: Share the dashboard with your team for live updates and joint analysis.
Why Teams Choose This Google Sheets Dashboard
- Improves team performance: Shows key performance indicators and trends so you know where productivity can improve.
- Fits your needs: Adapts to your goals, KPIs and team structure.
- Easy to use: Simple to set up, with no advanced Google Sheets knowledge needed.
- Keeps everyone updated: Gives your team live data and a clear view of progress.
- Makes reporting simple: Produces clear reports for stakeholders.
The template works as a team performance tracker and a KPI dashboard in one file. You don’t need to manage separate spreadsheets for tasks, attendance and projects.
What’s Inside the Template
| Section | What it does |
|---|---|
| Performance Dashboard | Tracks task completion, attendance, efficiency and other key metrics in one place. |
| Customizable KPI Sections | Tracks the metrics that matter most, such as deadlines met, productivity rates and efficiency scores. |
| Visual Graphs and Charts | Shows data trends and highlights areas for improvement. |
| Employee Tracking | Monitors individual performance so you can see who is excelling and who may need more support. |
| Project Monitoring | Tracks progress on different projects and checks that timelines are met. |
Who Is It For?
This dashboard suits anyone responsible for employee performance tracking or team output:
- Team leaders
- Project managers
- HR managers
- Business owners and small business owners
- Freelancers and consultants
- Productivity analysts
How to Use the Employee Productivity Dashboard in Google Sheets
- Download the template: Get the pre-configured productivity dashboard.
- Input data: Add employee names, tasks, deadlines and other relevant details.
- Track performance: Monitor your team’s progress and tasks, and review overall performance.
- Analyze insights: Use the charts and KPIs to spot trends and areas for improvement.
- Collaborate: Share the dashboard with your team for live updates and feedback.
Watch the step-by-step video tutorial:
Visit our YouTube channel for step-by-step video tutorials: Youtube.com/@PKAnExcelExpert
Click here to read the detailed blog post.
Frequently Asked Questions
What can I track with the Employee Productivity Dashboard in Google Sheets?
You can track task completion rates, attendance, efficiency, project timelines and individual employee performance. You can also add custom KPIs such as deadlines met, productivity rates and efficiency scores.
Can I customize the KPIs?
Yes. The customizable KPI sections let you track the indicators most relevant to your business, goals and team structure.
Do I need advanced Google Sheets skills?
No. The dashboard is easy to set up and use without advanced Google Sheets knowledge.
Can my team work on the dashboard together?
Yes. You can share the file with your team for live updates, feedback and joint analysis.
Does it support project tracking?
Yes. The Project Monitoring section tracks project timelines, task progress and completion rates so you can confirm deadlines are met.
Can I use it for reporting to stakeholders?
Yes. The charts, graphs and color-coded cells make it easy to prepare clear performance reports for stakeholders.
Also check our Attendance Template in Google Sheet
Last updated: October 2026
Compatibility and Requirements
- Works in Google Sheets with a free Google account and a web browser. Nothing to install.
- Share the dashboard with your team so everyone sees live updates. Google explains charts in Add & edit a chart or graph.
Related Productivity Templates
- Employee Productivity Dashboard in Excel: the Excel edition
- Employee Productivity Dashboard in Power BI: the Power BI edition
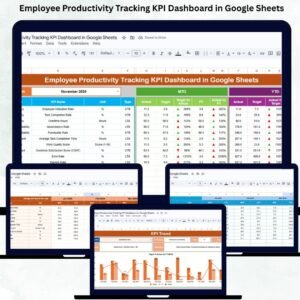
- Employee Productivity Tracking KPI Dashboard in Google Sheets: a KPI view in Google Sheets
- Team Productivity and Workload Dashboard in Google Sheets: balance workload across the team
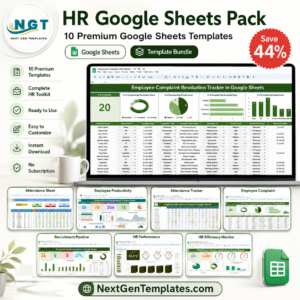
- HR Google Sheets Pack: 10 premium HR templates in Google Sheets
Browse all Google Sheets dashboards or the Google Sheets HR and payroll templates.

Reviews
There are no reviews yet.