Investor confidence is built on clarity, transparency, and timely insights. However, many organizations still manage investor data using scattered spreadsheets, static presentations, and manual reports. As a result, leadership teams struggle to explain performance clearly, answer investor questions quickly, and maintain consistent communication.
That is exactly where the Investor Relations Dashboard in Power BI becomes a powerful, modern, and strategic solution.
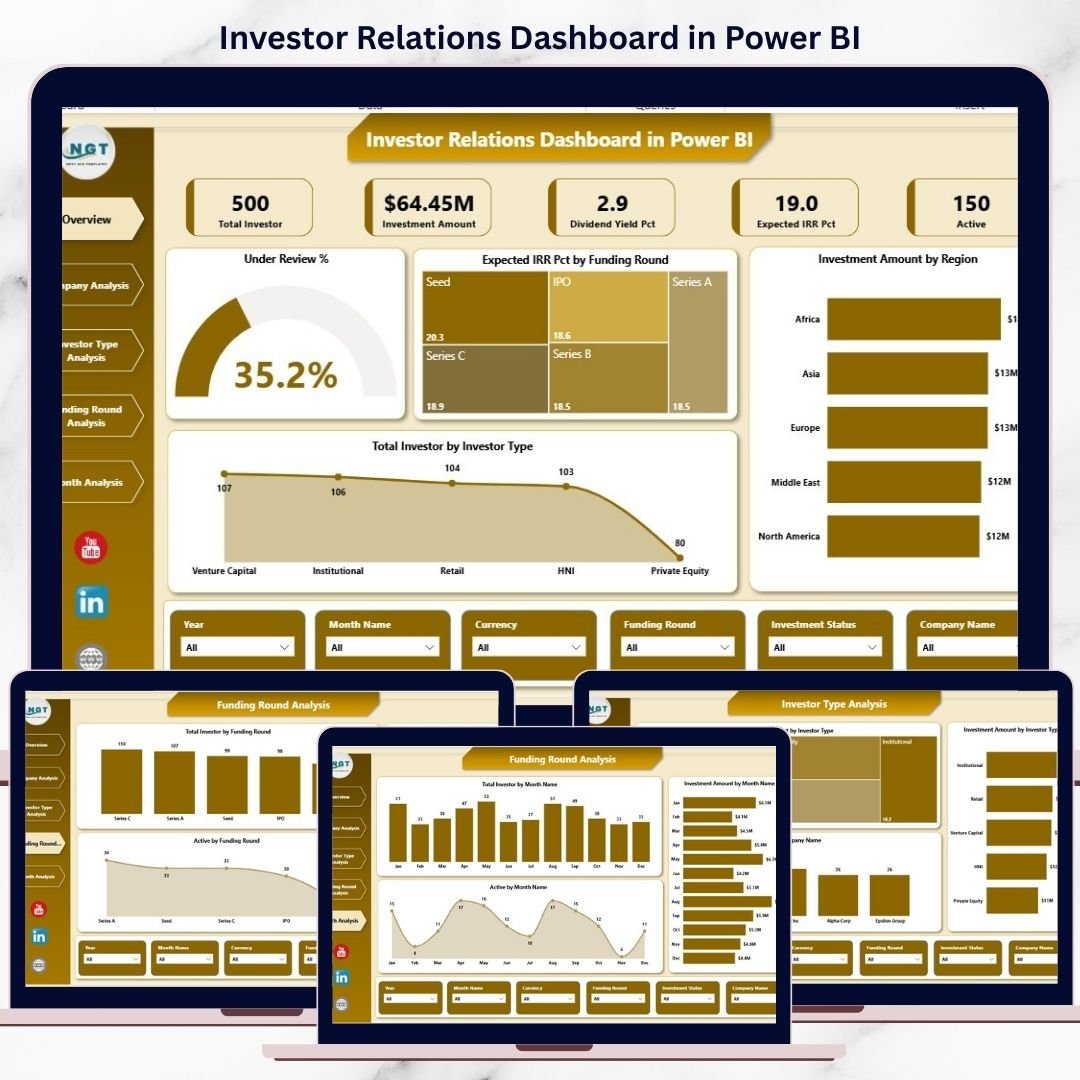
This ready-to-use Power BI dashboard transforms complex investor data into interactive visuals, KPIs, and trends. Instead of preparing reports manually, you gain a real-time, professional, and investor-ready view of funding, returns, and investor activity—all in one place.
Whether you are a startup founder, CFO, investor relations manager, private equity firm, or venture capital team, this dashboard helps you communicate with confidence and make data-driven decisions faster.
🚀 Key Features of Investor Relations Dashboard in Power BI
📊 Centralized Investor Reporting – All investor metrics in one Power BI report
💰 Investment & Expected IRR Tracking – Monitor returns across companies and rounds
👥 Investor Type Analysis – Understand institutional, VC, angel, and other investors
📈 Funding Round Performance – Compare Seed, Series A, B, and beyond
🌍 Regional Investment View – Identify geographic exposure and opportunities
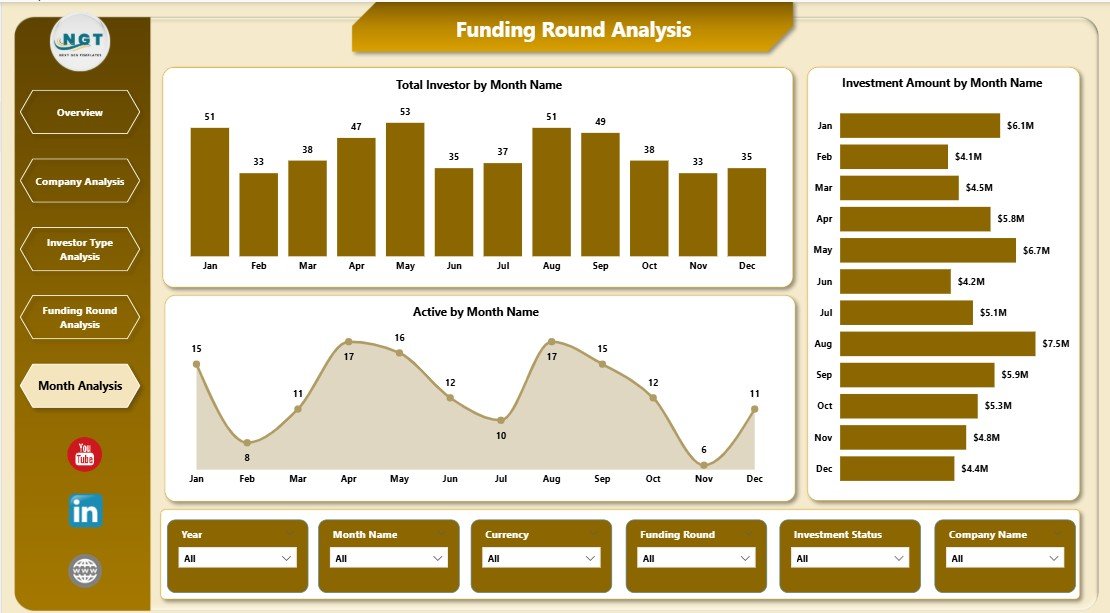
📅 Monthly Trend Analysis – Track growth, momentum, and seasonality
🧭 Interactive Slicers – Filter instantly by company, investor type, round, or month
⚡ Real-Time Insights – Auto-refresh with updated data
📦 What’s Inside the Investor Relations Dashboard
This Power BI dashboard includes 5 professionally designed analytical pages, each answering a critical investor-related question.
🔹 Overview Page
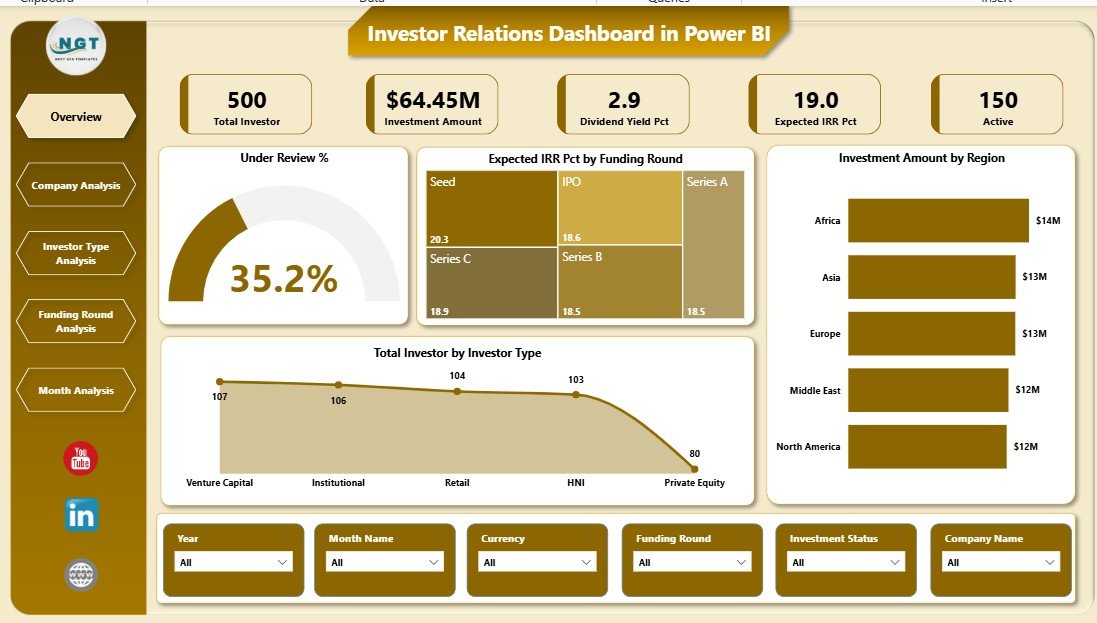
Acts as the executive snapshot with:
-
Under Review %
-
Expected IRR % by Funding Round
-
Investment Amount by Region
-
Total Investment by Investor Type
Perfect for leadership reviews and investor meetings.
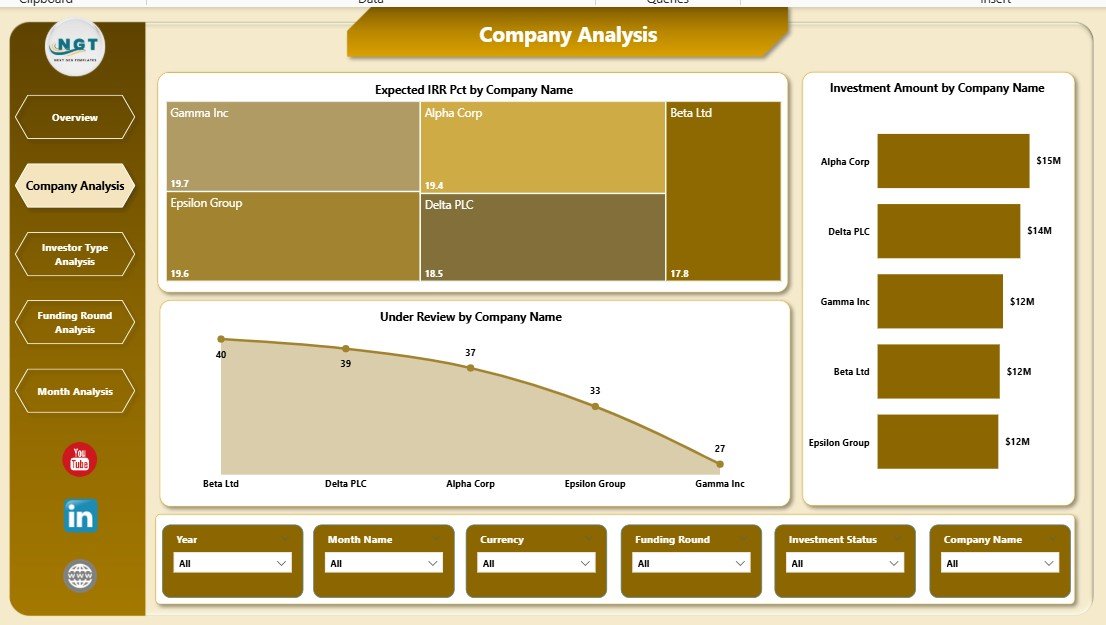
🔹 Company Analysis Page
Analyze company-level performance using:
-
Expected IRR % by Company
-
Investment Amount by Company
-
Under Review by Company
Supports portfolio reviews and due diligence discussions.
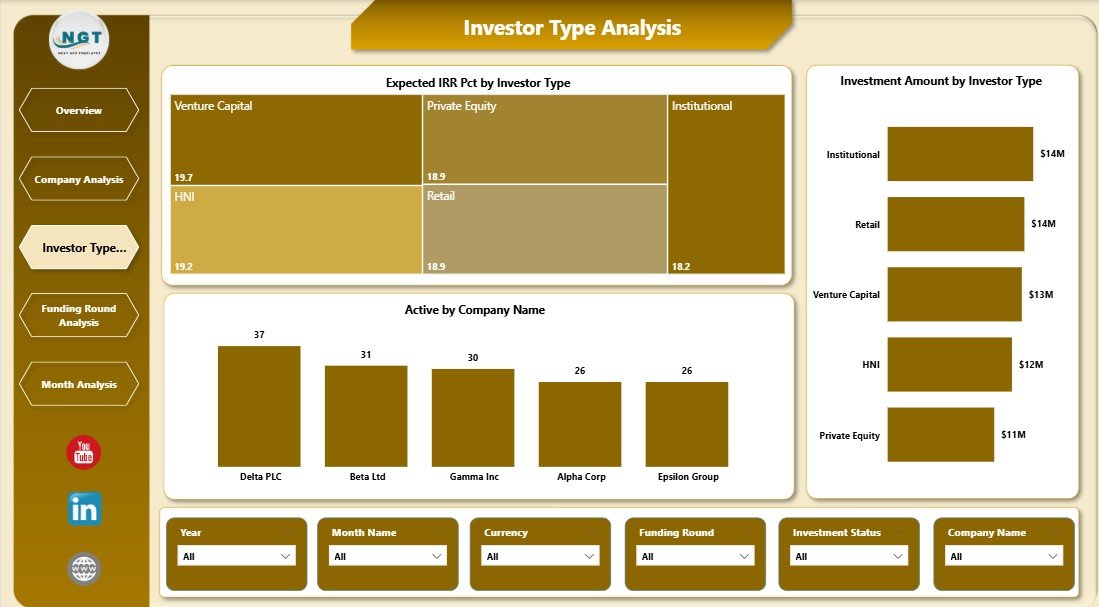
🔹 Investor Type Analysis Page
Understand investor behavior with:
-
Expected IRR % by Investor Type
-
Investment Amount by Investor Type
-
Active by Investor Type
Helps tailor communication and fundraising strategies.
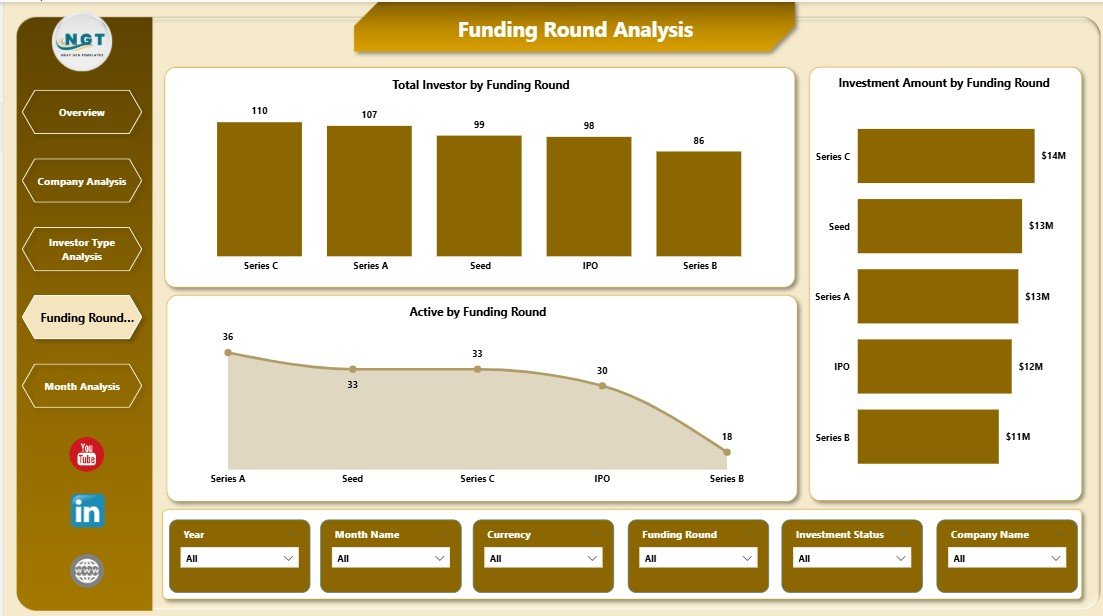
🔹 Funding Round Analysis Page
Evaluate funding stages using:
-
Total Investors by Funding Round
-
Investor Amount by Funding Round
-
Active by Funding Round
Essential for capital planning and future fundraising.
🔹 Monthly Trends Page
Track performance over time with:
-
Total Investors by Month
-
Investor Amount by Month
-
Active by Month
Enables forecasting and momentum tracking.
🧠 How to Use the Investor Relations Dashboard in Power BI
1️⃣ Connect your structured investor data (Excel, database, or cloud source)
2️⃣ Refresh the Power BI report
3️⃣ Use interactive slicers to filter insights instantly
4️⃣ Review KPIs, charts, and trends
5️⃣ Use visuals in board meetings, investor calls, and strategy reviews
No advanced Power BI expertise required for daily use.
👥 Who Can Benefit from This Dashboard?
🚀 Startup Founders & CEOs – Communicate performance confidently
💼 CFOs & Finance Teams – Track investments and returns clearly
📊 Investor Relations Managers – Improve transparency and speed
💰 Venture Capital & PE Firms – Monitor portfolio health
📈 Strategy & Portfolio Teams – Support data-driven discussions
This dashboard works for startups, growing firms, and large investment organizations.
### 👉 Click here to read the Detailed Blog Post
🎥 Visit our YouTube channel to learn step-by-step video tutorials
https://www.youtube.com/@PKAnExcelExpert


Reviews
There are no reviews yet.