


In today’s competitive investment landscape, transparent and data-driven investor communication is no longer optional. Investors expect clarity, consistency, and quick answers—not long spreadsheets or static slide decks. However, managing investor data across emails, Excel files, and presentations often leads to confusion, delays, and missed insights.
That is exactly why the Investor Relations Dashboard in Excel becomes a powerful and practical solution.
This ready-to-use Excel dashboard helps organizations track investments, investor performance, funding rounds, and returns in one clean, interactive, and professional file. Instead of spending hours preparing reports, leadership teams gain instant visibility into investor metrics with just a few clicks.
Whether you are a startup founder, CFO, investor relations manager, or finance leader, this dashboard transforms complex investment data into clear, visual, and investor-friendly insights.
🚀 Key Features of Investor Relations Dashboard in Excel
📊 Centralized Investor Reporting – All investor metrics in one Excel file
💰 Investment & IRR Tracking – Monitor investment amount and expected returns
👥 Investor Composition Analysis – Track investors by type and region
📈 Funding Round Insights – Analyze early vs late-stage performance
🧭 Interactive Slicers – Filter data instantly by company, investor type, region, or month
📅 Monthly Trend Analysis – Track fundraising momentum over time
📌 Executive KPI Cards – Instant high-level portfolio overview
🧩 Fully Customizable – Easy to modify KPIs, charts, and structure
📦 What’s Inside the Investor Relations Dashboard
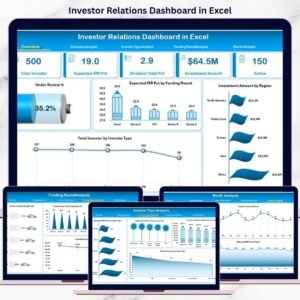
This dashboard includes 5 structured analytical pages plus a clean backend data structure.
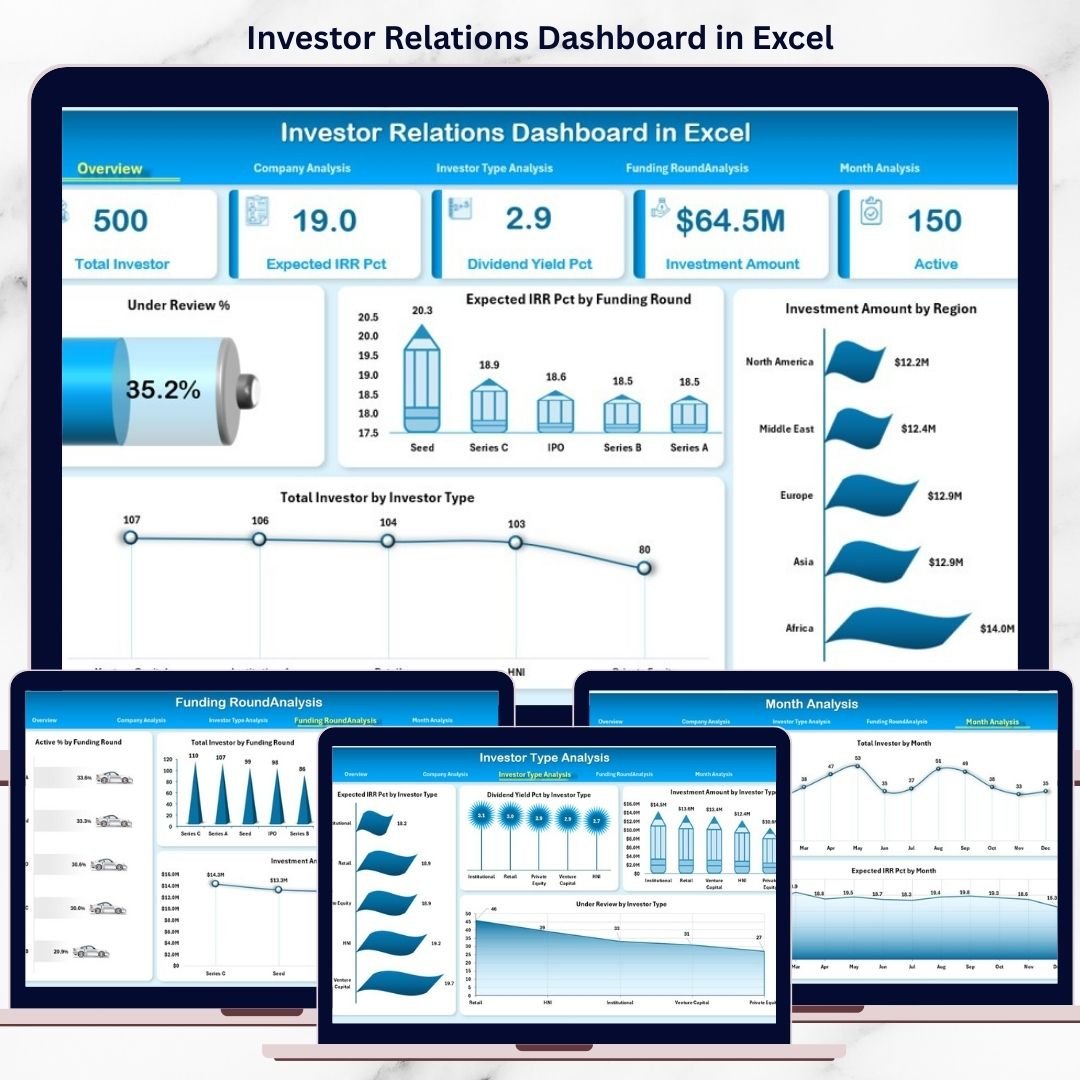
🔹 Overview Page
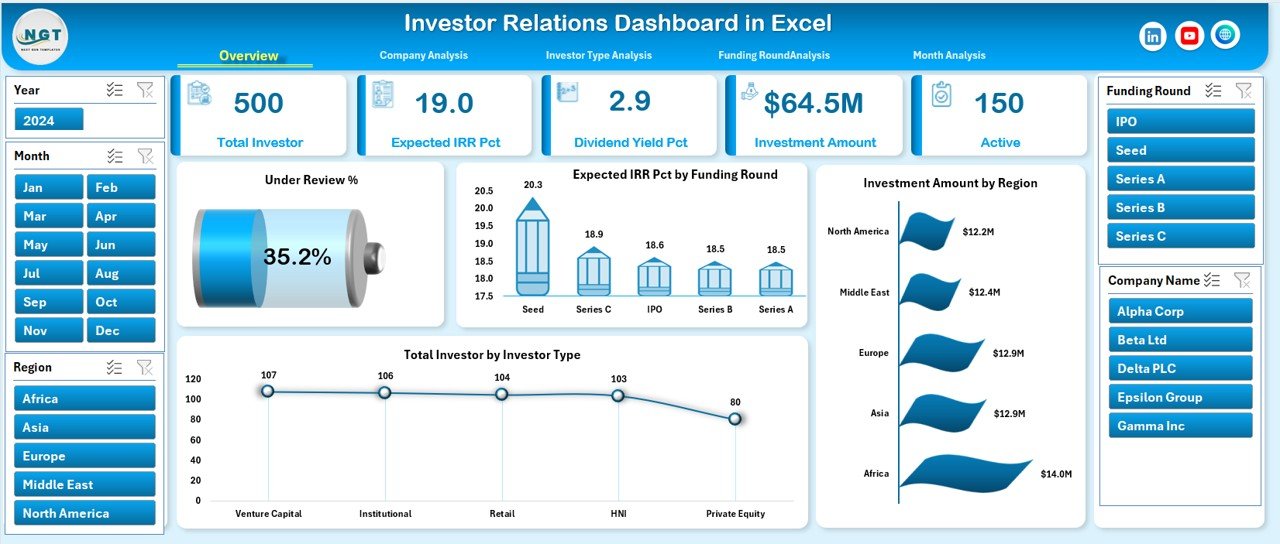
Acts as the executive snapshot with:
Under Review %
Expected IRR %
Total Investment Amount
Total Investors
Along with charts showing:
Expected IRR % by Funding Round
Investment Amount by Region
Total Investors by Investor Type
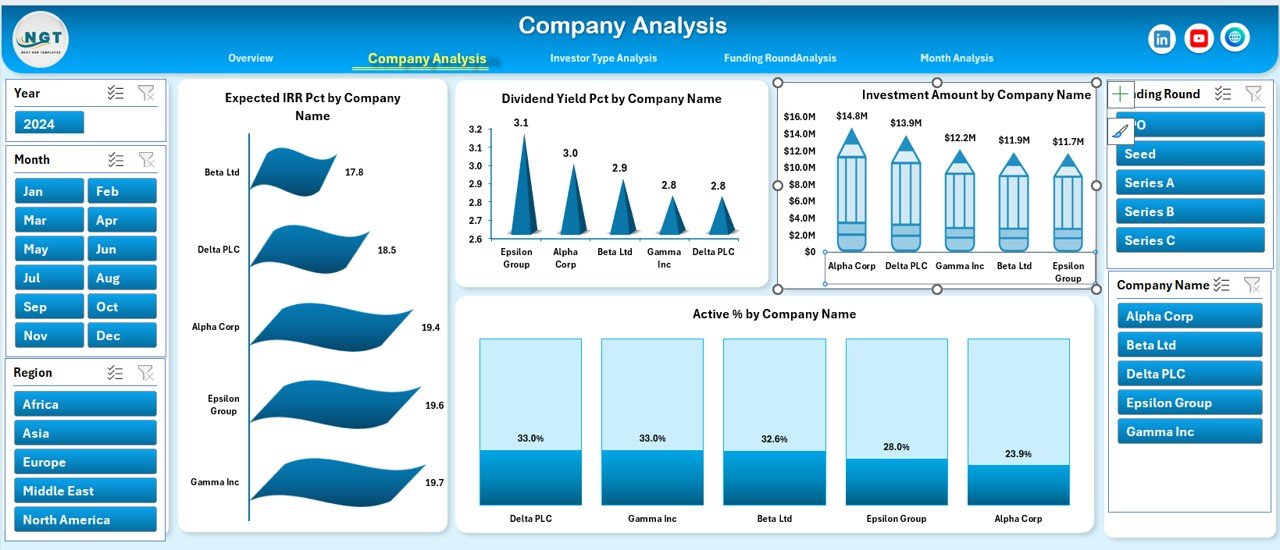
🔹 Company Analysis Page
Analyze performance company-wise using:
Expected IRR % by Company
Dividend Yield % by Company
Investment Amount by Company
Active % by Company
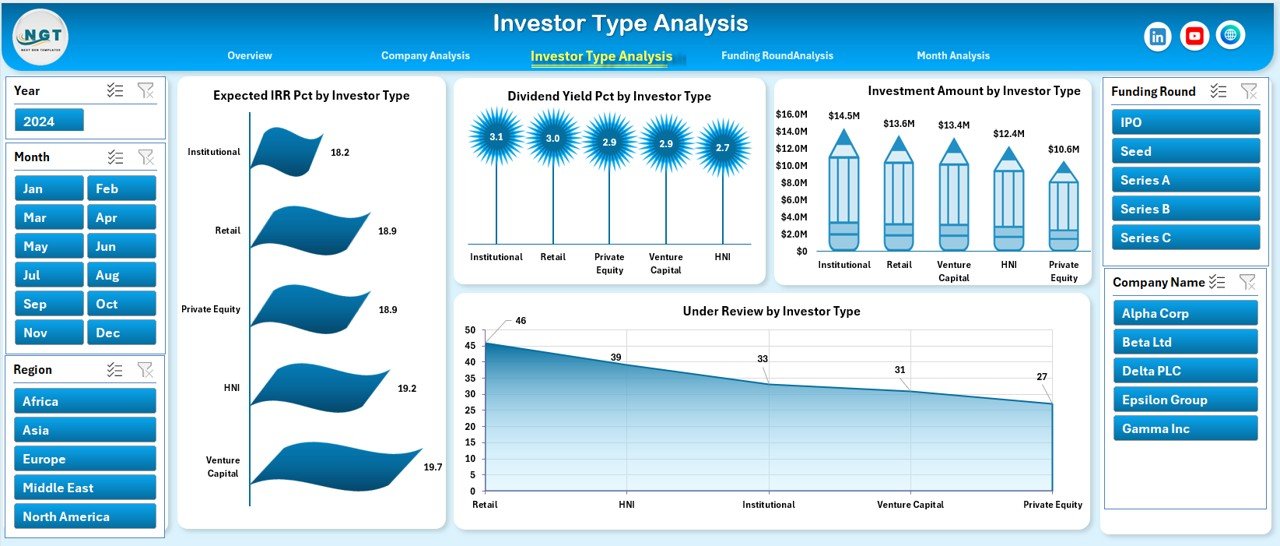
🔹 Investor Type Analysis Page
Understand investor behavior with:
Expected IRR % by Investor Type
Dividend Yield % by Investor Type
Investment Amount by Investor Type
Under Review % by Investor Type
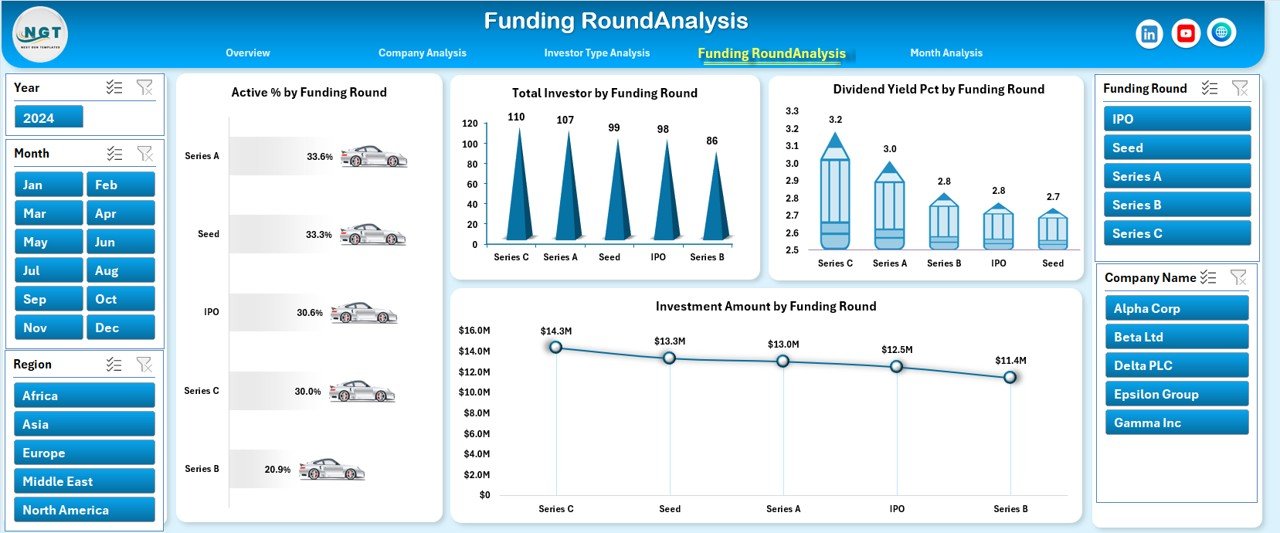
🔹 Funding Round Analysis Page
Evaluate funding maturity using:
Active % by Funding Round
Total Investors by Funding Round
Dividend Yield % by Funding Round
Investment Amount by Funding Round
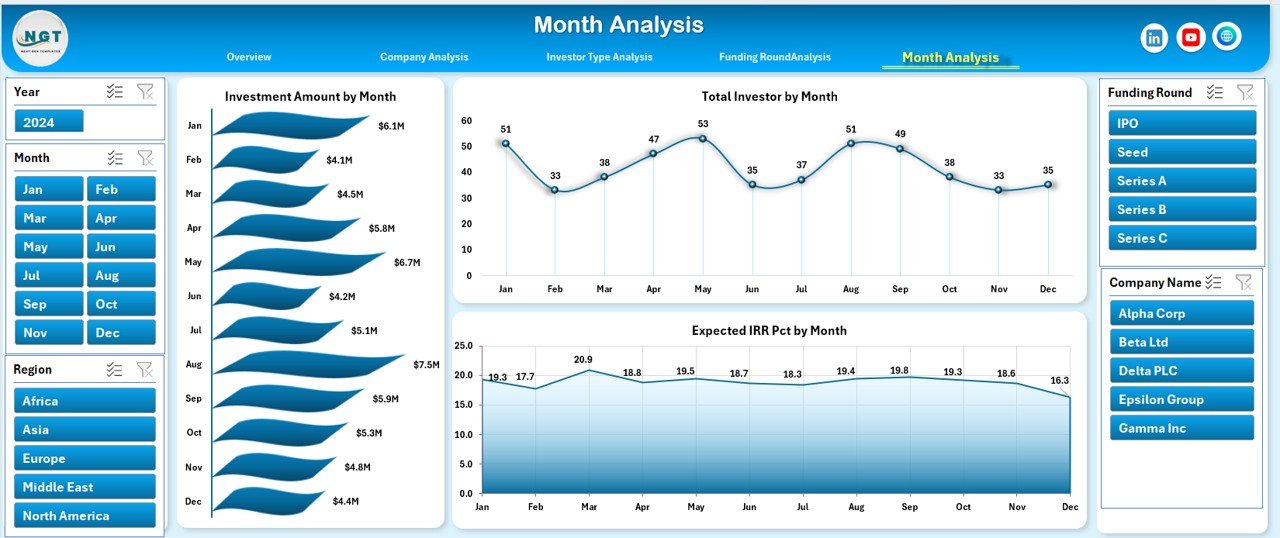
🔹 Month Analysis Page
Track trends over time with:
Investment Amount by Month
Total Investors by Month
Expected IRR % by Month
Behind the scenes, the Data Sheet stores all raw investor data, while the Support Sheet manages dropdowns and slicers.
🧠 How to Use the Investor Relations Dashboard in Excel
1️⃣ Enter or update investor data in the Data Sheet
2️⃣ Refresh pivot tables if required
3️⃣ Use right-side slicers to filter by company, investor type, region, funding round, or month
4️⃣ Review KPI cards and charts instantly
5️⃣ Use insights in investor meetings, board reviews, or fundraising discussions
No advanced Excel skills required. If you can update Excel data, you can use this dashboard confidently.
👥 Who Can Benefit from This Investor Relations Dashboard?
🏢 Startup Founders & CEOs – Track fundraising and investor health
💼 CFOs & Finance Teams – Communicate performance clearly
📊 Investor Relations Managers – Improve transparency and reporting
💰 Venture Capital & PE Firms – Monitor portfolio investments
📈 Strategy & Advisory Teams – Support data-driven discussions
This dashboard works for startups, growing companies, and established enterprises.
### 👉 Click here to read the Detailed Blog Post
🎥 Visit our YouTube channel to learn step-by-step video tutorials
https://www.youtube.com/@PKAnExcelExpert
Watch the step-by-step video tutorial:
Compatibility and Requirements
- Works in Microsoft Excel desktop (Excel 2016 or later, or Microsoft 365).
- The dashboard uses pivot tables and slicers. After you update the Data Sheet, refresh the pivot tables. Microsoft explains slicers in Use slicers to filter data.
Frequently Asked Questions
How many dashboard pages are there?
There are five analysis pages: Overview, Company Analysis, Investor Type Analysis, Funding Round Analysis and Month Analysis. A Data Sheet holds the raw investor data and a Support Sheet manages the dropdowns and slicers.
Where do I enter my investor data?
Enter or update it in the Data Sheet. Then refresh the pivot tables if required and the charts and KPI cards update.
What can I filter with the slicers?
The slicers on the right side filter by company, investor type, region, funding round and month.
Which KPIs does the Overview page show?
It shows Under Review %, Expected IRR %, Total Investment Amount and Total Investors. Charts show Expected IRR % by funding round, investment amount by region and total investors by investor type.
Do I need advanced Excel skills?
No. If you can update data in Excel, you can use the dashboard. You can also change the KPIs, charts and structure to fit your own reporting.
Is there a Power BI or Google Sheets version?
Yes. See the Investor Relations Dashboard in Power BI and the Investor Relations Dashboard in Google Sheets.
Related Investor Relations Templates
- Investor Relations KPI Dashboard in Excel: a KPI-focused view for investor reporting
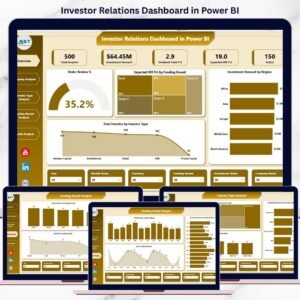
- Investor Relations Dashboard in Power BI: the same dashboard in Power BI
- Investor Relations Dashboard in Google Sheets: the Google Sheets edition
- Investor Relations Calendar in Excel: plan investor events and deadlines
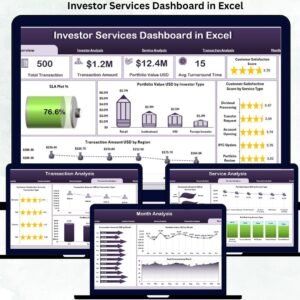
- Investor Services Dashboard in Excel: a dashboard for investor service teams
Browse all Excel dashboards.

























Reviews
There are no reviews yet.