Cash flow is the lifeblood of every business. Even companies that show profits on paper can face serious challenges when cash inflow and outflow are not balanced properly. Delayed payments, uncontrolled expenses, and lack of visibility often lead to cash shortages and poor decisions. Unfortunately, many teams still rely on raw spreadsheets that fail to provide real-time insights.
That is exactly why the Cash Flow Dashboard in Google Sheets becomes an essential financial management tool.
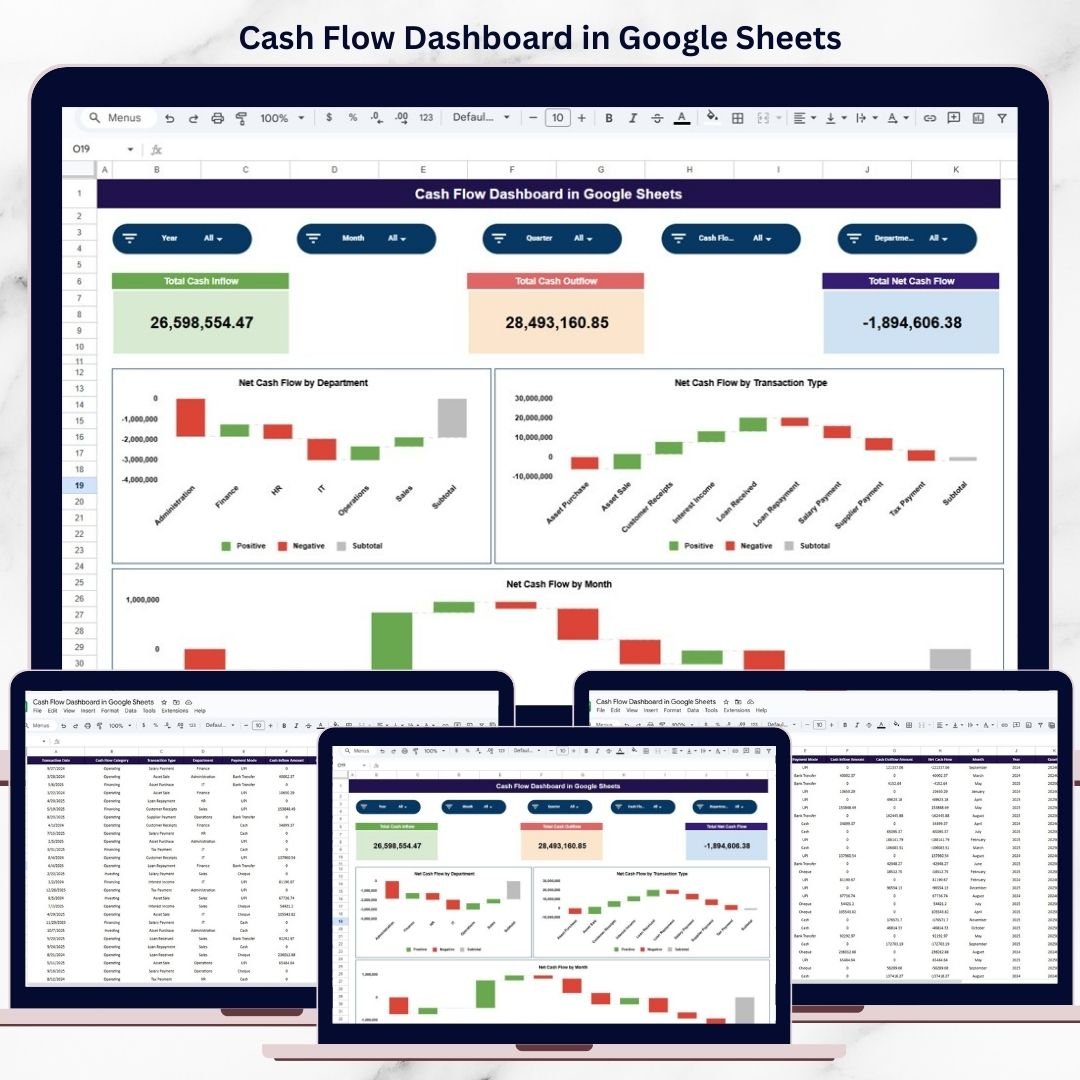
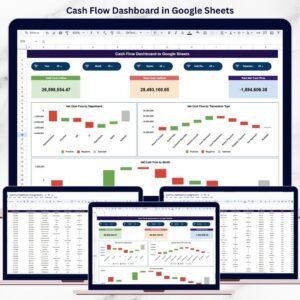
This ready-to-use dashboard transforms transaction-level cash data into clear KPIs and visual insights. It helps business owners, finance teams, and managers track cash inflows, cash outflows, and net cash flow with confidence. Instead of reviewing long tables, you get a clean dashboard that shows financial health at a glance and supports faster, smarter decisions.
Because the dashboard is built entirely in Google Sheets, it offers cloud access, real-time collaboration, automatic updates, and zero software cost.
✨ Key Features of the Cash Flow Dashboard in Google Sheets
📊 1. Real-Time Cash Flow Visibility
Instantly see how much cash is coming in, going out, and remaining available. The dashboard updates automatically whenever data changes.
💡 2. KPI Cards for Quick Financial Health Check
Clear KPI cards show Total Cash Inflow, Total Cash Outflow, and Net Cash Flow—making it easy to assess liquidity instantly.
📈 3. Visual Charts for Better Analysis
Department-wise, transaction-wise, and month-wise charts help you understand cash flow drivers clearly.
🤝 4. Cloud-Based & Collaborative
Finance teams and managers can work together in real time without version conflicts.
⚡ 5. Easy to Maintain & Customize
No complex formulas or tools required. Modify charts, fields, or logic as your business grows.
📦 What’s Inside the Cash Flow Dashboard in Google Sheets
🖥️ Dashboard Sheet Tab – Financial Overview
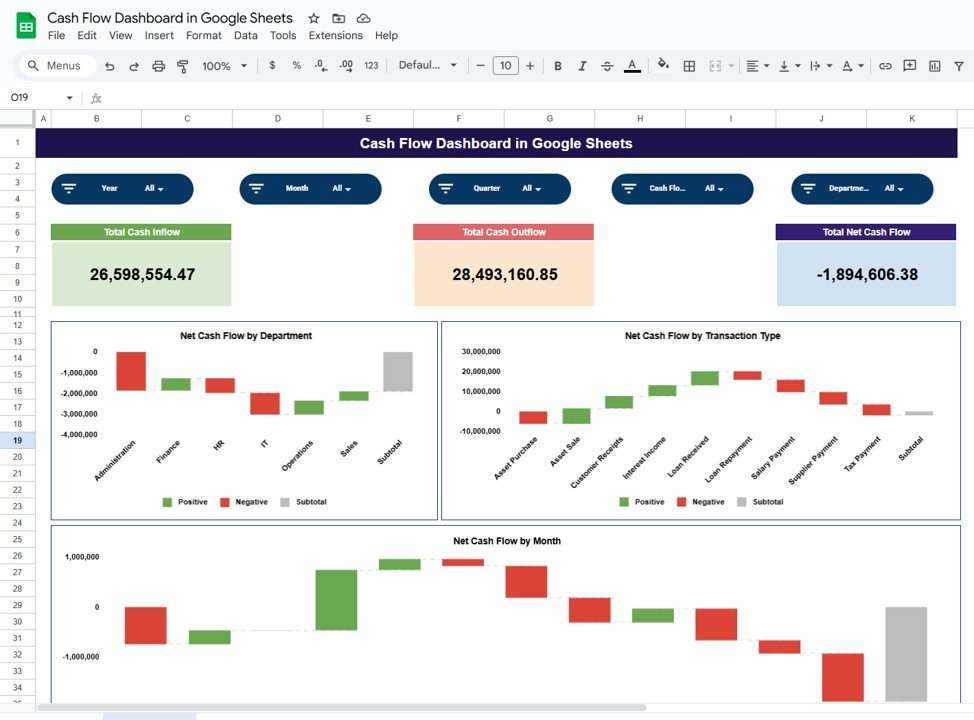
This is the main reporting page that displays KPIs and charts in a clean layout.
📌 KPI Cards on the Dashboard
-
Total Cash Inflow – Displays total cash received for the selected period
-
Total Cash Outflow – Shows total cash spent
-
Total Net Cash Flow – Calculates inflow minus outflow
These cards help you instantly understand financial stability.
📊 Charts That Turn Cash Data into Insights
📉 Net Cash Flow by Department
Shows which departments generate positive cash flow and which consume more cash—supporting better budget allocation.
📑 Net Cash Flow by Transaction Type
Breaks cash flow into categories such as sales, purchases, salaries, and operating expenses—helping teams understand cash drivers.
📆 Net Cash Flow by Month
Displays month-wise trends to identify seasonal patterns, low-cash periods, and growth phases.
All charts refresh automatically when data changes.
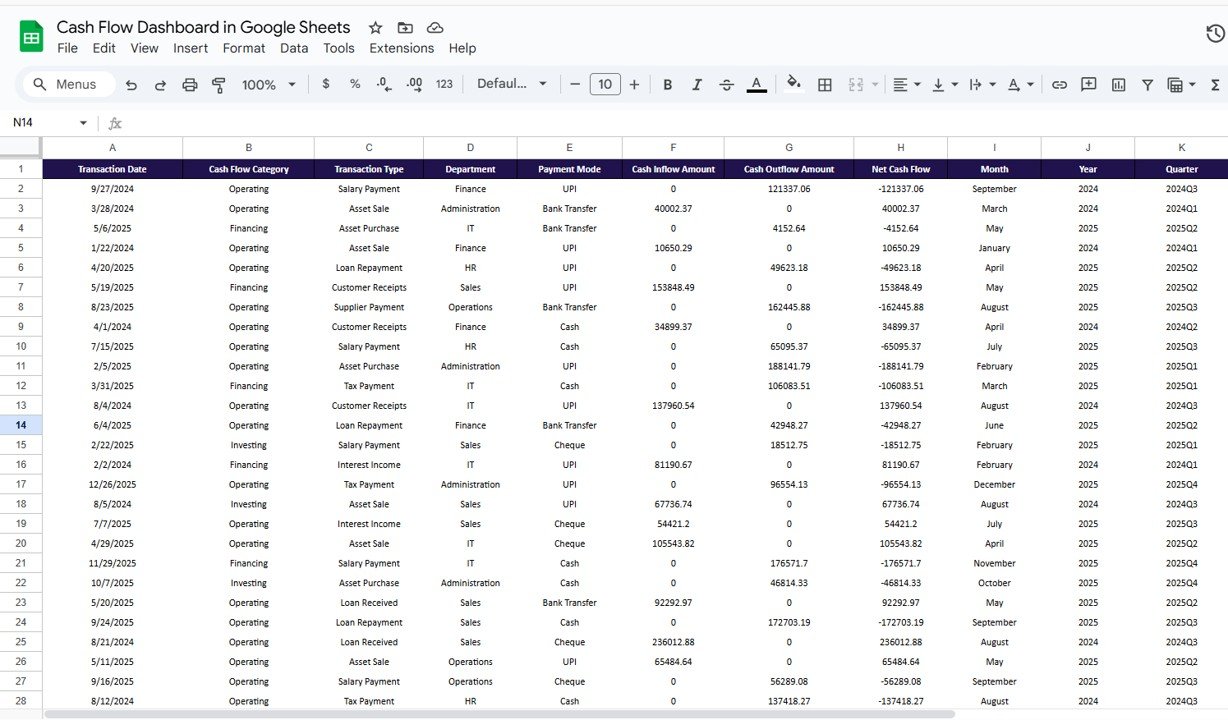
🗂️ Data Input Sheet Tab – Cash Flow Data Source
This sheet acts as the backbone of the dashboard. Typical columns include:
-
Transaction Date
-
Department
-
Transaction Type
-
Cash Inflow Amount
-
Cash Outflow Amount
-
Remarks
Once data is entered or updated, all KPI cards and charts update automatically.
🛠️ How to Use the Cash Flow Dashboard in Google Sheets
1️⃣ Enter Transaction Data Regularly
Update inflow and outflow details in the Data Input sheet.
2️⃣ Review KPI Cards Frequently
Quickly assess liquidity and net cash position.
3️⃣ Analyze Charts for Trends
Identify departments or transaction types causing cash pressure.
4️⃣ Share Insights with Teams
Collaborate with department heads and leadership using cloud access.
5️⃣ Improve Planning & Control
Use insights to control expenses and plan cash needs proactively.
🎯 Who Can Benefit from This Cash Flow Dashboard
💼 Business Owners
Understand cash health and avoid liquidity surprises.
📊 Finance Managers & Accountants
Monitor inflows, outflows, and net cash efficiently.
🏢 Department Heads
See how departmental activities impact cash flow.
🚀 Startups & SMEs
Manage cash carefully during growth phases.
📈 Leadership Teams
Support strategic planning with real-time financial insights.
### Click here to read the Detailed blog post
Watch the step-by-step video tutorial:


Reviews
There are no reviews yet.