Smart cities operate in an environment where transparency, compliance, and accountability are non-negotiable. Every procurement decision directly impacts public budgets, governance standards, service delivery, and citizen trust. However, when procurement data is scattered across spreadsheets, emails, and static reports, visibility drops, risks increase, and decision-making slows down.
That is exactly why the Smart Cities Procurement Dashboard in Power BI becomes an essential analytics solution 🚀
This powerful and ready-to-use Power BI dashboard transforms raw procurement data into clear KPIs, interactive visuals, and real-time insights. As a result, city administrators and procurement leaders gain full control over compliance, budgets, savings, and procurement performance—without manual reporting or complex analysis.
Designed specifically for smart city procurement environments, this dashboard strengthens governance, improves compliance monitoring, and enables confident, data-driven decisions.
Key Features of Smart Cities Procurement Dashboard in Power BI 🔑
📊 Centralized Procurement Visibility
Track all procurement activities across departments, procurement methods, requester teams, and time periods in one dashboard.
✅ Compliance Score Monitoring
Monitor procurement compliance clearly to reduce audit risks and governance gaps.
💰 Planned Budget & Savings Tracking
Analyze planned budgets and negotiated savings by department, method, and requester team.
⏳ In-Progress Order Monitoring
Identify stalled or delayed purchase orders early.
🏢 Department-Wise Performance Analysis
Compare compliance, lead time, and savings contribution across departments.
🧑💼 Requester Team Accountability
Evaluate procurement discipline at the request initiation level.
📅 Monthly Procurement Trends
Track budget usage, order volume, and savings growth over time.
🧭 Interactive Slicers & Drill-Downs
Filter insights instantly by city, department, procurement method, or month.
What’s Inside the Smart Cities Procurement Dashboard in Power BI 📁
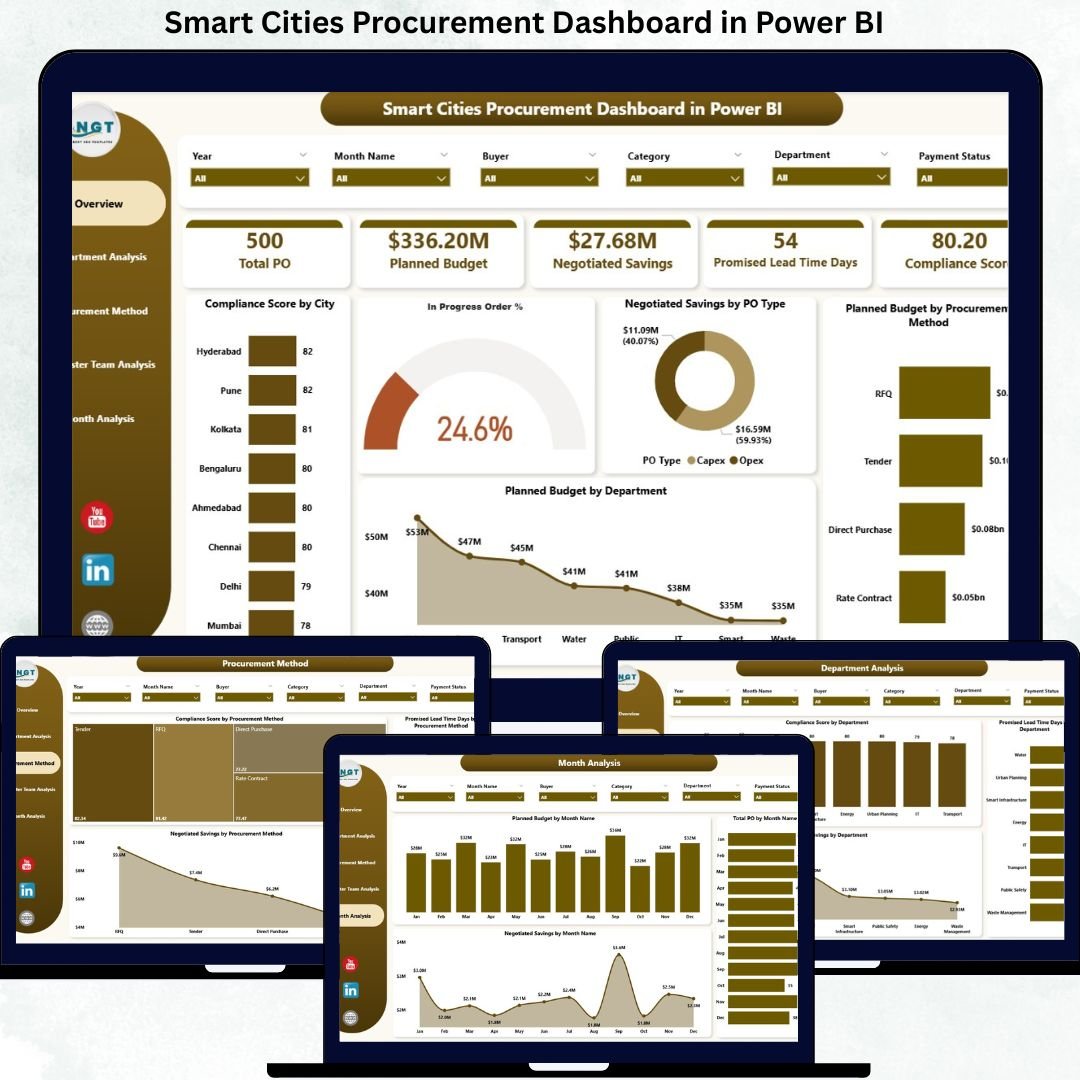
This dashboard includes five professionally designed analytical pages, each focused on a specific procurement insight.
📄 Overview Page
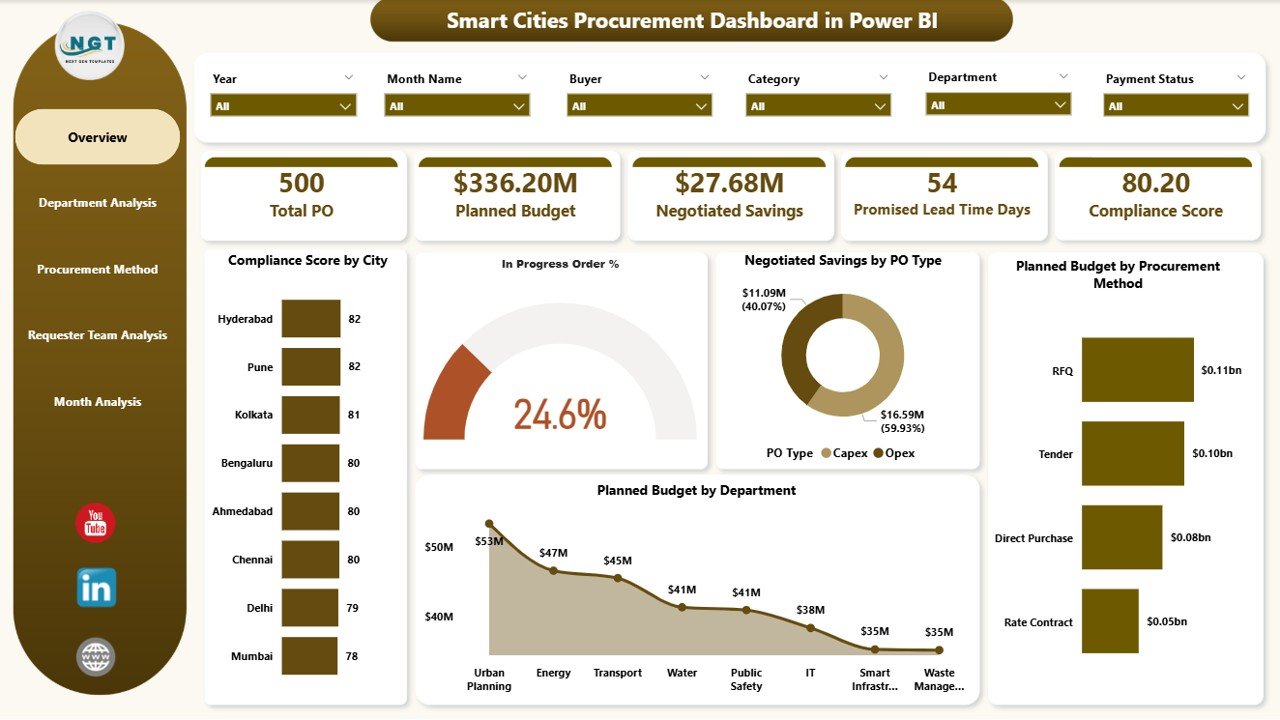
The executive control center for smart city leadership.
Includes:
-
Slicers: City, Department, Procurement Method, Time Period
-
KPI Cards:
-
Compliance Score
-
In-Progress Order %
-
Negotiated Savings
-
Planned Budget
-
-
Visuals:
-
Compliance Score by City
-
In-Progress Order %
-
Negotiated Saving by PO Type
-
Planned Budget by Procurement Method
-
Planned Budget by Department
-
This page provides an instant snapshot of procurement health.
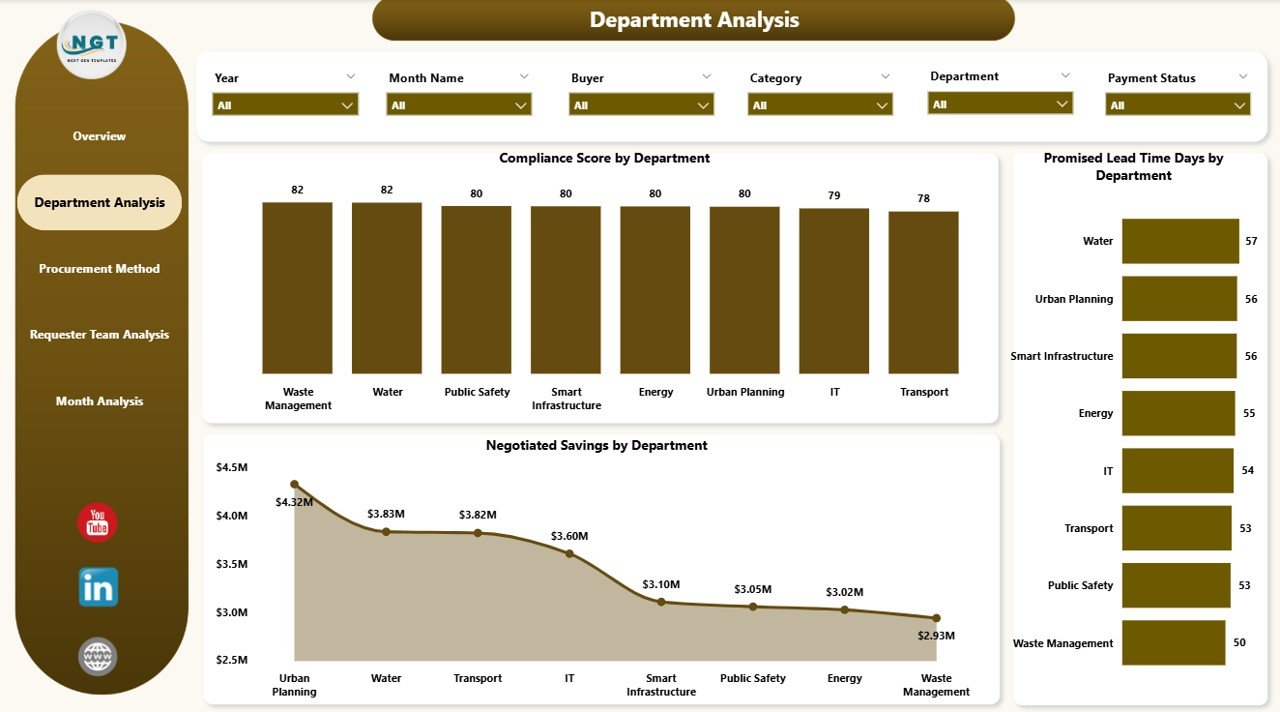
📄 Department Analysis Page
Evaluates procurement performance at the departmental level.
Includes:
-
Compliance Score by Department
-
Promised Lead Time (Days) by Department
-
Negotiated Saving by Department
This view helps leadership identify compliance gaps and efficiency issues across departments.
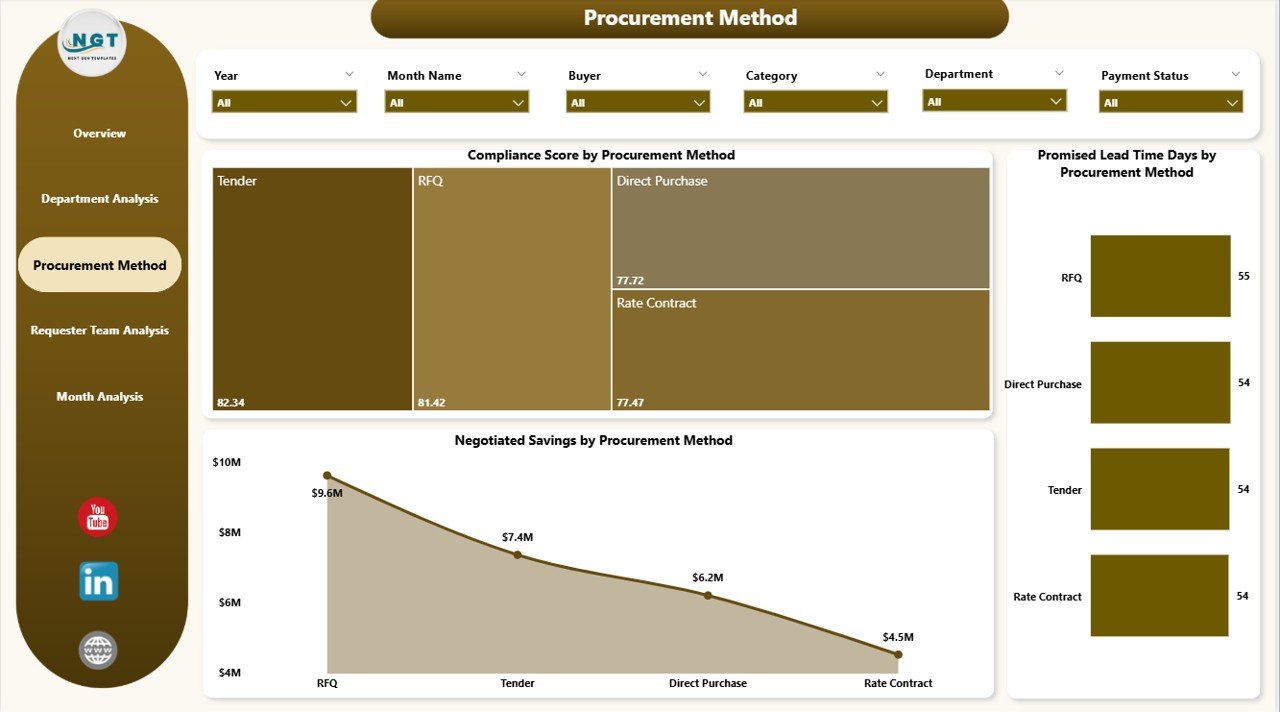
📄 Procurement Method Analysis Page
Analyzes the effectiveness of different procurement methods.
Includes:
-
Compliance Score by Procurement Method
-
Promised Lead Time (Days) by Procurement Method
-
Negotiated Saving by Procurement Method
This page supports optimization of procurement strategies and policy decisions.
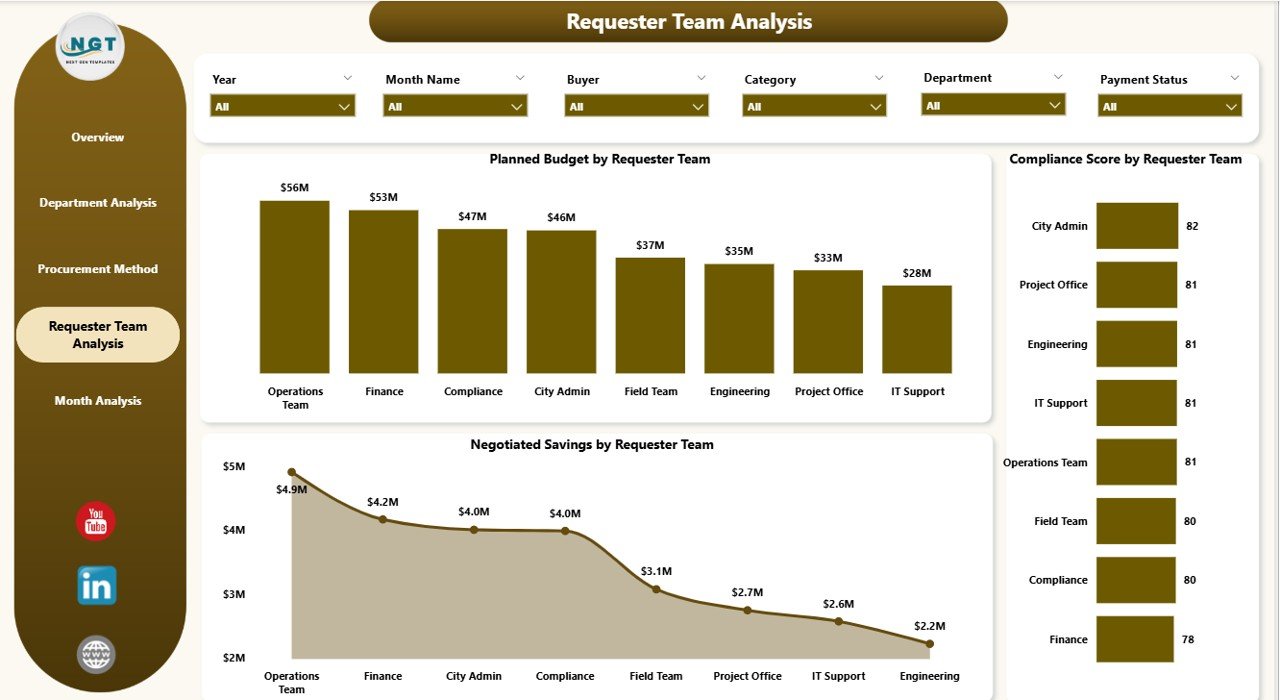
📄 Requester Team Analysis Page
Focuses on the teams that initiate procurement requests.
Includes:
-
Planned Budget by Requester Team
-
Compliance Score by Requester Team
-
Negotiated Saving by Requester Team
This analysis improves accountability and responsible procurement behavior.
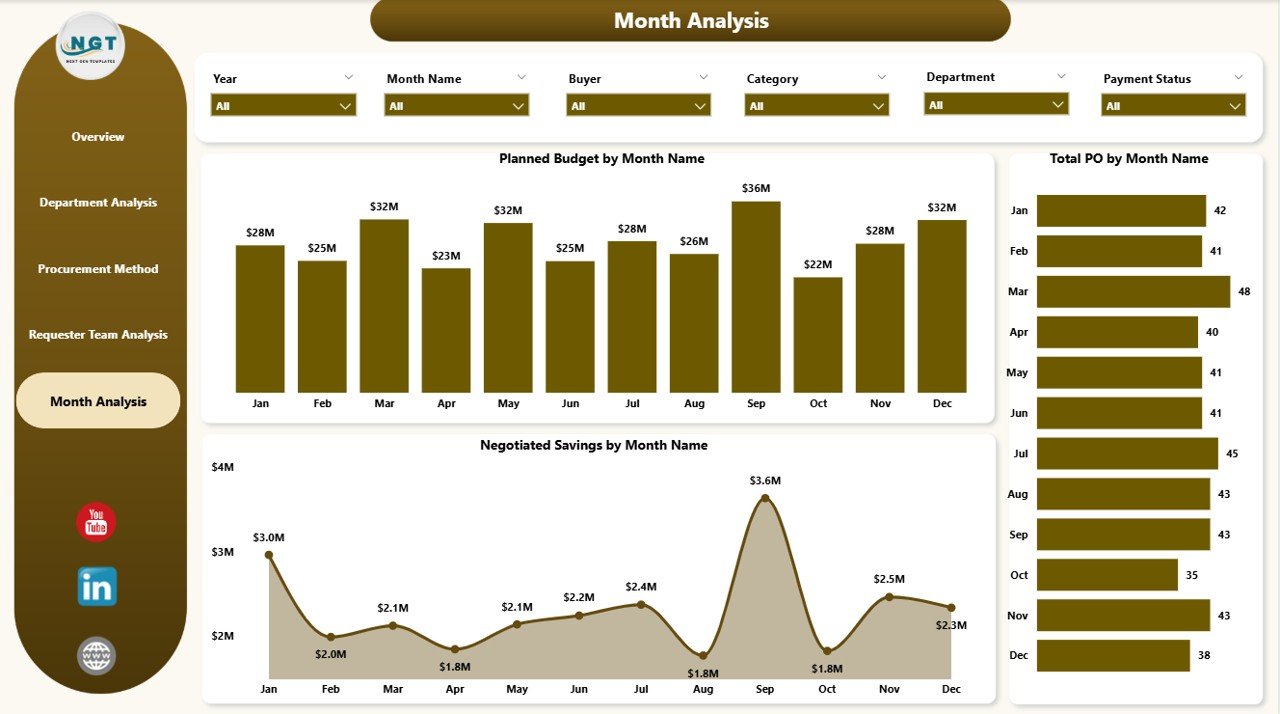
📄 Monthly Trends Page
Tracks procurement performance over time.
Includes:
-
Planned Budget by Month
-
Total Purchase Orders by Month
-
Negotiated Saving by Month
This page helps forecast budgets and identify seasonal procurement patterns.
How to Use the Smart Cities Procurement Dashboard in Power BI 🛠️
1️⃣ Connect your procurement data from Excel, ERP, or databases
2️⃣ Refresh the Power BI dataset
3️⃣ Use slicers to filter by city, department, or procurement method
4️⃣ Review compliance, savings, and in-progress orders
5️⃣ Use insights for audits, reviews, and planning
No manual calculations. No static reports. Just actionable intelligence.
Who Can Benefit from This Smart Cities Procurement Dashboard 👥
🏙️ City Administrators – Improve transparency and governance
📊 Procurement Managers – Monitor compliance and efficiency
💰 Finance & Budget Teams – Strengthen fiscal control
🧾 Audit & Compliance Officers – Simplify reviews and audits
🧑💼 Smart City Program Leaders – Enable data-driven policies
Suitable for both mid-size cities and large smart city programs.


Reviews
There are no reviews yet.