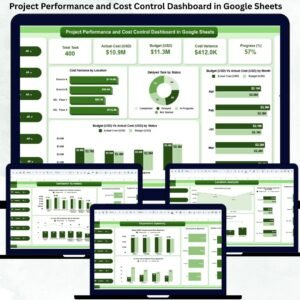
Managing projects without clear visibility into cost, progress, delays, and performance creates serious financial and operational risks. Budget overruns, delayed tasks, contractor inefficiencies, and location-level cost leakages can quickly derail even well-planned projects. However, many organizations still rely on manual spreadsheets, static reports, or disconnected tools, which slow down decision-making and reduce control.Project Performance and Cost Control Dashboard in Google Sheets
That is exactly where the Project Performance and Cost Control Dashboard in Google Sheets becomes a powerful and practical solution.
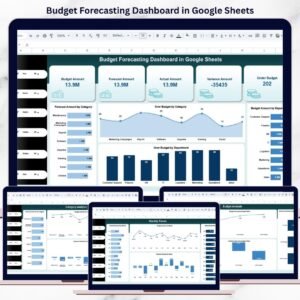
This ready-to-use dashboard gives project managers, PMOs, finance teams, and leadership a single, centralized view of project health. It combines budget tracking, actual cost monitoring, cost variance analysis, task progress, delay tracking, and performance insights across departments, contractors, and locations. Instead of guessing where problems exist, teams can identify risks instantly and take corrective action early.
Because the dashboard is built entirely in Google Sheets, it is cloud-based, collaborative, flexible, and cost-effective. Multiple users can work simultaneously, data updates in real time, and no expensive project management software or technical expertise is required.
🚀 Key Features of the Project Performance and Cost Control Dashboard
-
📊 Centralized project cost & performance tracking
-
💰 Budget vs Actual cost comparison
-
📉 Cost variance analysis with visual insights
-
⏱️ On-time vs delayed task monitoring
-
🏢 Department-wise performance analysis
-
👷 Contractor-wise cost & progress control
-
📍 Location-level cost and delay visibility
-
🔍 Smart search by keyword & field name
-
🤝 Real-time collaboration in Google Sheets
-
⚙️ Fully customizable for any project type
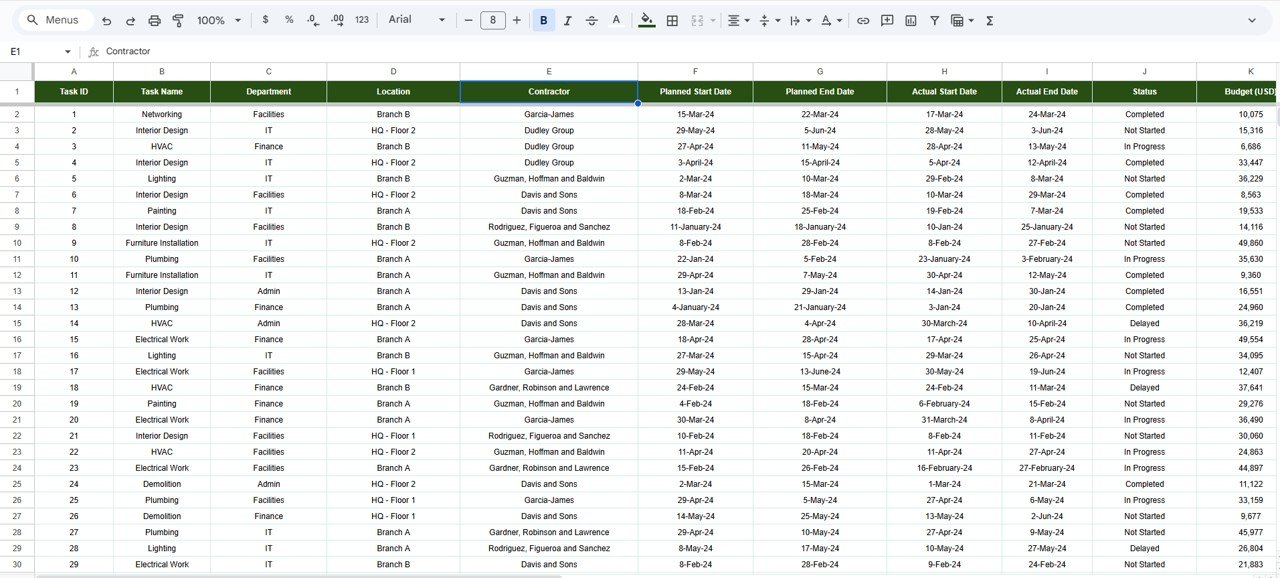
📦 What’s Inside the Project Performance and Cost Control Dashboard
The dashboard is structured into multiple analytical sections, each designed to support a specific management perspective.
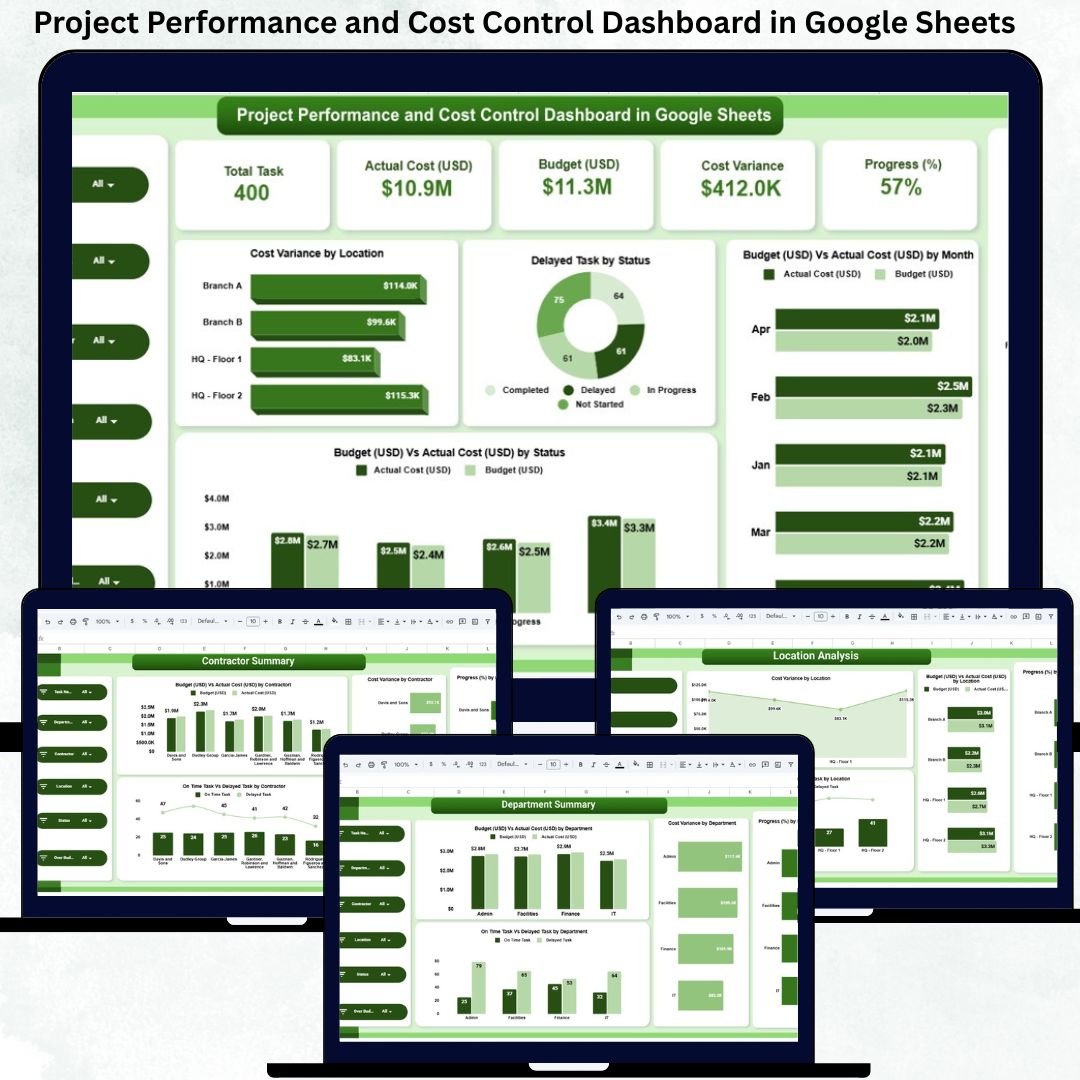
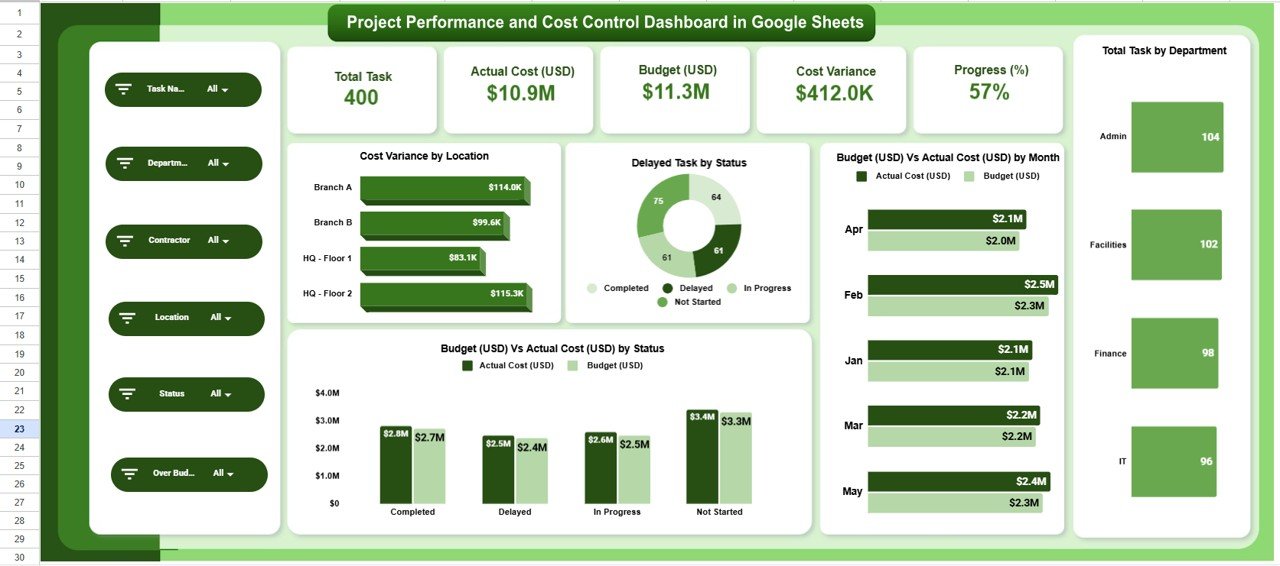
📌 Overview Sheet Tab – Executive Summary
This is the main control panel for leadership.
KPI Cards Displayed
-
Total Tasks – Total tasks across all projects
-
Actual Cost (USD) – Total cost incurred
-
Budget (USD) – Approved project budget
-
Cost Variance – Difference between budget and actual
-
Progress (%) – Overall project completion
Charts Included
-
📍 Cost Variance by Location
-
⏱️ Delayed Tasks by Status
-
📆 Budget vs Actual Cost by Month
-
📊 Budget vs Actual Cost by Status
This page gives executives instant clarity on project health.
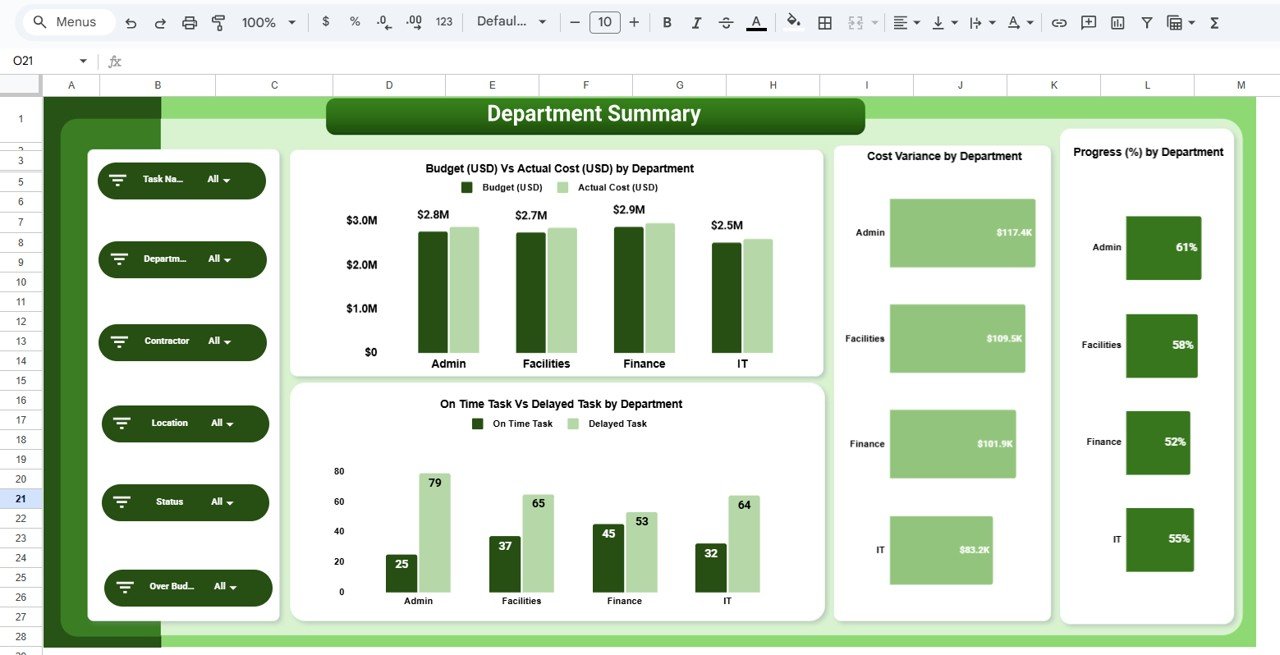
🏢 Department Summary – Internal Performance Tracking
This section evaluates how departments manage cost and delivery.
Key Insights
-
Budget vs Actual Cost by Department
-
Cost Variance by Department
-
On-Time vs Delayed Tasks by Department
-
Progress (%) by Department
It helps leadership identify high-performing and high-risk departments quickly.
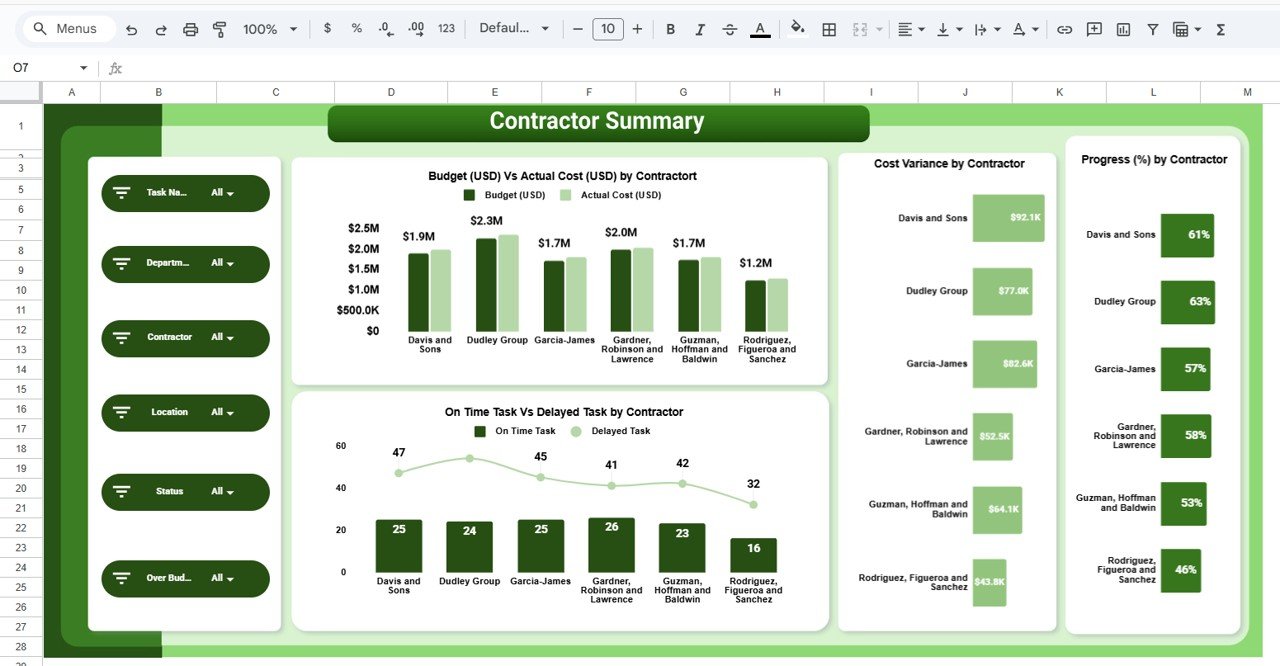
👷 Contractor Summary – Vendor Performance Control
Contractors often drive cost overruns and delays. This section ensures accountability.
Charts Included
-
Budget vs Actual Cost by Contractor
-
Cost Variance by Contractor
-
Progress (%) by Contractor
-
On-Time vs Delayed Tasks by Contractor
These insights support better contract management and vendor decisions.
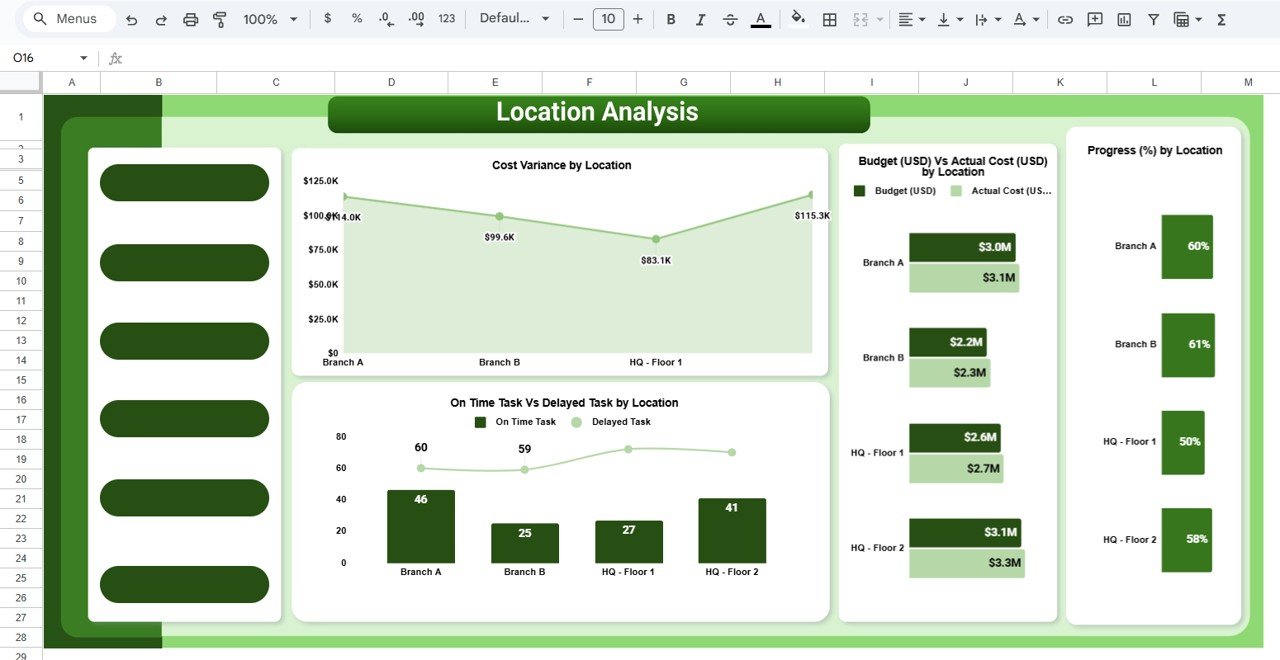
📍 Location Analysis – Site-Level Insights
Projects across multiple sites require location-specific visibility.
Key Charts
-
Cost Variance by Location
-
Budget vs Actual Cost by Location
-
Progress (%) by Location
-
On-Time vs Delayed Tasks by Location
This enables effective regional planning and resource allocation.
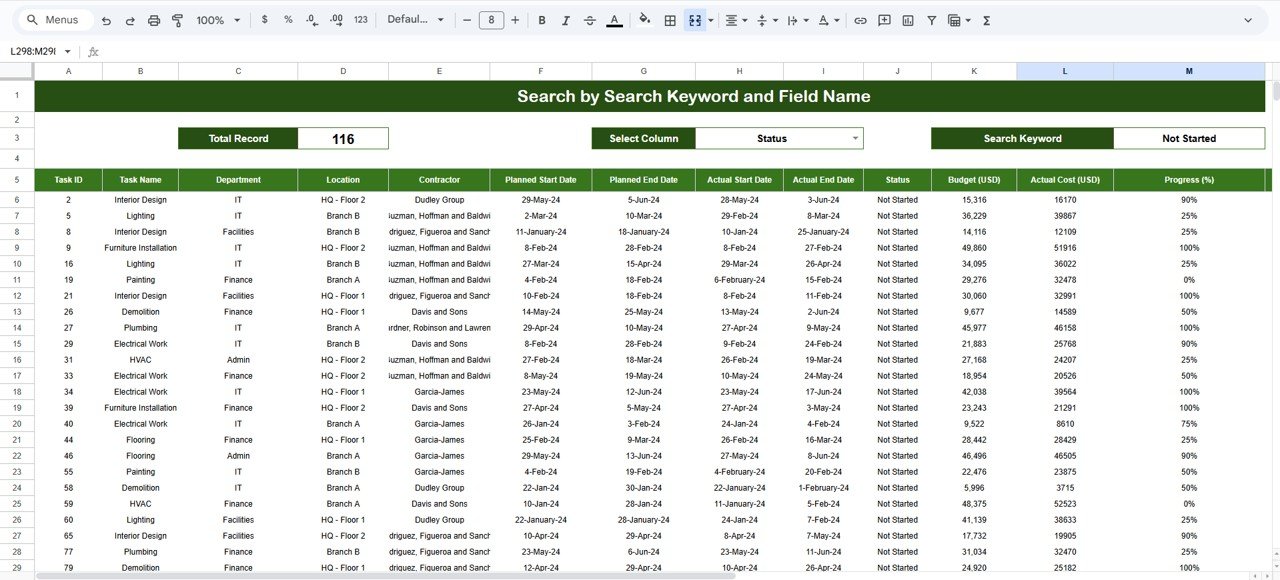
🔍 Search Functionality – Smart & Fast Lookup
The dashboard includes a powerful search panel.
You can search by:
-
Project Name
-
Department
-
Contractor
-
Location
-
Status or Delay Type
Simply enter a Search Keyword and select a Field Name, and matching records appear instantly—saving hours during reviews and audits.
🛠️ How to Use the Project Performance and Cost Control Dashboard
1️⃣ Update task, cost, and progress data regularly
2️⃣ Review KPI cards for quick status checks
3️⃣ Monitor cost variance and delays
4️⃣ Analyze department, contractor, and location views
5️⃣ Use search during meetings and audits
6️⃣ Take early corrective action based on insights
👥 Who Can Benefit from This Dashboard
-
🧑💼 Project Managers
-
🏗️ PMO Teams
-
💼 Finance & Cost Control Teams
-
🏢 Operations Managers
-
📊 Leadership & Executives
-
🏗️ Construction, IT, Infrastructure & Consulting Teams
### Click here to read the Detailed blog post
Watch the step-by-step video tutorial:


Reviews
There are no reviews yet.