Digital creators today are no longer hobbyists. They operate like full-scale businesses, managing sponsorships, ad revenue, production costs, platform fees, and audience engagement across multiple platforms. Digital Creators Guilds Dashboard in Excel When creators work under a guild or collective, the complexity increases even further. Unfortunately, most guilds still rely on scattered spreadsheets, manual calculations, and disconnected reports. As a result, visibility drops, decisions slow down, and profitability suffers.
That is exactly why the Digital Creators Guilds Dashboard in Excel becomes a powerful, practical, and business-ready solution.
Digital Creators Guilds Dashboard in Excel This ready-to-use Excel dashboard helps digital creator guilds track costs, revenue, profit, engagement, and satisfaction from one centralized file. Instead of juggling multiple tools, guild managers get a clean, interactive, and visual dashboard that transforms raw data into actionable insights.
Most importantly, because it runs entirely in Microsoft Excel, this dashboard remains cost-effective, flexible, and easy to customize for different creator business models.
What Is a Digital Creators Guilds Dashboard in Excel?
A Digital Creators Guilds Dashboard in Excel is an analytical Excel template designed to monitor and analyze the financial and performance data of digital creators working under a guild or collective.
Rather than reviewing raw tables, this dashboard converts creator data into KPI cards, charts, slicers, and trend visuals. As a result, guild managers can instantly understand:
-
Cost vs revenue performance
-
Profitability by creator group
-
Engagement trends
-
Platform efficiency
-
Monthly growth patterns
Because it is Excel-based, no advanced BI tools or licenses are required.
📊 Key Features of Digital Creators Guilds Dashboard in Excel
🚀 Centralized Creator Performance Tracking
All financial and engagement metrics in one dashboard.
💰 Cost, Revenue & Profit Visibility
Clear tracking of earnings and expenses.
🌐 Platform & Country Analysis
Compare creator performance across platforms and regions.
📈 Monthly Trend Monitoring
Identify seasonality and performance shifts.
🧭 Left-Side Page Navigator
Quick navigation without searching sheet tabs.
🧩 Excel-Based & Customizable
Modify KPIs, creators, and platforms easily.
📦 What’s Inside the Digital Creators Guilds Dashboard in Excel?
The dashboard contains 5 professionally designed analysis pages; each focused on a specific performance area.
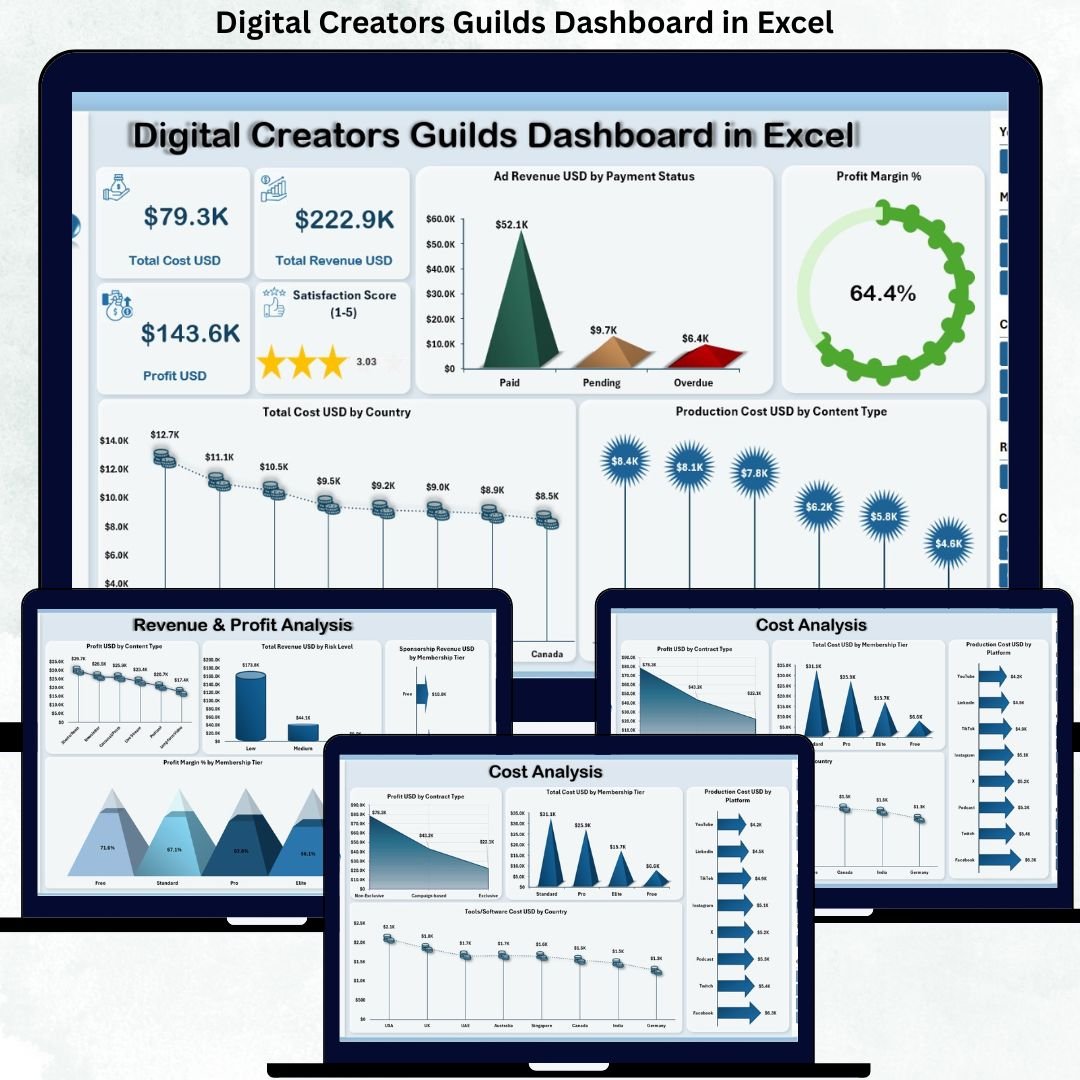
🧭 1. Overview Page – Executive Snapshot
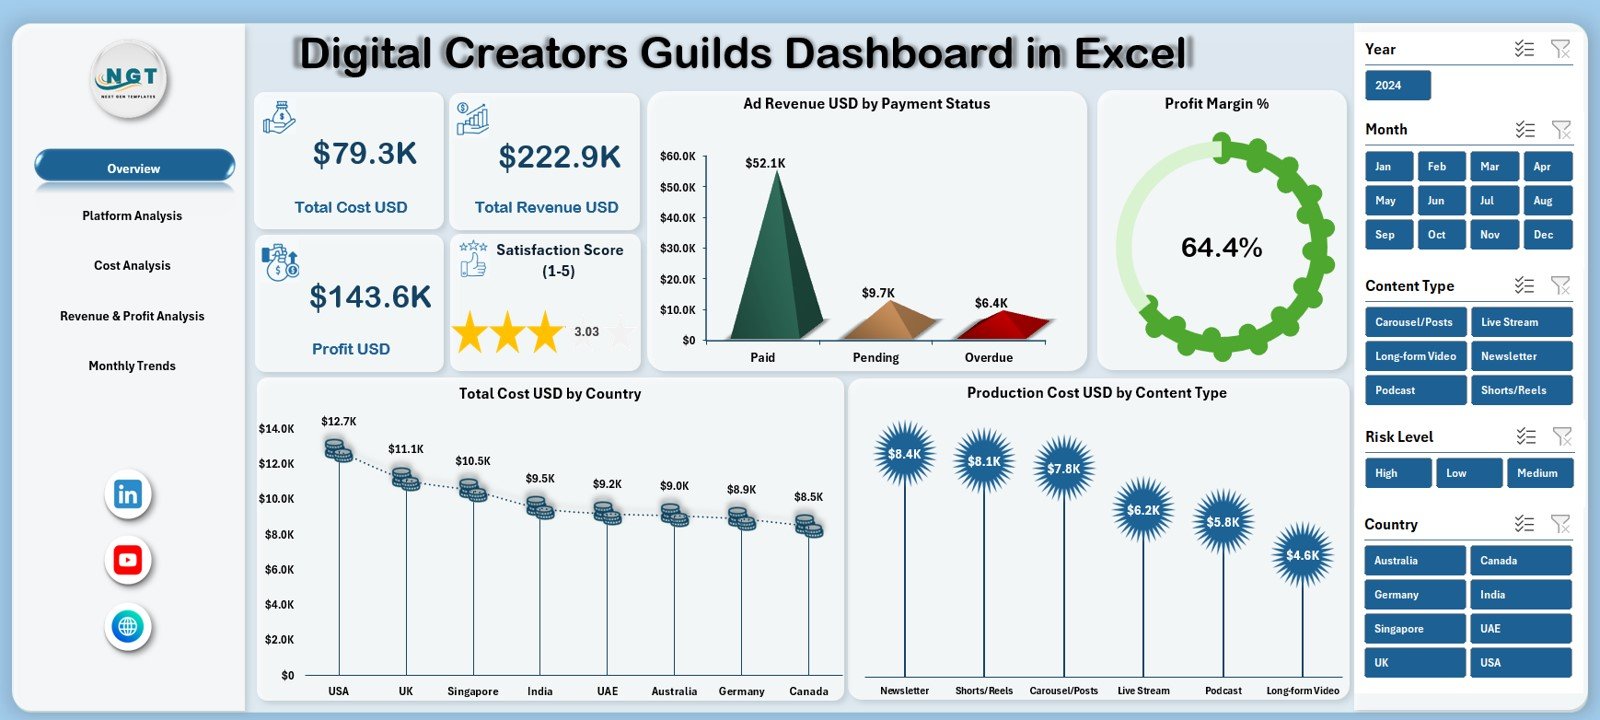
The Overview Page acts as the control center of the dashboard.
KPI Cards Displayed:
-
💰 Total Cost USD
-
💵 Total Revenue USD
-
📈 Profit USD
-
⭐ Satisfaction Score (1–5)
Charts on the Overview Page:
-
Ad Revenue USD by Payment Status
-
Profit Margin %
-
Total Cost USD by Country
-
Production Cost USD by Content Type
This page gives guild managers an instant financial and performance overview.
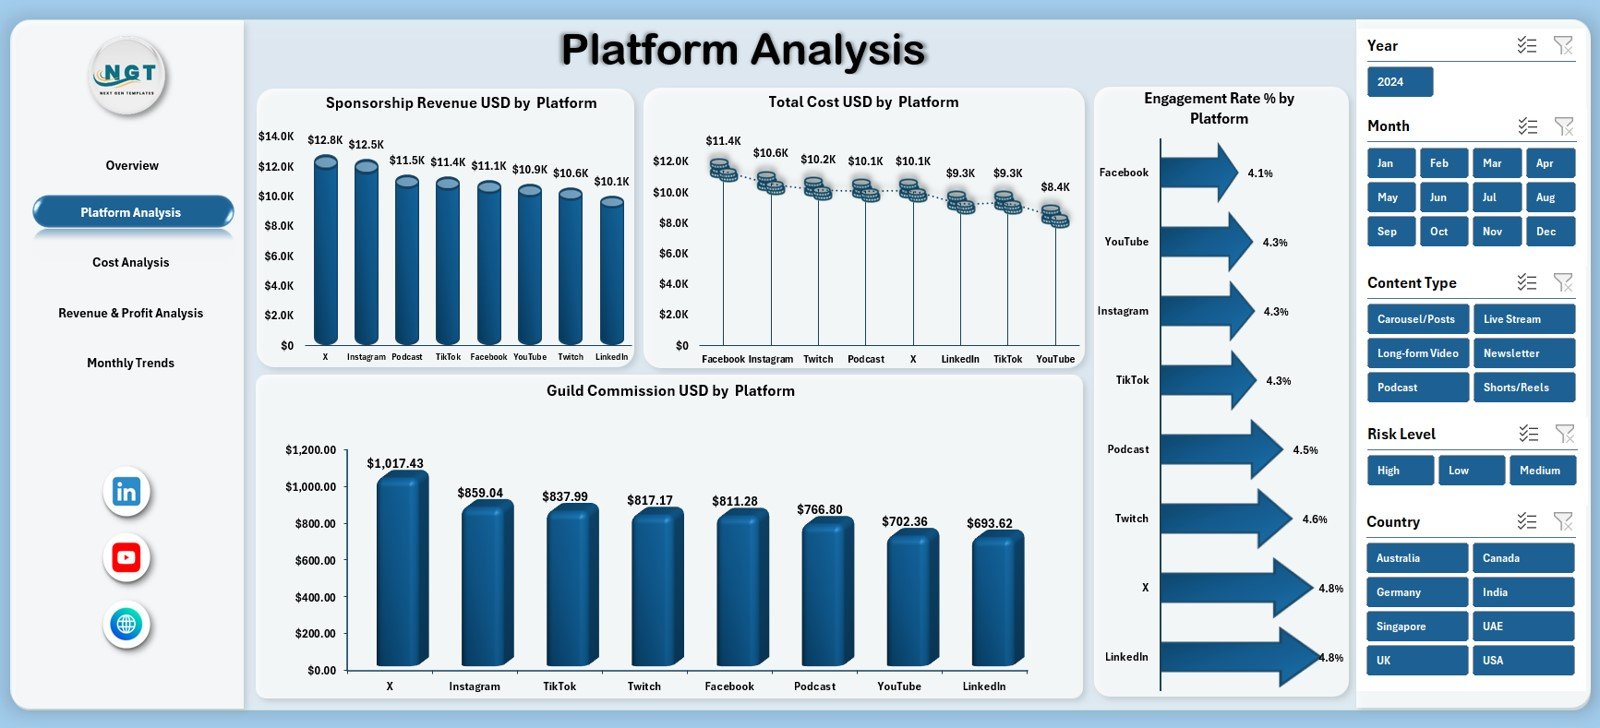
📱 2. Platform Analysis Page – Platform Performance
Focuses on creator performance across platforms.
Charts Included:
-
Sponsorship Revenue USD by Platform
-
Total Cost USD by Platform
-
Engagement Rate % by Platform
-
Guild Commission USD by Platform
This page helps guilds optimize platform allocation and investments.
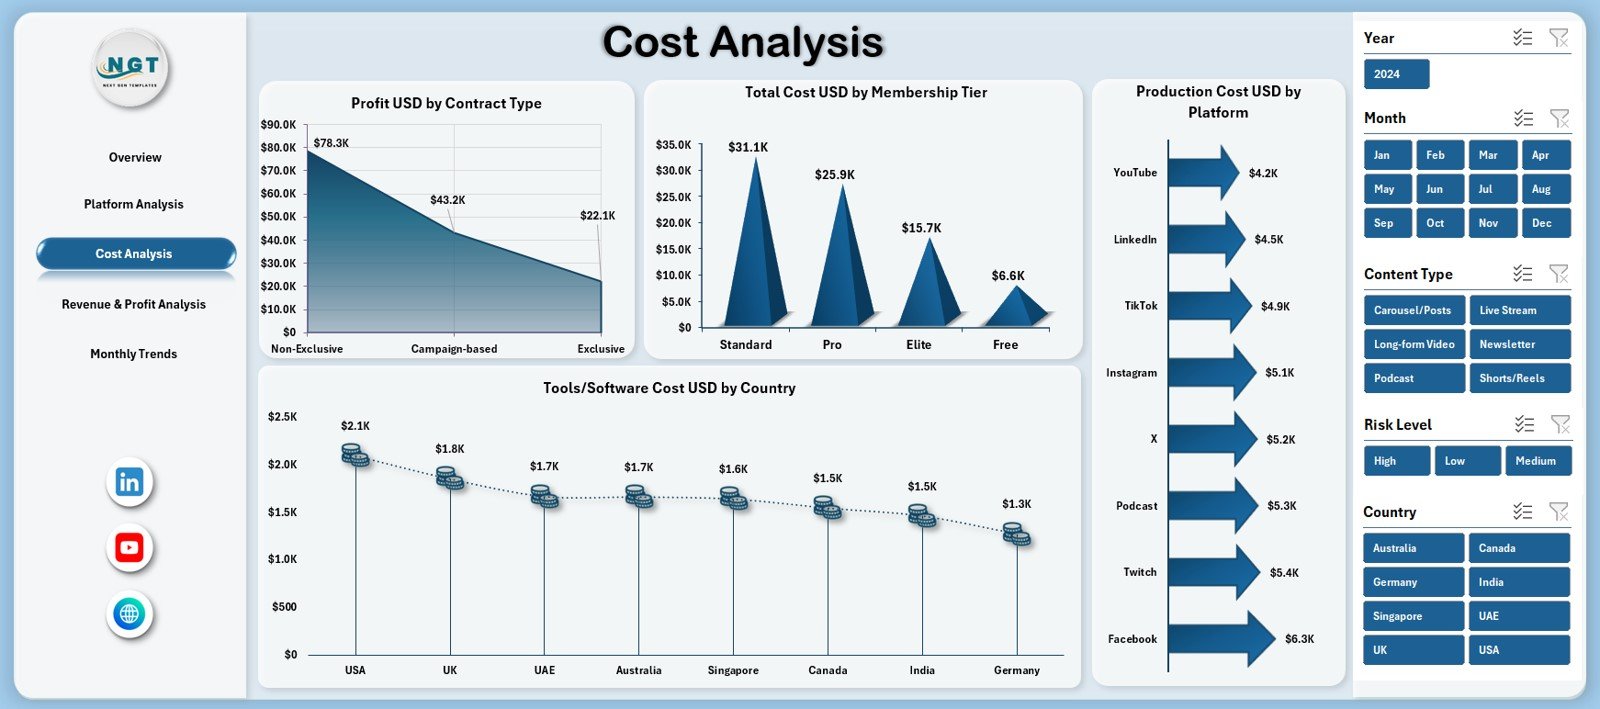
💸 3. Cost Analysis Page – Expense Control
Provides deep insight into spending patterns.
Charts Included:
-
Profit USD by Contract Type
-
Total Cost USD by Membership Tier
-
Production Cost USD by Platform
-
Tool / Software Cost USD by Country
This analysis helps control costs and improve margins.
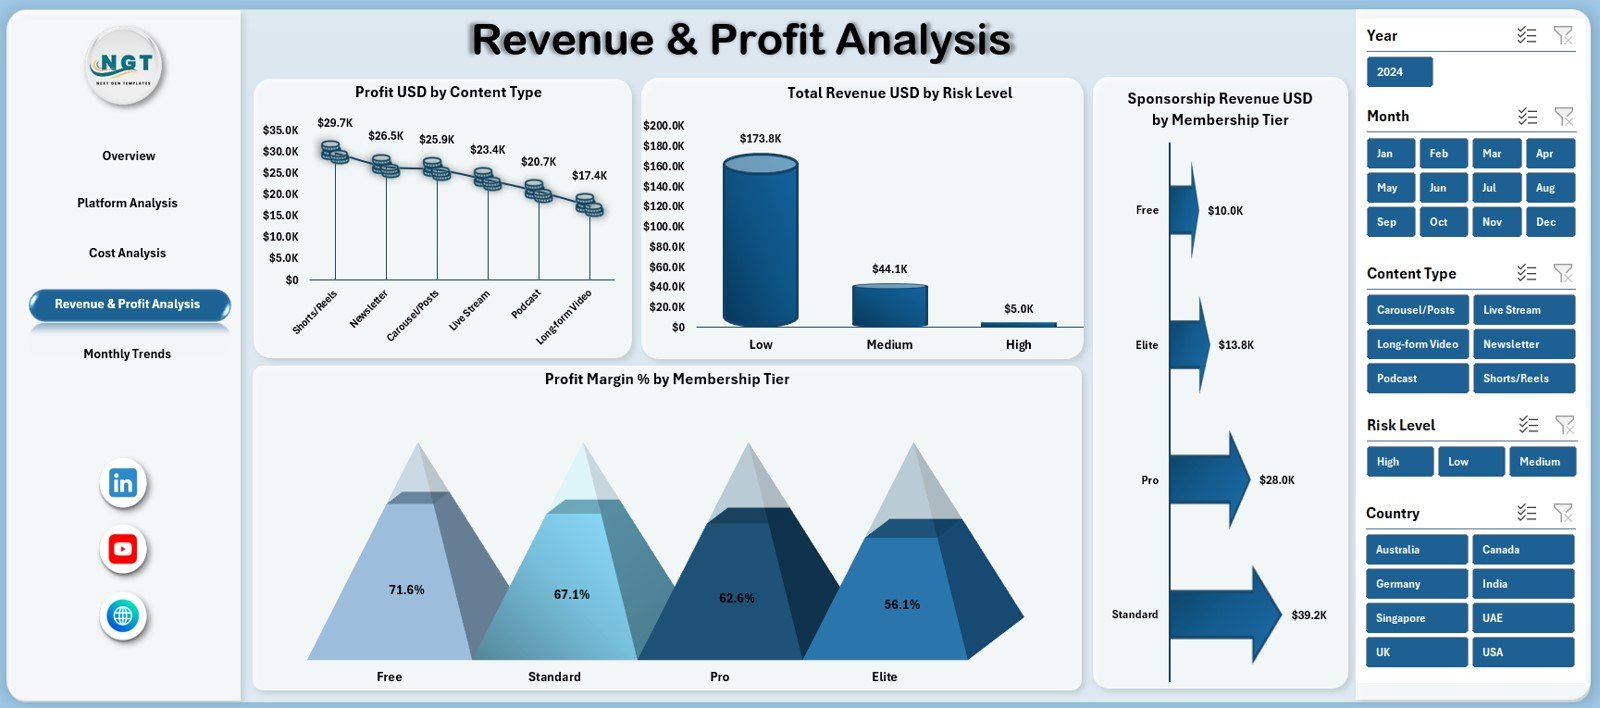
💵 4. Revenue & Profit Analysis Page – Monetization Insights
Focuses on earnings and profitability drivers.
Charts Included:
-
Profit USD by Content Type
-
Total Revenue USD by Risk Level
-
Profit Margin % by Membership Tier
-
Sponsorship Revenue USD by Membership Tier
This page helps guilds focus on high-margin content and memberships.
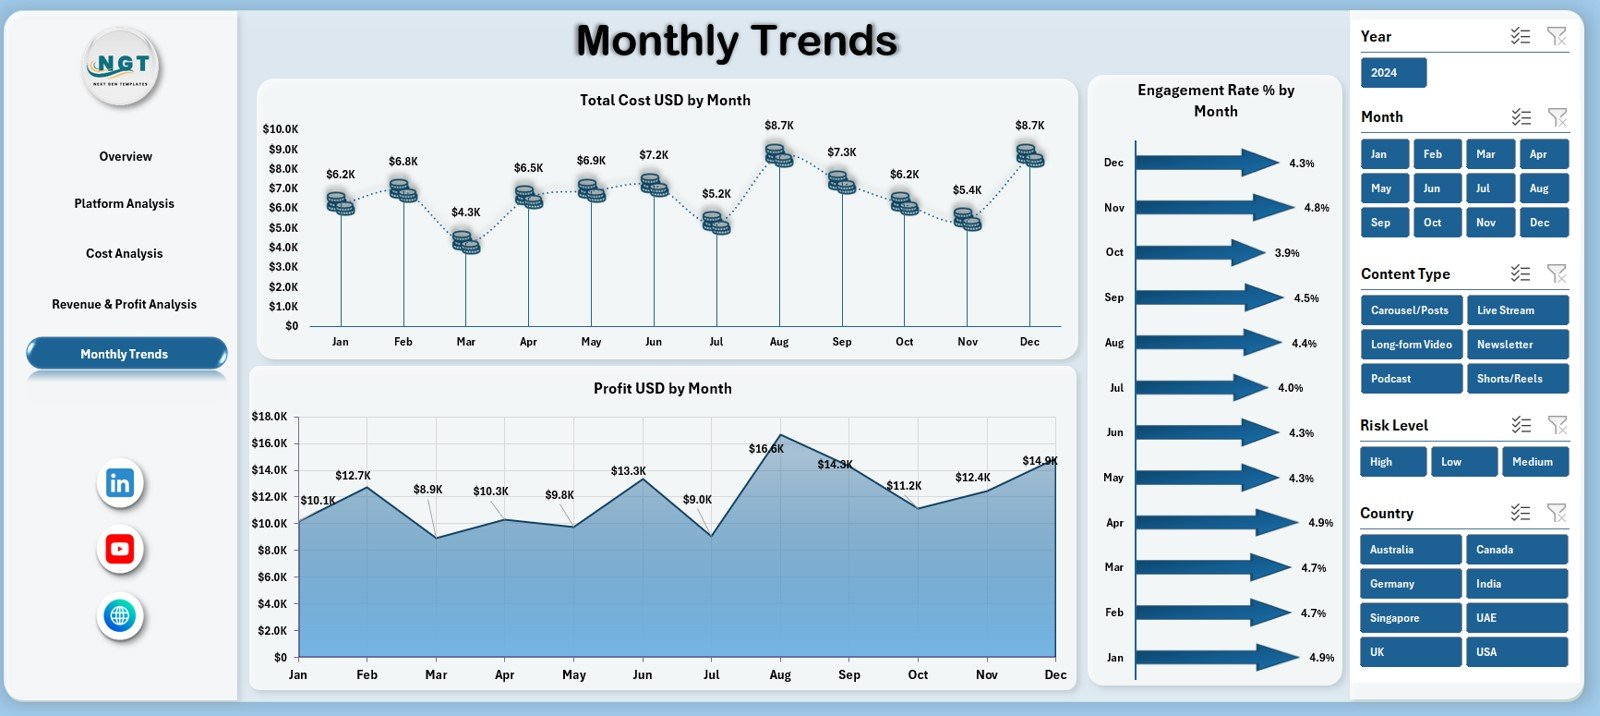
📅 5. Monthly Trends Page – Growth Over Time
Tracks performance trends across months.
Charts Included:
-
Total Cost USD by Month
-
Engagement Rate % by Month
-
Profit USD by Month
These trends support better forecasting and planning.
👥 Who Can Benefit from This Dashboard?
✔ Digital Creator Guild Managers
✔ Influencer Networks
✔ Content Collectives
✔ Digital Media Agencies
✔ Finance & Operations Teams
✔ Business Analysts
Suitable for small creator groups as well as large guilds.
🌟 Advantages of Digital Creators Guilds Dashboard in Excel
✔ Centralized creator data management
✔ Clear profitability and cost insights
✔ Better engagement tracking
✔ Faster, data-driven decisions
✔ Easy Excel-based customization
✔ No expensive BI tools required
Conclusion
The Digital Creators Guilds Dashboard in Excel transforms creator operations into a structured, data-driven business system. It replaces scattered spreadsheets with one powerful dashboard that delivers clarity, control, and confidence.
For guilds aiming to scale sustainably, improve profitability, and manage creators professionally, this dashboard becomes an essential management tool.


Reviews
There are no reviews yet.