


Freight forwarding is a backbone of global trade. Every day, logistics teams coordinate shipments, manage transit times, control costs, and meet strict delivery commitments. However, when performance data is spread across multiple spreadsheets and manual reports, visibility disappears. As a result, delays, inefficiencies, and cost overruns often go unnoticed.
That is exactly where the Freight Forwarding KPI Dashboard in Excel becomes an essential logistics performance management tool.
This ready-to-use Excel dashboard provides a centralized, structured, and visual system to track all critical freight forwarding KPIs in one place. By combining automated calculations, conditional formatting, and trend analysis, the dashboard transforms raw logistics data into clear, actionable insights for operations, finance, and management teams.
What Is a Freight Forwarding KPI Dashboard in Excel?
A Freight Forwarding KPI Dashboard in Excel is a professionally designed Excel-based reporting template that tracks key performance indicators related to freight forwarding and logistics operations.
Instead of manually reviewing shipment data, cost reports, and service metrics, this dashboard consolidates everything into a single interactive workbook. As a result, users can instantly analyze performance at both:
Month-to-Date (MTD) level
Year-to-Date (YTD) level
Because the dashboard runs entirely in Microsoft Excel, it remains cost-effective, flexible, and easy to customize for air, sea, road, or multimodal freight forwarding businesses.
Why Do Freight Forwarders Need a KPI Dashboard?
Freight forwarding involves multiple moving parts—shipments, transit times, carrier coordination, documentation, and cost control. Without structured KPI tracking, small inefficiencies quickly turn into major operational issues.
The Freight Forwarding KPI Dashboard in Excel helps because it:
✔ Centralizes all logistics KPIs in one file
✔ Tracks MTD and YTD performance clearly
✔ Compares Actual vs Target results
✔ Compares Current Year vs Previous Year
✔ Highlights delays and gaps instantly
✔ Supports data-driven operational decisions
As a result, freight forwarders gain better control, accountability, and profitability.
📊 Key Features of Freight Forwarding KPI Dashboard in Excel
🚀 Centralized KPI Tracking
All freight forwarding KPIs in one structured Excel dashboard.
📅 MTD & YTD Performance Monitoring
Track both short-term execution and long-term trends.
🎯 Target vs Actual Comparison
Instantly identify KPIs that miss targets.
🔁 Previous Year Comparison
Analyze growth, decline, and seasonality.
📈 Trend Analysis
Visual MTD and YTD trend charts for each KPI.
⚙️ 100% Excel-Based
No Power BI or external tools required.
📦 What’s Inside the Freight Forwarding KPI Dashboard?
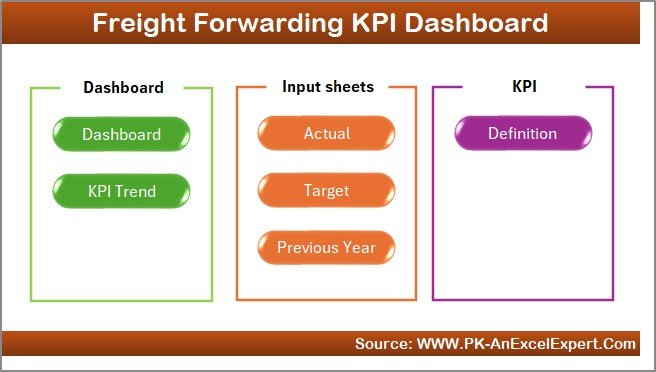
The dashboard includes 7 well-structured Excel worksheets, designed for clarity and ease of use.
🏠 1. Home Sheet – Easy Navigation
Clean index page
6 navigation buttons
One-click access to all sheets
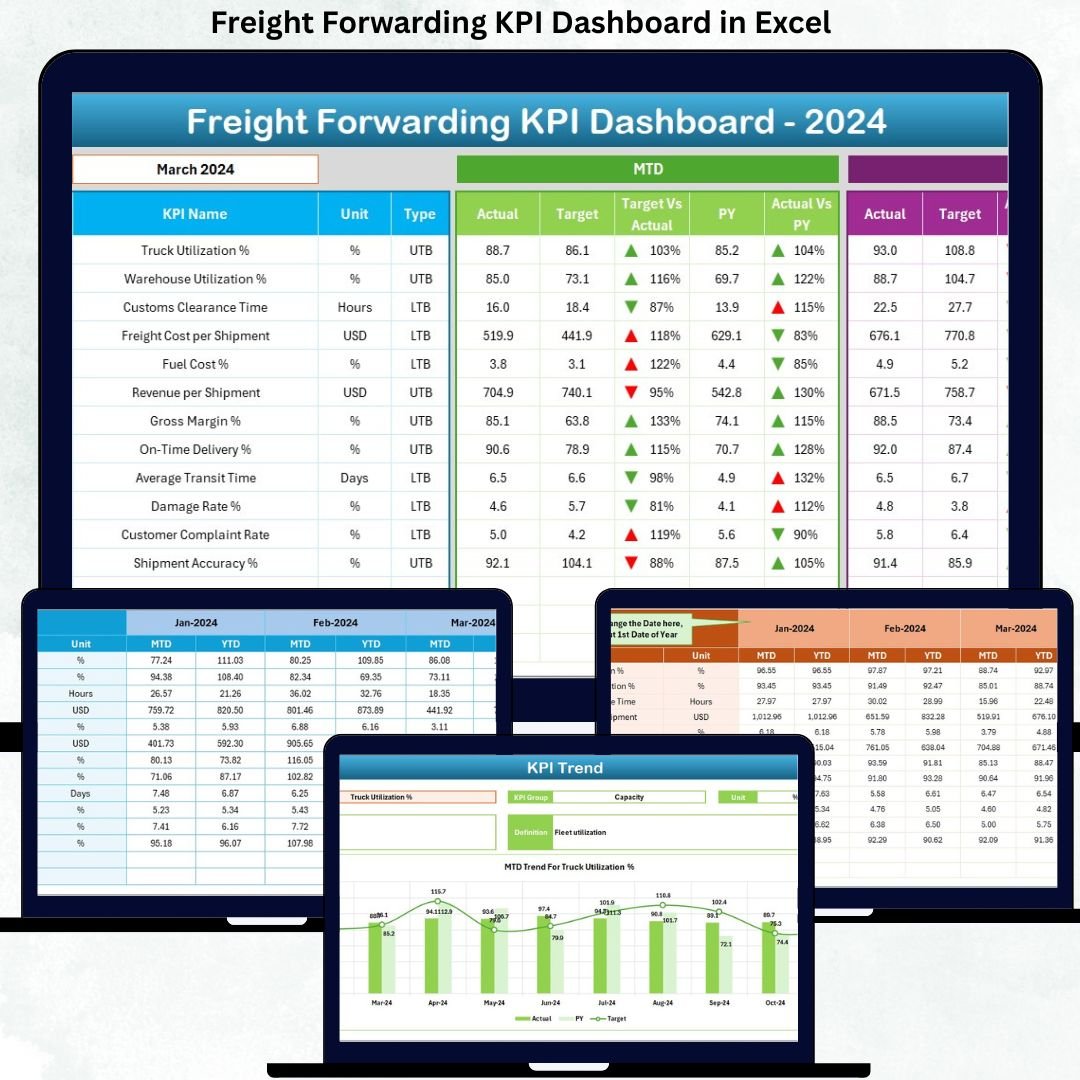
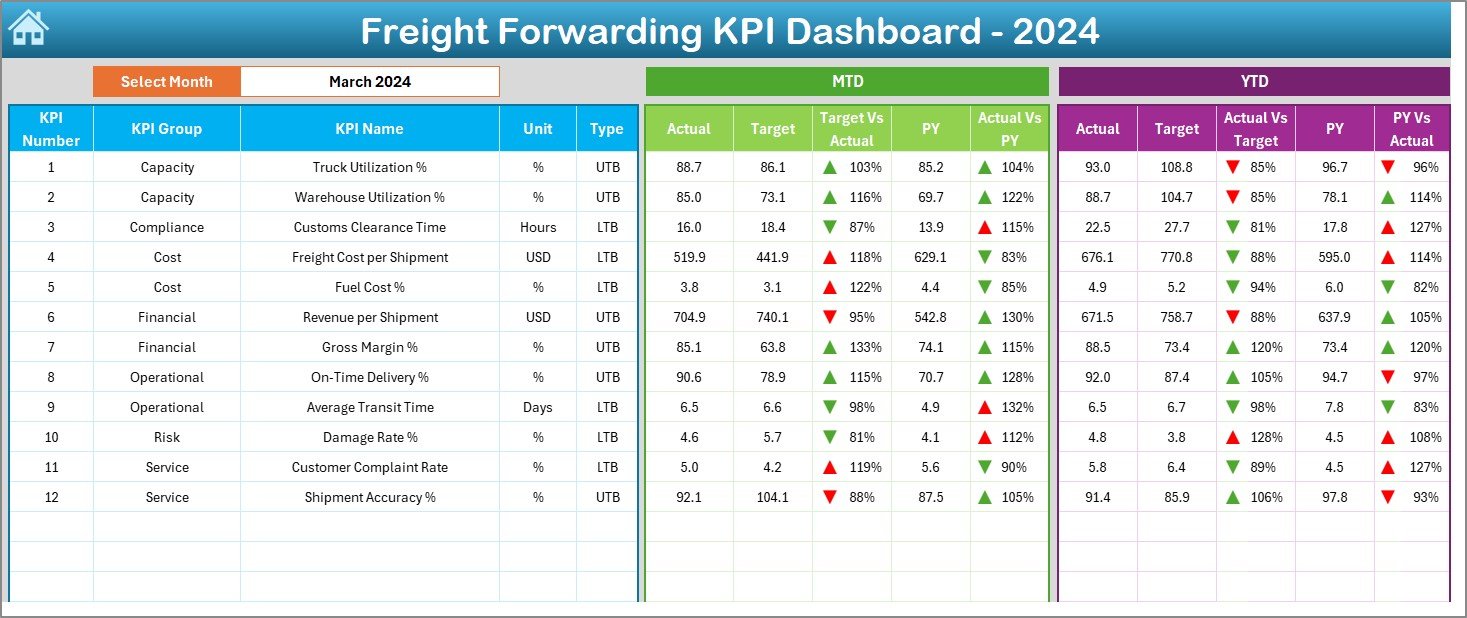
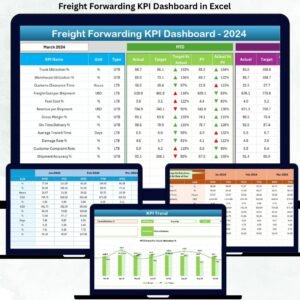
📊 2. Dashboard Sheet – Main Performance Overview
Month selector (Cell D3)
Dynamic KPI performance view
MTD Metrics Displayed:
Actual MTD
Target MTD
Previous Year MTD
Target vs Actual %
PY vs Actual %
▲ / ▼ performance indicators
YTD Metrics Displayed:
Actual YTD
Target YTD
Previous Year YTD
Target vs Actual %
PY vs Actual %
▲ / ▼ indicators
Color-coded arrows help users understand performance instantly.
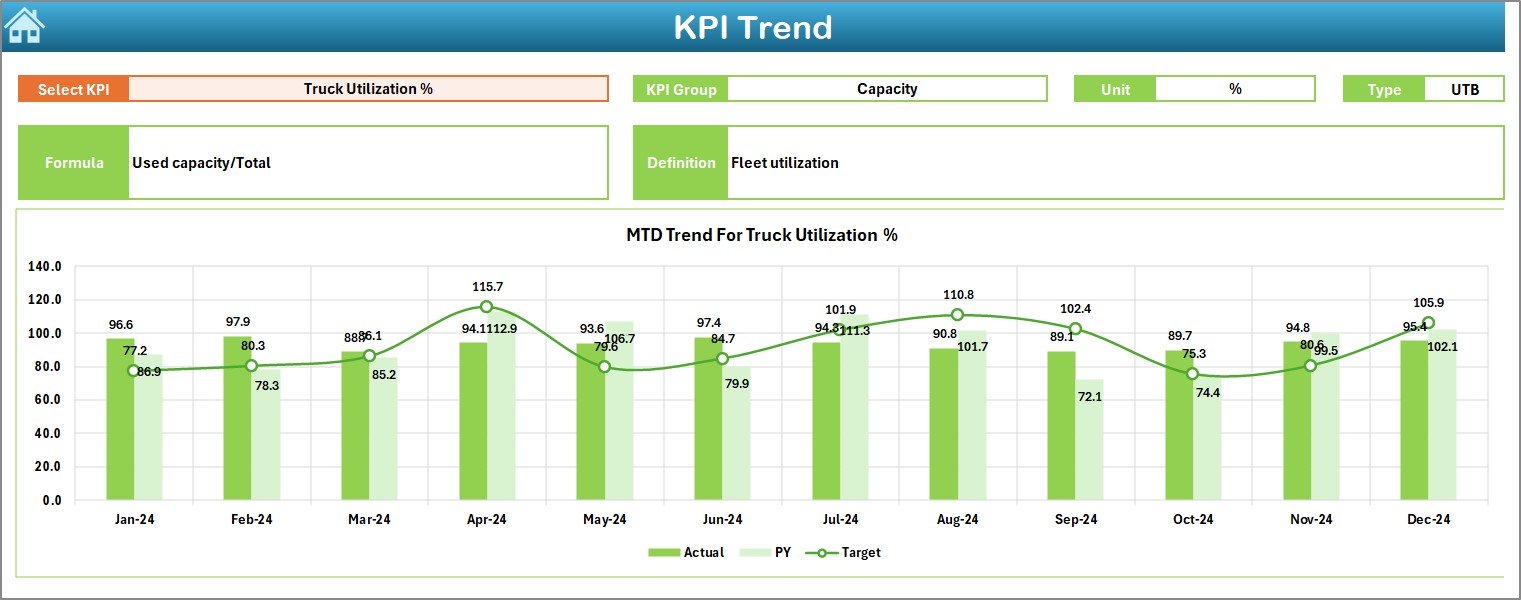
📈 3. KPI Trend Sheet – Performance Over Time
KPI selector (Cell C3)
KPI Group, Unit, Type, Formula, Definition
MTD Trend Chart (Actual, Target, PY)
YTD Trend Chart (Actual, Target, PY)
This sheet helps identify patterns, delays, and operational risks early.
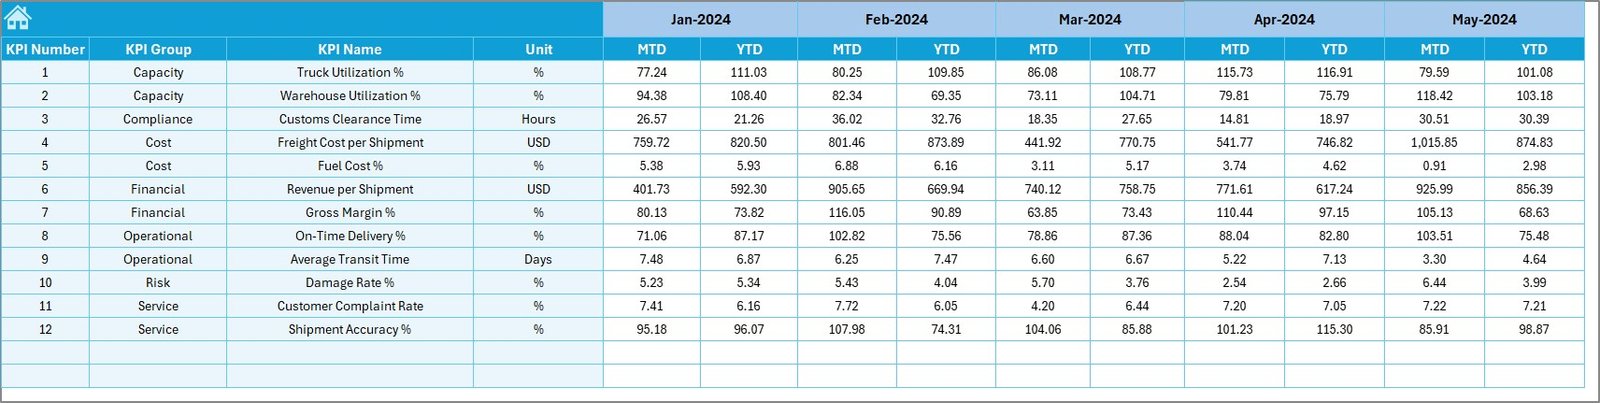
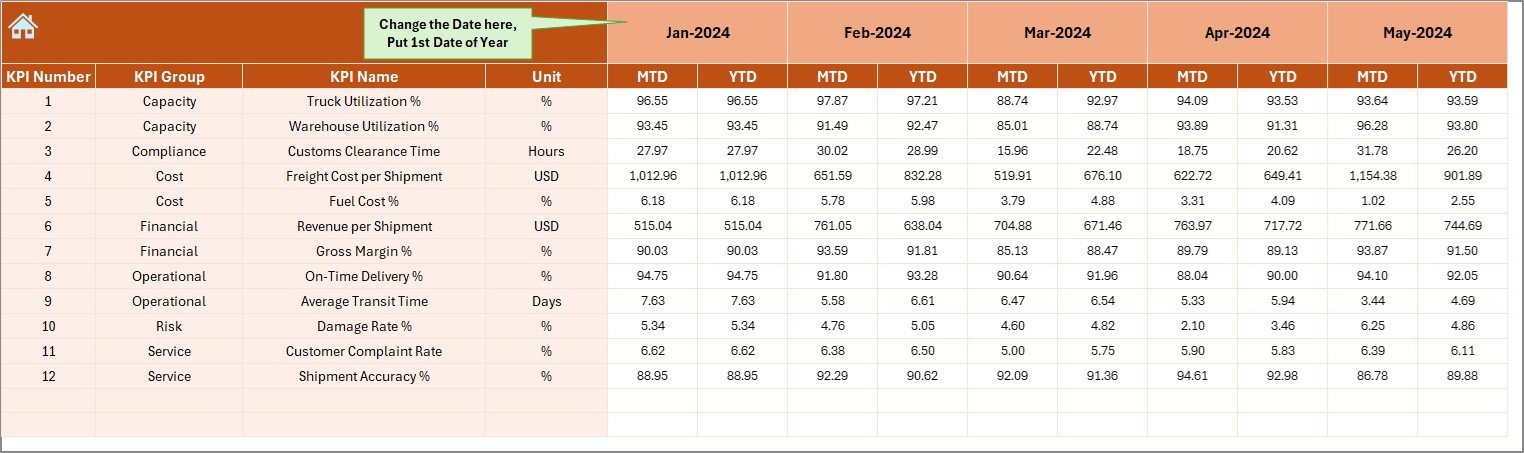
✍️ 4. Actual Numbers Input Sheet
Enter real operational performance
MTD and YTD actual values
Month control (Cell E1)
🎯 5. Target Sheet
KPI-wise MTD targets
KPI-wise YTD targets
Flexible monthly planning
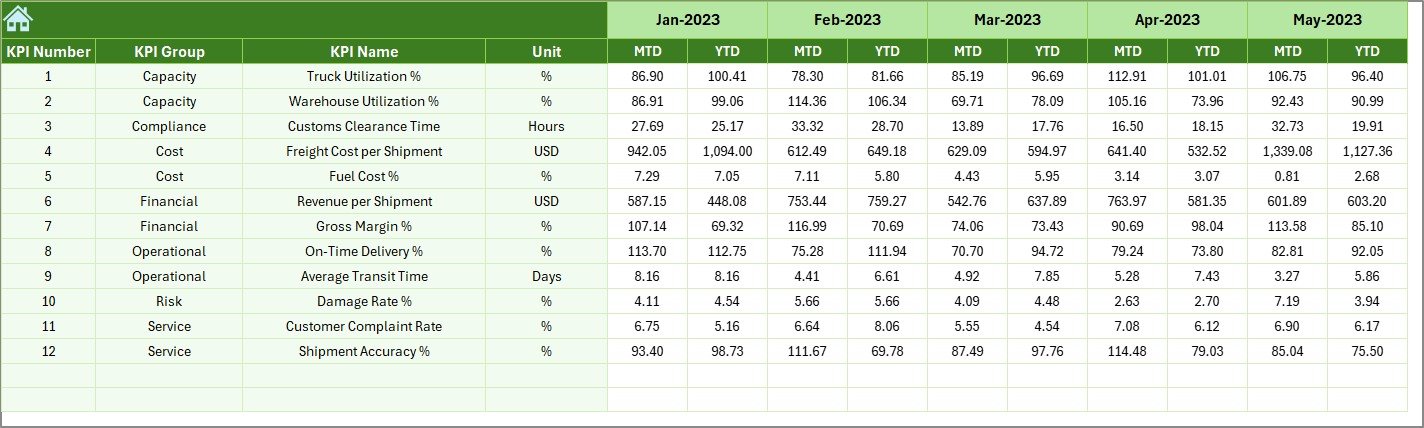
🔁 6. Previous Year Number Sheet
Last year MTD values
Last year YTD values
Supports YoY analysis
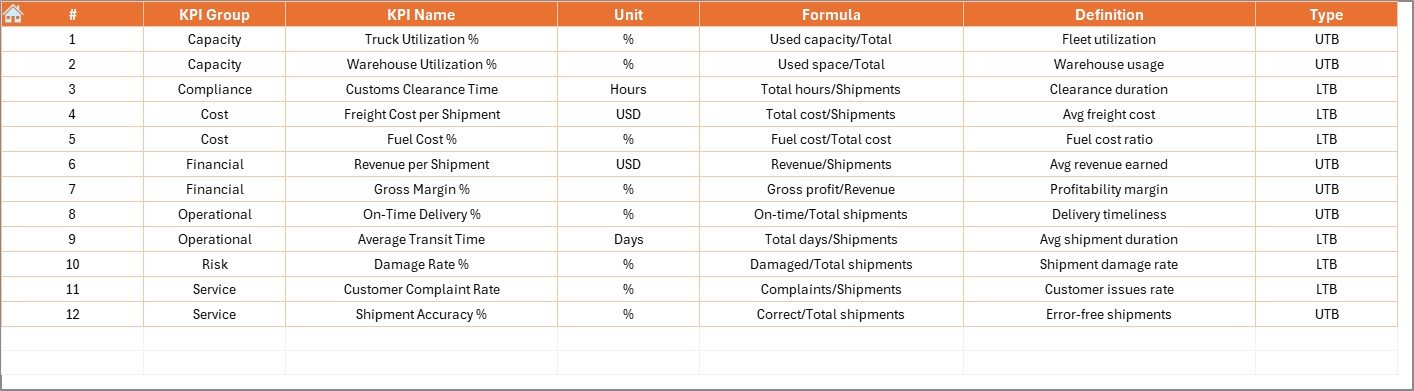
📘 7. KPI Definition Sheet
KPI Name
KPI Group
Unit
Formula
Definition
Ensures standardized KPI understanding across teams.
👥 Who Can Use This Dashboard?
✔ Freight Forwarding Companies
✔ Logistics & Operations Managers
✔ Supply Chain Teams
✔ Finance & Cost Control Teams
✔ Business Owners
✔ Logistics Analysts
Suitable for small forwarders and large logistics firms alike.
🌟 Advantages of Freight Forwarding KPI Dashboard in Excel
✔ Centralized logistics performance tracking
✔ Faster decision-making
✔ Clear target visibility
✔ Trend-based insights
✔ Easy customization
✔ No additional software cost
✔ Management-ready reporting
Conclusion
The Freight Forwarding KPI Dashboard in Excel turns complex logistics data into clear operational intelligence. With structured sheets, automated calculations, and visual performance indicators, it gives freight forwarders visibility, control, and confidence in their operations.
If you want to reduce delays, control costs, and improve service levels, this dashboard becomes an essential logistics management tool.
























Reviews
There are no reviews yet.