
Supply Chain and Logistics Financial Health KPI Dashboard in Excel

MS Excel - instant download

Original price was: $19.99.Current price is: $12.99.
Details, requirements and demo below
Sale!

Supply Chain and Logistics Financial Health KPI Dashboard in Excel

Original price was: $19.99.Current price is: $12.99.

💰 Track supply chain costs & KPIs with this Excel dashboard! Visual charts, goal comparisons, & trend analysis—all without complex software.

✨ Key Features Include:

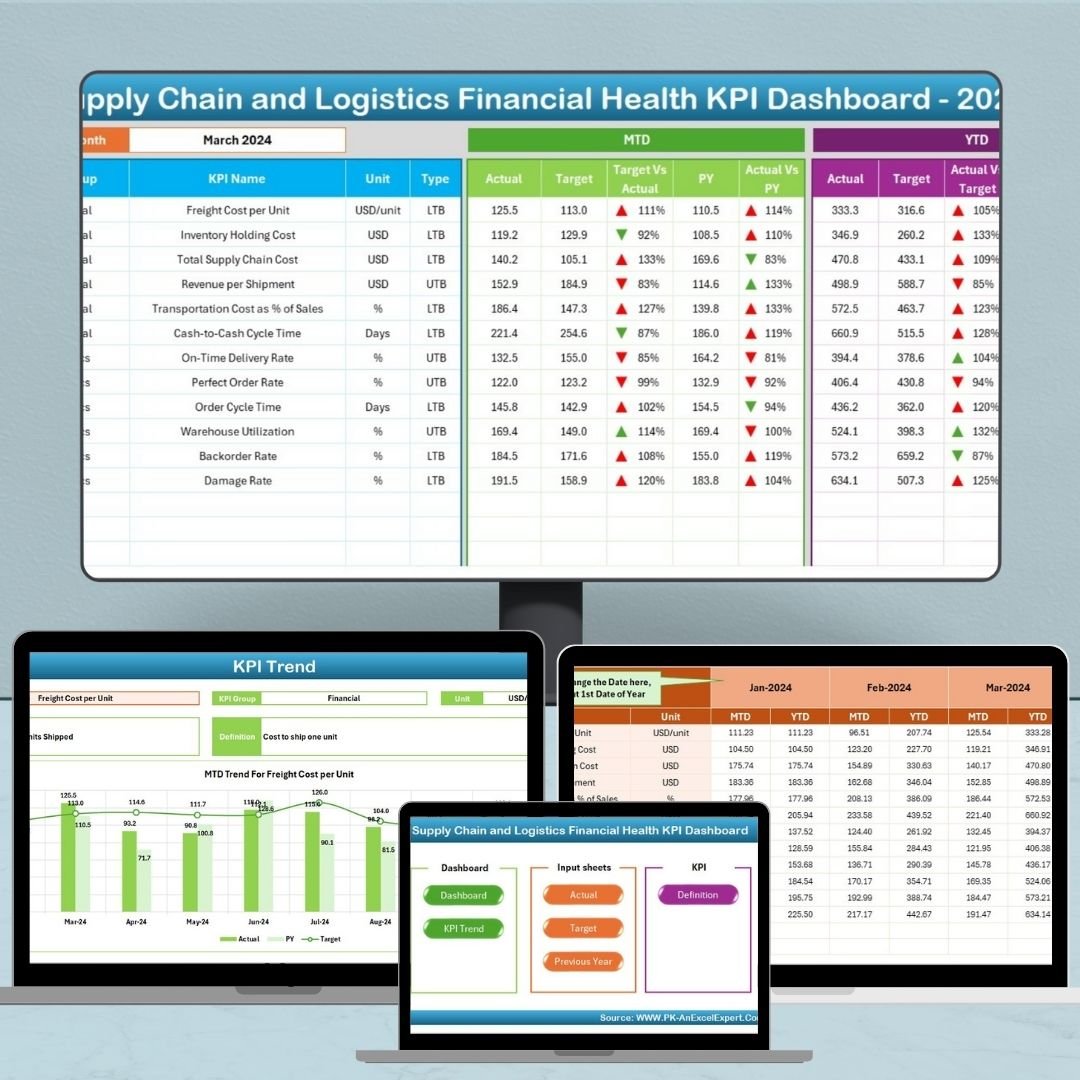
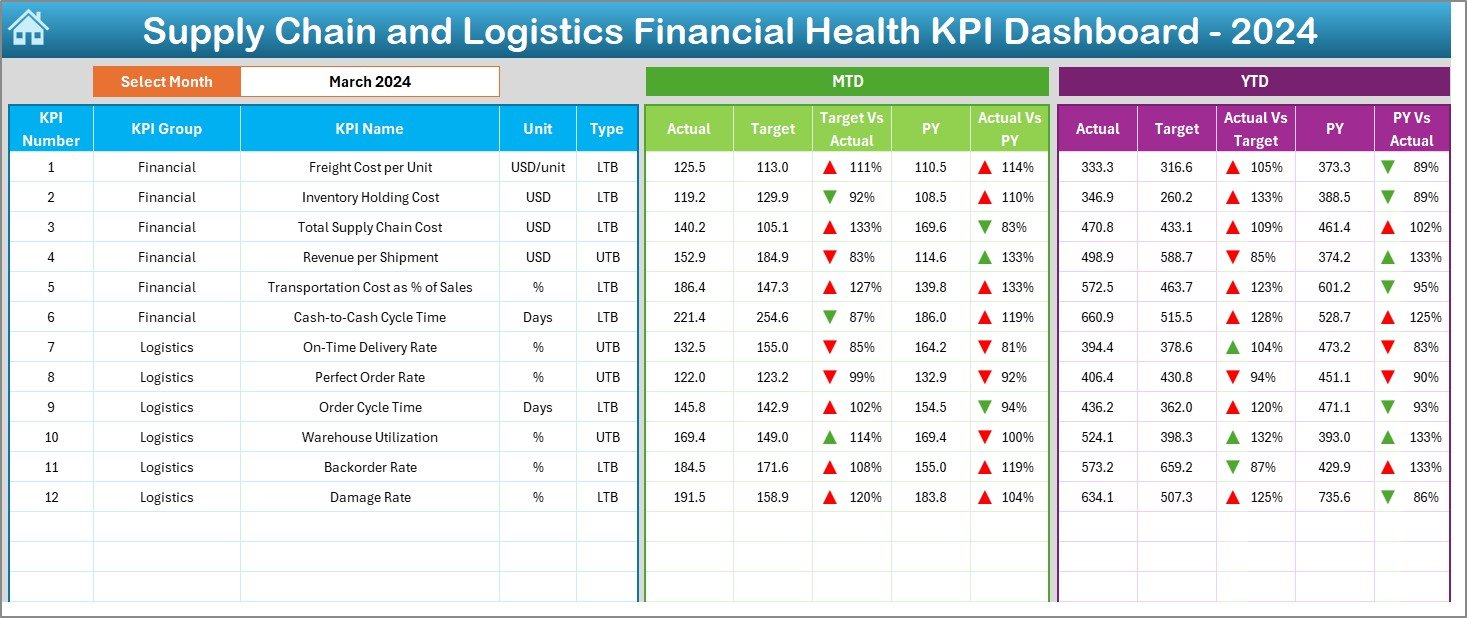
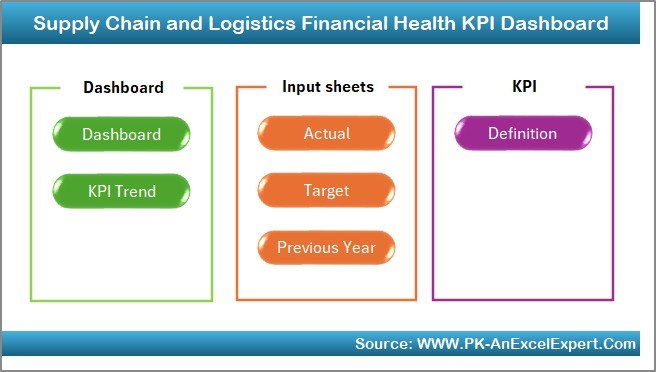
✅ 📊 Dashboard Sheet – Real-time MTD/YTD actuals vs. target/PY
✅ 📈 KPI Trends – Visual charts for each metric
✅ 🧾 Easy Data Entry – Actuals, targets & PY in one click
✅ 📘 KPI Definitions – Transparent formula logic
✅ 🧠 Excel-Ready – Works with basic Excel knowledge
✅ 📎 Visual Alerts – Red/Green arrows for quick performance tracking
✅ 🧩 Customizable – Add new KPIs, units & visuals
✅ 📁 One-File Control Center – No external software needed
✅ 📈 Real Use Case Ready – Proven to reduce costs & increase clarity
✅ 🛠 Designed for SMEs, Logistics Teams, E-Com & Retail

Customize this template for your business (optional)

Handled by email: we contact you within 1 business day. One revision round included. What is included

- +
Have your own data? Build a dashboard from your Excel, CSV or Google Sheets file free in Dashboard Studio →

💡 Buy any 2 templates and save 20% automatically at checkout.

Included in All-Access Templates. Get this plus 7,000+ templates for $99.00 a year. Compare plans →
Pricing country
Prices follow your selected country; checkout uses your billing country.
Excel Pivot Tables & Dashboards: Basic to Advanced courseLaunch offer
🎓 NEXTGENTEMPLATES ACADEMY
Like this dashboard? Learn to build your own.
Excel Pivot Tables & Dashboards: Basic to Advanced

From your first Pivot Table to the Data Model, DAX, Power Query and a one-page KPI dashboard. 11h 51m of video by PK, with practice files, quizzes and a capstone.

Managing supply chain and logistics without financial visibility is like navigating without a map. That’s why the Supply Chain and Logistics Financial Health KPI Dashboard in Excel is your ultimate solution for real-time monitoring, smart cost tracking, and goal alignment. Whether you’re managing transportation costs, warehouse operations, or logistics efficiency, this interactive Excel dashboard puts every key financial KPI at your fingertips—no expensive software required.

Built with slicers, trend visuals, and conditional formatting, it helps you track MTD and YTD performance, compare actuals vs. targets and previous year data, and make data-driven decisions with confidence.


✨ Key Features of the Dashboard

📋 Dynamic Dashboard Sheet
Supply Chain and Logistics Financial Health KPI Dashboard
  • Month selector with instant filtering

  • Visuals for Actual vs. Target vs. PY

  • Up/down arrows indicate KPI progress

  • Real-time updates for MTD and YTD values

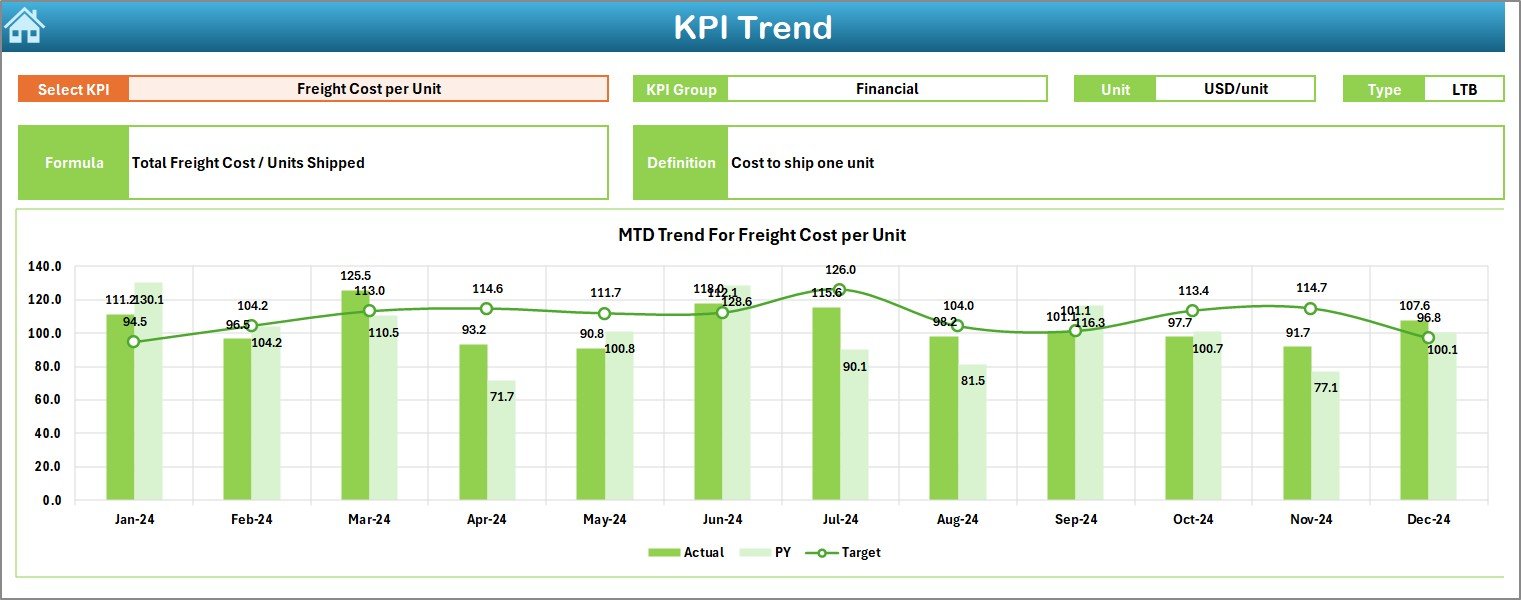
📈 KPI Trend Analysis Sheet

  • Select any KPI to view trend charts

  • Displays KPI group, unit, UTB/LTB status, formula & definition

  • Track improvements or drops across months

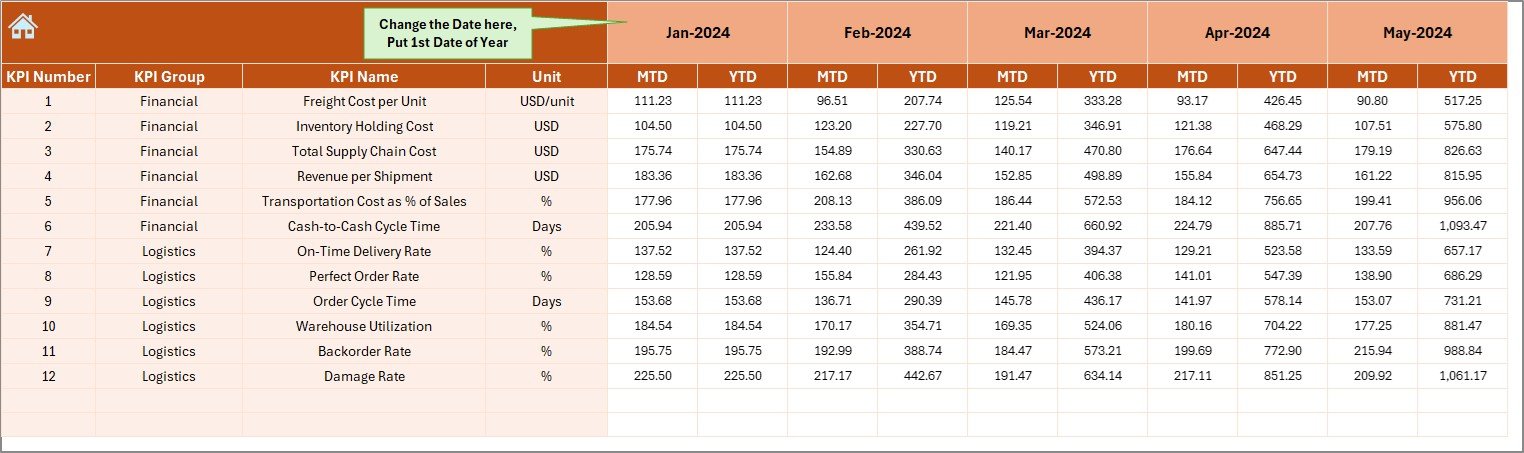
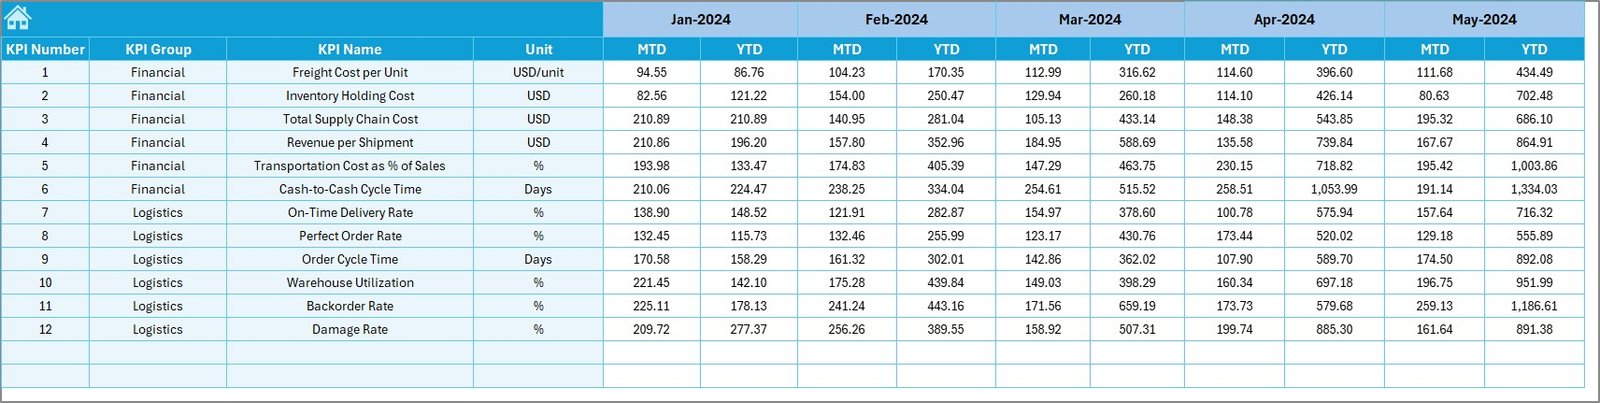
🧾 Structured Data Input Sheets

  • Actual Numbers Input – Enter monthly MTD/YTD actuals

  • Target Sheet – Set monthly targets for each KPI

  • Previous Year Sheet – Maintain historical benchmarks

  • Flexible start month setup

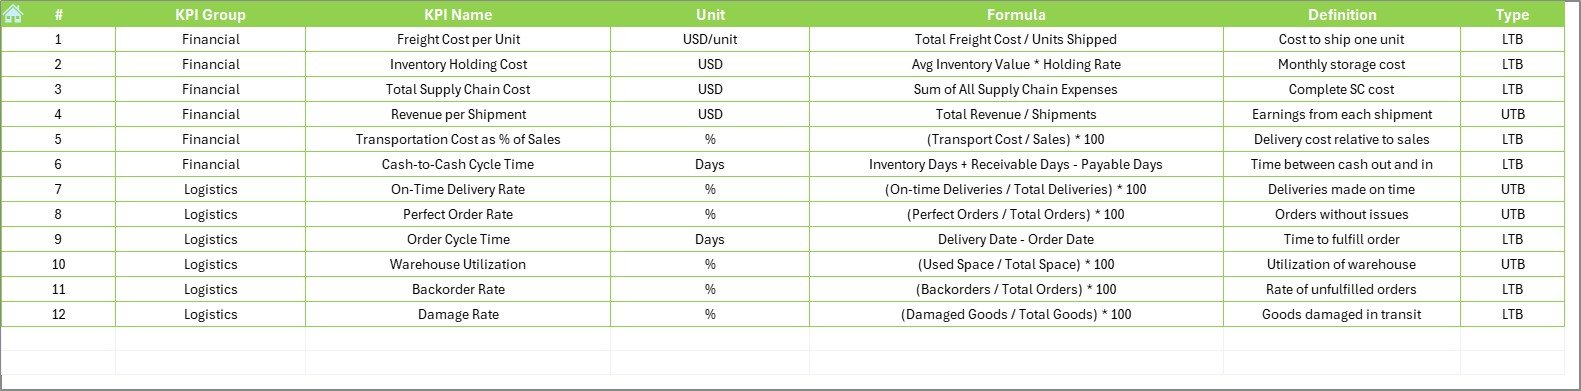
📚 KPI Definition Sheet

  • Define all metrics with unit, formula, group, and performance type

  • A perfect reference point for teams

🏠 Home Sheet with Quick Navigation

  • Jump to any worksheet with a single click

  • Clean interface for easy access


📂 What’s Inside the Dashboard Package?

✔️ 7 Organized Excel Sheets
✔️ Built-in KPI Trend Charts
✔️ Conditional Formatting Icons
✔️ Target vs. Actual vs. Previous Year Comparison
✔️ Month Slicer and KPI Dropdowns
✔️ Sample KPIs and Definitions for Immediate Use


👥 Who Should Use This Dashboard?

🚚 Logistics Managers – Track freight, delivery, and warehouse costs
🏬 Retail Supply Chain Leads – Improve inventory turnover and reduce holding costs
📦 E-commerce Operations Teams – Manage order accuracy, shipping costs, and return handling
📈 Finance Teams – Align logistics with budget and cost-saving targets
🛒 Wholesalers & Distributors – Monitor region-wise transportation spend and warehouse utilization


💡 Most Popular KPIs You Can Track

📦 Freight Cost per Unit
📦 Inventory Holding Cost
📦 Delivery Cost per Order
📦 Logistics Cost as % of Sales
📦 Warehouse Utilization Rate
📦 Return Processing Cost
📦 On-Time Shipment Rate
📦 Order Accuracy Rate
📦 Transportation Spend by Region
📦 Cost per Shipment

Set each KPI as UTB (Upper the Better) or LTB (Lower the Better) based on your business strategy.


🔗 Click here to read the Detailed blog post

📺 Visit our YouTube channel to learn step-by-step video tutorials


Watch the step-by-step video tutorial:

Compatibility and Requirements

  • Works in Microsoft Excel desktop (Excel 2016 or later, or Microsoft 365).
  • The dashboard uses a month slicer and KPI drop-down lists. Microsoft explains slicers in Use slicers to filter data.

How to Use the Supply Chain and Logistics Financial Health KPI Dashboard

  1. Open the Home sheet and use the buttons to move between sheets.
  2. Check the KPI Definition sheet and set each KPI as UTB or LTB.
  3. Enter monthly targets in the Target sheet and last year’s figures in the Previous Year sheet.
  4. Enter monthly MTD and YTD actuals in the Actual Numbers Input sheet.
  5. Pick a month on the Dashboard sheet to see Actual vs Target vs PY with up and down arrows.
  6. Select a KPI on the KPI Trend sheet to see how it moved across the months.

Frequently Asked Questions

How many sheets are included?

There are seven: Home, Dashboard, KPI Trend, Actual Numbers Input, Target, Previous Year and KPI Definition.

Which KPIs can I track?

Sample KPIs include freight cost per unit, inventory holding cost, delivery cost per order, logistics cost as % of sales, warehouse utilization rate and cost per shipment.

What do UTB and LTB mean?

UTB means upper the better and LTB means lower the better. You set one for each KPI so the arrows show progress the right way.

Can I start the year in any month?

Yes. The input sheets have a flexible start month setup.

Related Logistics Cost Templates

Browse all Excel KPI dashboards or the Excel logistics templates.

Frequently asked questions

Which Excel version do I need?
Microsoft Excel 2016 or later on desktop (Microsoft 365 recommended). Many of our formula templates also open in Excel 2013 and Excel for the web - the exact requirement is listed in this product's description.
Does it work on Mac?
Yes. Formula-based Excel templates (no macros) work in Excel for Mac 2016 or later.
Does it work on mobile or Excel Online?
You can view it in the Excel mobile app and Excel for the web, but for entering data, using slicers and refreshing pivots we recommend desktop Excel.
How do I add my own data?
Replace the sample rows on the data sheet with your own (keep the column headers), then click Data > Refresh All so every chart and pivot updates.
Some sheets are protected - how do I edit them or change the logo?
A few of our trackers, data entry systems and dashboards protect sheets so formulas are not overwritten by mistake. Go to Review > Unprotect Sheet - most have no password. If Excel asks for one, message us with your order number and we will share it straight away.
How many records can it handle?
It has been tested with several thousand rows and suits normal small-business volumes. Excel itself handles over 1 million rows.
Is it a one-time payment or a subscription?
One-time payment. No subscription, no per-user fees and nothing to renew - the file is yours to keep.
How do I get the file after payment?
Instantly. The download link appears on screen after checkout, is emailed to you, and stays under My Account > Downloads on our website. If the email does not arrive within a few minutes, check your spam or promotions folder.
Is a user manual included?
Most of our newer products include a PDF user manual in the download. If yours does not have one, message us with your order number and we will send it.
Do I get free updates?
Bug fixes are always free - if something does not work as described, we fix it and send you the corrected file. New versions with new features are not included in the price, unless this product's description says otherwise.
Can you customise it for me?
Yes. Small changes to this template (your columns, categories, logo, colours, minor layout) cost the template price plus $40-80 (Rs 3,000-6,000 + GST), quoted once you send your list. A fully custom build is usually $100-200 (Rs 8,000-18,000 + GST) with two revision rounds. Email your requirements to [email protected] or message us on WhatsApp.
Can I use it for my business or my clients?
Yes, for your own personal or internal business use, for as long as you like. Reselling or redistributing the template is not allowed.
What is your refund policy?
Because these are digital downloads, they are non-refundable once delivered - except when the product does not match its description (report it within 48 hours of purchase) or there is a technical problem our team cannot fix within 72 hours. Email [email protected] with your order number.
How do I get help?
Email [email protected] (Mon-Fri, 10 AM-7 PM IST) or message us on WhatsApp +91 80770 90260 (chat only, no calls). Please include your order number.

Still have a question? Click Need help? at the bottom-left to ask our assistant, or message us on WhatsApp.

Application

MS Excel

Template Type

KPI Dashboard

Price

Paid

Business or Department

Supply Chain and Procurement

Reviews

There are no reviews yet.

Only logged in customers who have purchased this product may leave a review.

You may also like…

Supply Chain and Logistics Financial Health KPI Dashboard in ExcelSupply Chain and Logistics Financial Health KPI Dashboard in Excel
Original price was: $19.99.Current price is: $12.99.
- +
Have your own data? Build a dashboard from your Excel, CSV or Google Sheets file free in Dashboard Studio →
Scroll to Top