Podcasting has rapidly evolved into a multi-billion-dollar digital ecosystem. Podcast Platforms Dashboard in Excel However, managing podcast platforms without structured performance visibility often results in rising costs, unclear revenue streams, underperforming hosts, and hidden profitability issues. Even though data exists, it usually stays scattered across multiple Excel files and manual reports—making insights hard to find and decisions slow.
That is exactly why the Podcast Platforms Dashboard in Excel becomes a powerful, practical, and business-ready analytics solution.
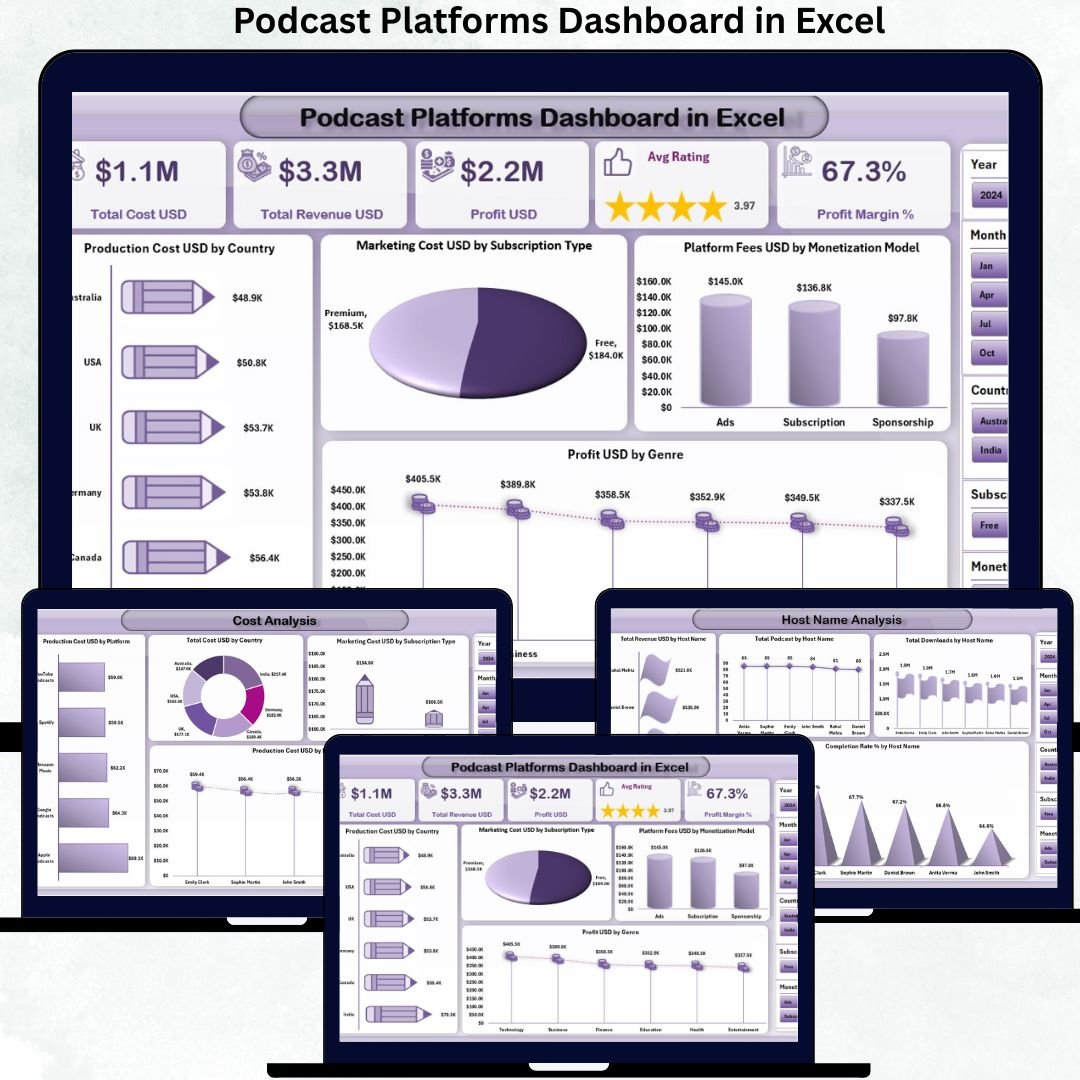
Podcast Platforms Dashboard in Excel This ready-to-use Excel dashboard converts raw podcast data into clear KPIs, insightful charts, and actionable performance views. From tracking total cost and revenue to analyzing host performance, platform efficiency, and monthly trends, this dashboard gives you complete control over your podcast business—all inside Excel.
Built for podcast networks, media companies, and content studios, this dashboard removes guesswork and replaces it with data-driven clarity.
✅ Key Features of Podcast Platforms Dashboard in Excel
📊 Complete Financial Visibility
Track Total Cost, Total Revenue, Profit, Profit Margin %, and Average Rating in one centralized dashboard.
🎧 Platform-Level Performance Analysis
Compare subscription revenue, platform fees, marketing costs, and podcast volume across multiple podcast platforms.
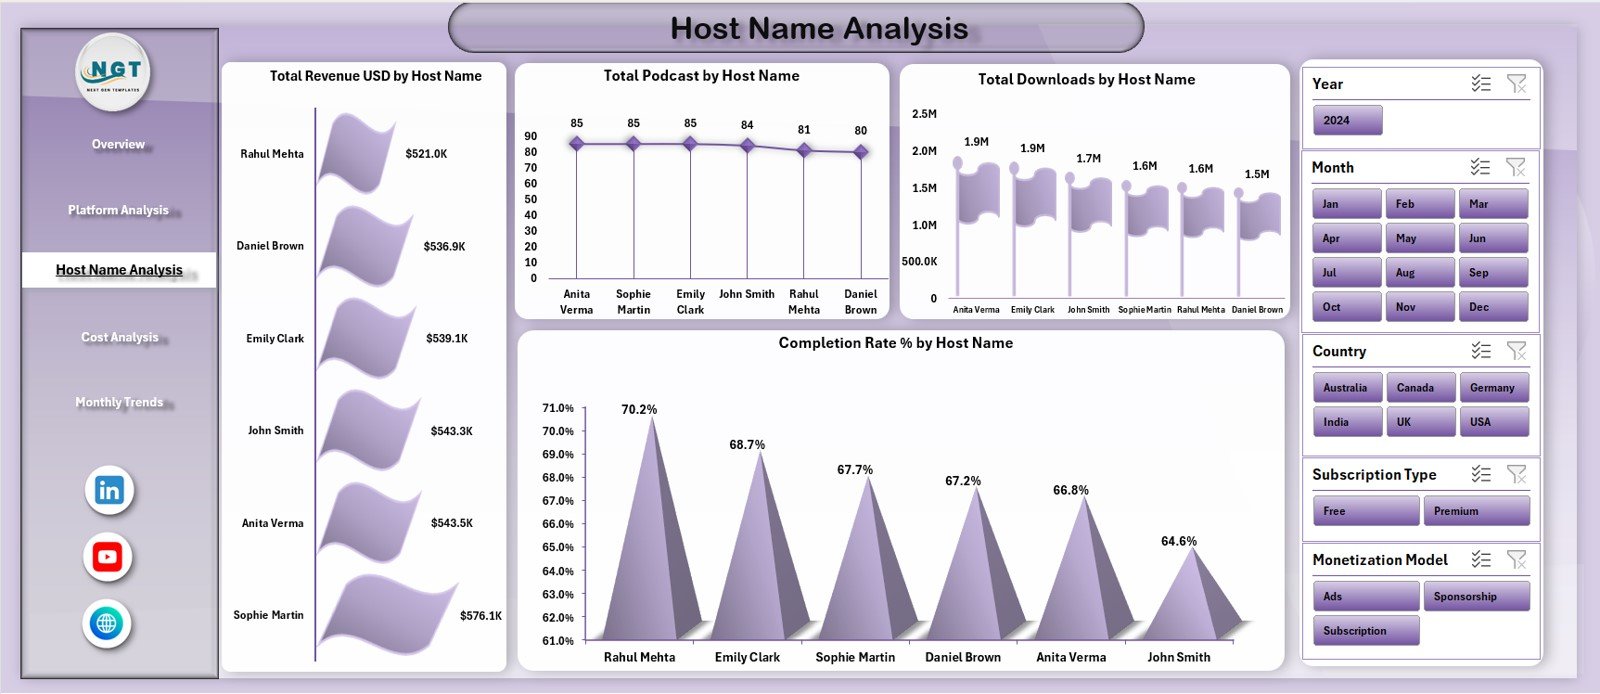
🎤 Host Performance Insights
Identify high-earning hosts, top download drivers, strong completion rates, and content engagement patterns.
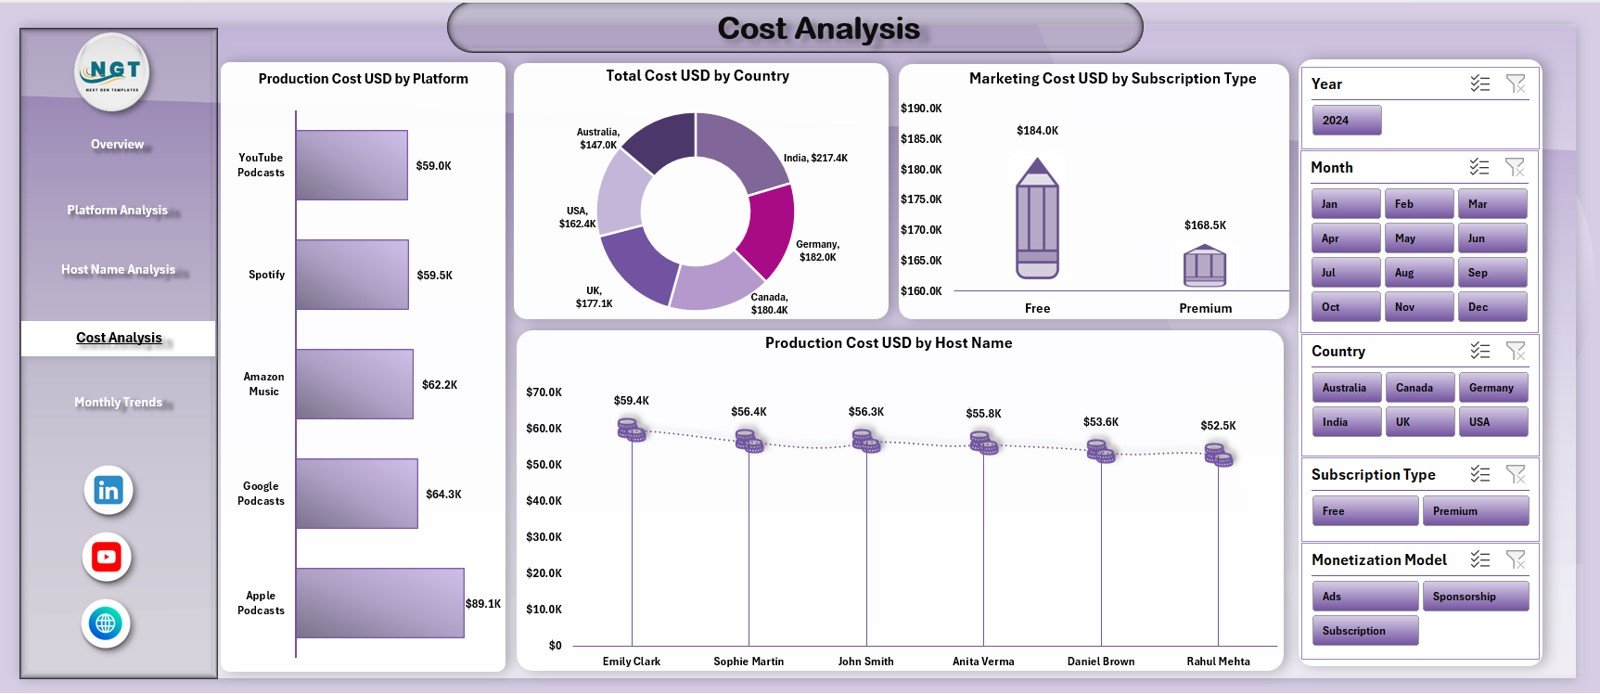
💰 Detailed Cost Breakdown
Analyze production cost, marketing cost, and platform fees by country, subscription type, and host.
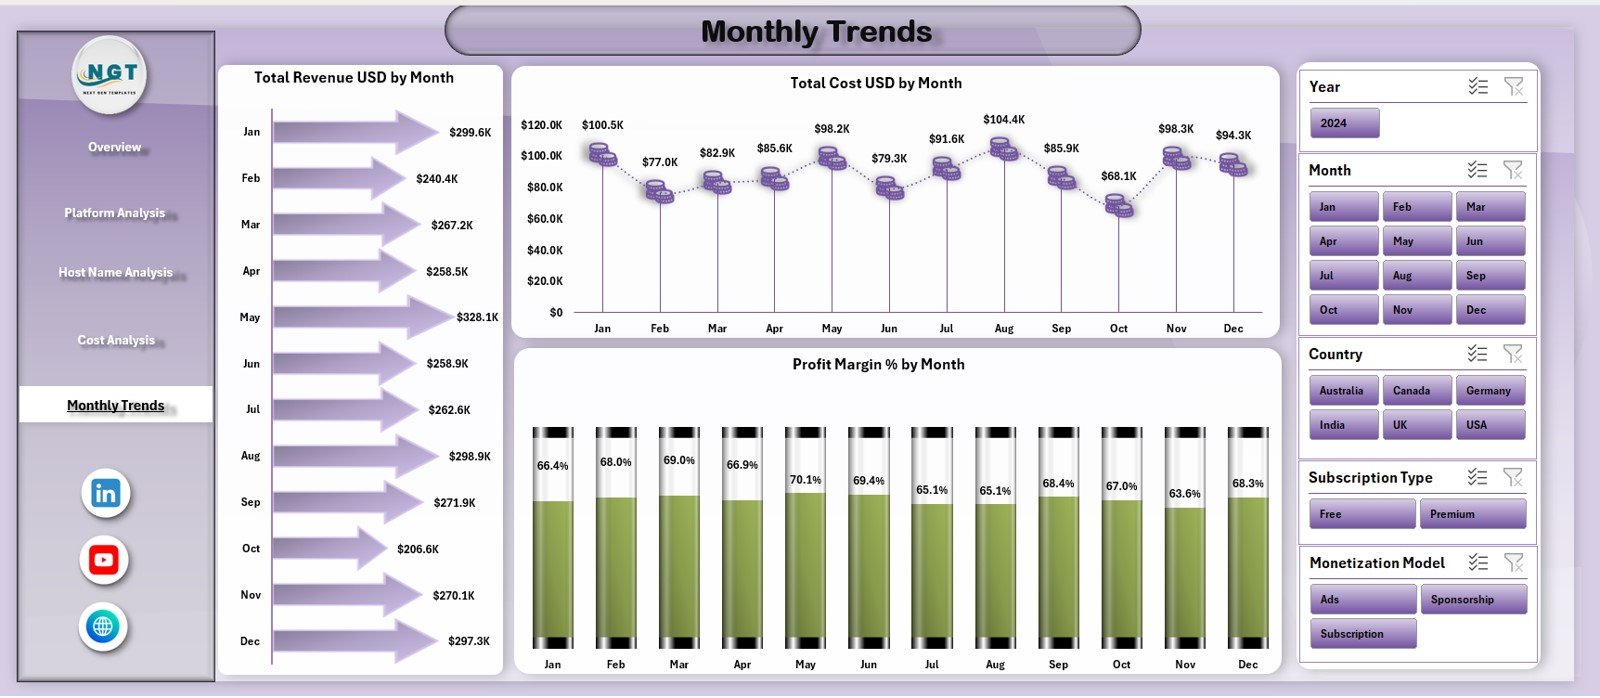
📈 Monthly Trend Tracking
Monitor revenue growth, cost movement, and profit margin trends month by month.
🧭 Easy Page Navigation
Left-side Page Navigator allows one-click movement between dashboard pages.
⚙️ 100% Excel-Based & Customizable
No Power BI, no coding—just Excel formulas, tables, and charts that are easy to update and modify.
📦 What’s Inside the Podcast Platforms Dashboard in Excel
📊 Overview Page
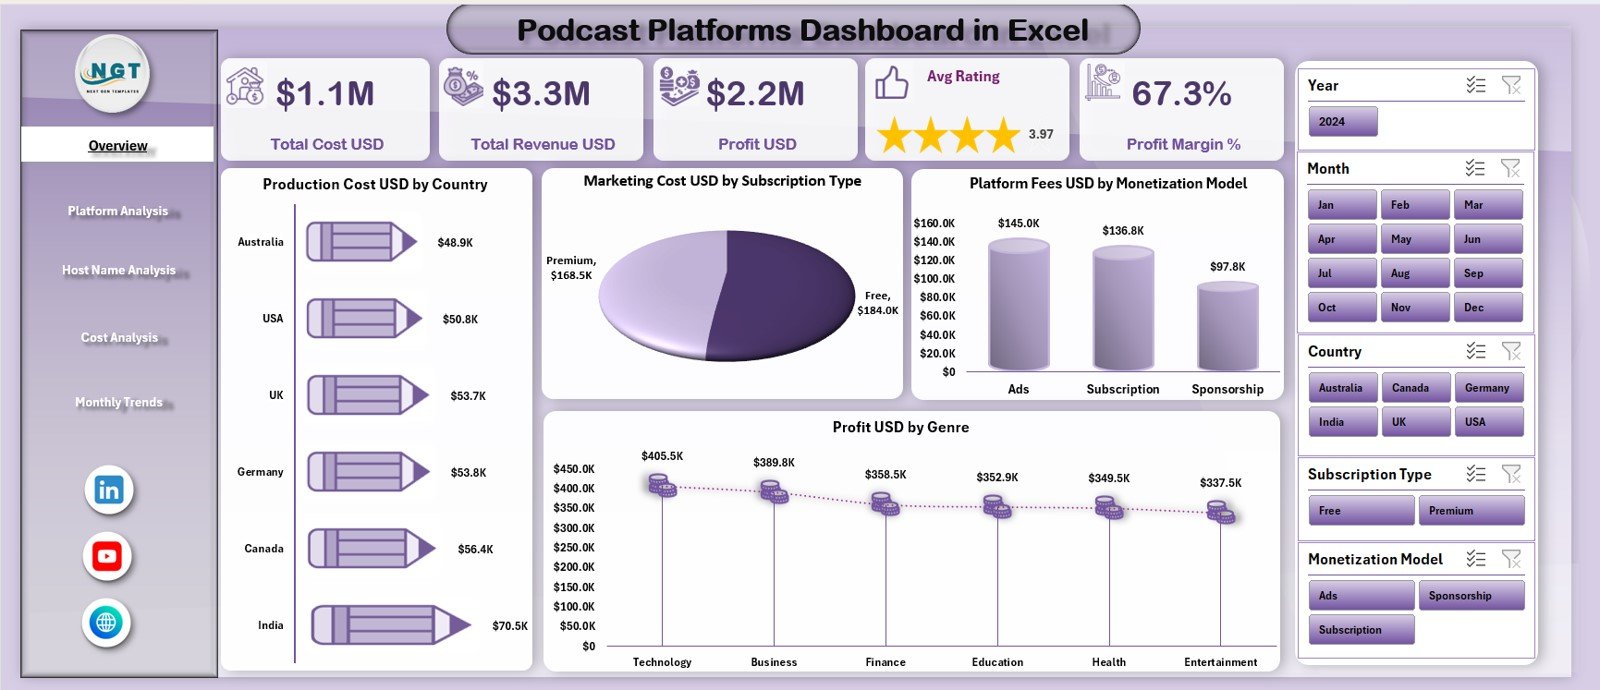
A complete snapshot of podcast business health with KPI cards and financial distribution charts across countries, genres, and monetization models.
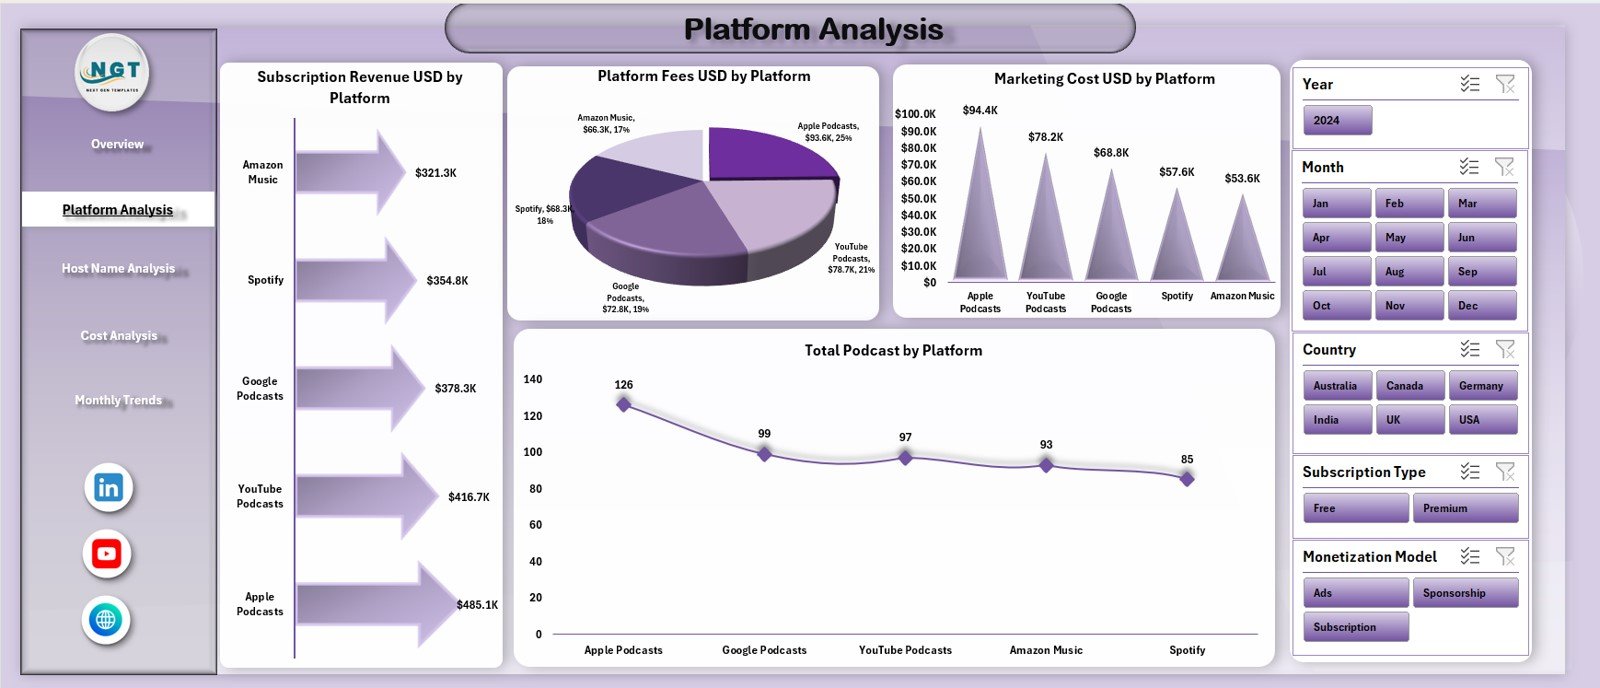
🧩 Platform Analysis Page
Shows subscription revenue, platform fees, marketing cost, and total podcasts by platform.
🎙️ Host Name Analysis Page
Compares revenue, total podcasts, downloads, and completion rates for each host.
💸 Cost Analysis Page
Breaks down production and marketing costs by platform, country, subscription type, and host.
📅 Monthly Trends Page
Tracks Total Revenue, Total Cost, and Profit Margin % over time for forecasting and planning.
🗂️ Support & Data Sheets
Clean, structured backend sheets ensure smooth updates and accurate insights.
🛠️ How to Use the Podcast Platforms Dashboard in Excel
1️⃣ Update podcast data in the structured data sheet
2️⃣ Refresh Pivot Tables and formulas
3️⃣ Use slicers and filters to explore insights
4️⃣ Review KPI cards for financial health
5️⃣ Analyze platforms, hosts, and costs in detail
6️⃣ Track monthly trends for planning and growth
No advanced Excel knowledge required—this dashboard is built for business users.
🎯 Who Can Benefit from This Dashboard?
🎧 Podcast Platform Owners
🎙️ Podcast Network Managers
💼 Media & Content Companies
📊 Finance and Revenue Teams
📈 Strategy & Growth Teams
🎯 Content & Host Managers
Whether you manage 10 podcasts or 1,000, this dashboard scales with your growth.


Reviews
There are no reviews yet.