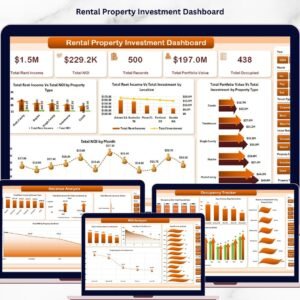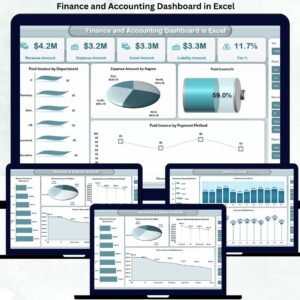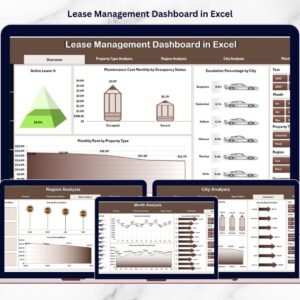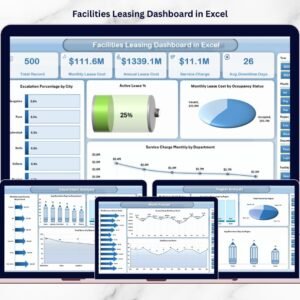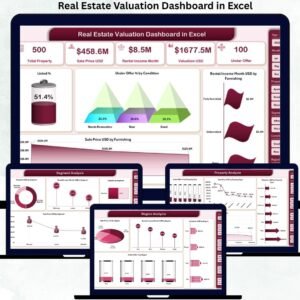
Real estate success depends on accurate valuation, pricing insight, and market timing. However, many real estate professionals still rely on manual Excel sheets, scattered property files, and static reports. As a result, identifying profitable opportunities, monitoring valuation trends, and making confident decisions becomes slow and error-prone.
That is exactly where the Real Estate Valuation Dashboard in Excel becomes a game-changer. 🚀
The Real Estate Valuation Dashboard in Excel is a ready-to-use, interactive analytics solution designed for real estate agents, brokers, investors, valuation analysts, and property managers. It transforms raw property data into clear KPIs, dynamic visuals, and actionable insights—all inside Excel.
Instead of spending hours preparing reports, this dashboard lets you analyze property valuation, sales price, rental income, listing status, and market trends in seconds. With built-in slicers, pivot charts, and automated calculations, you gain full control over real estate performance without coding or complex tools.
✅ Key Features of Real Estate Valuation Dashboard in Excel
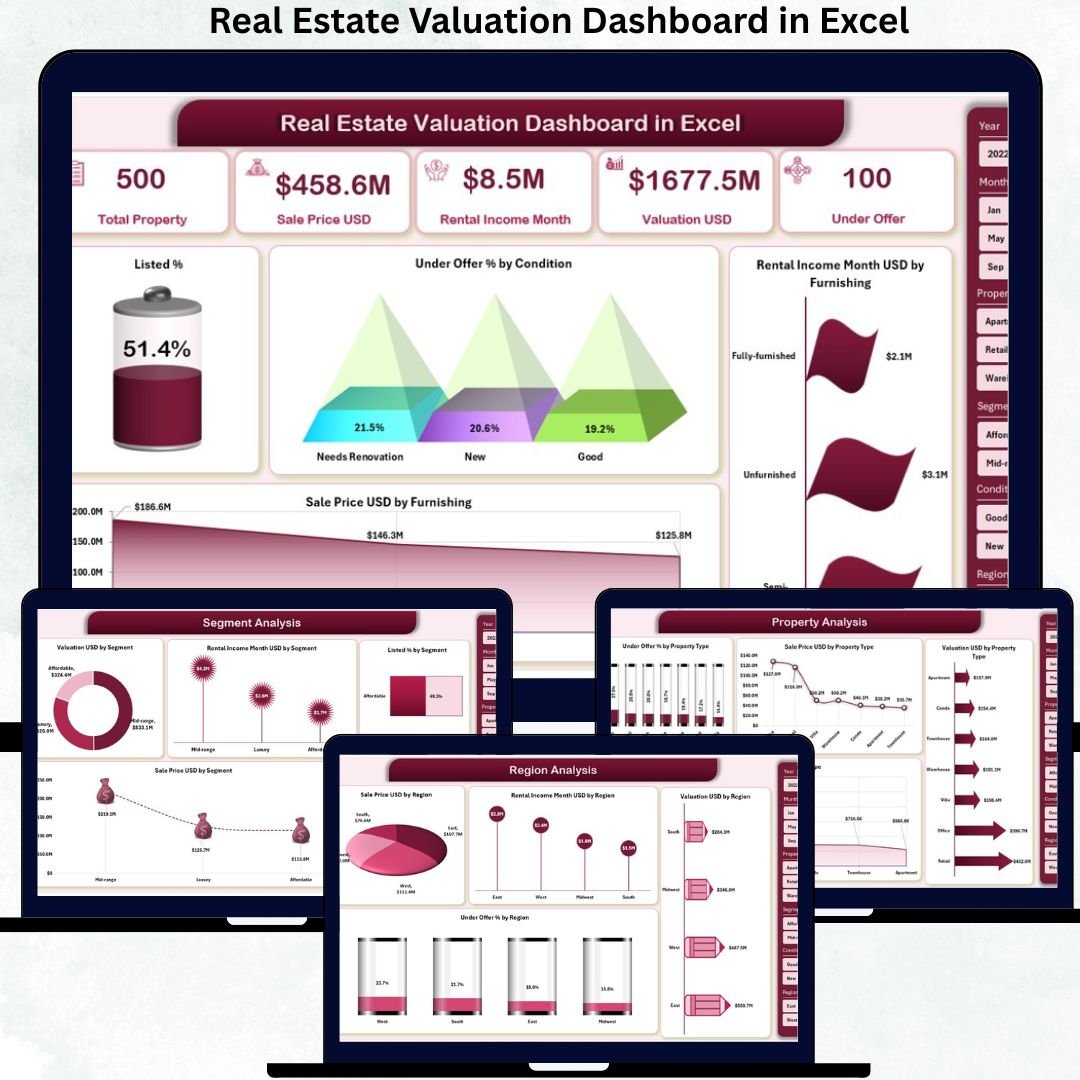
📊 Executive Overview Page – Track total properties, valuation, rental income, and listing status instantly.
🏠 Property Type Analysis – Compare apartments, villas, commercial units, and more.
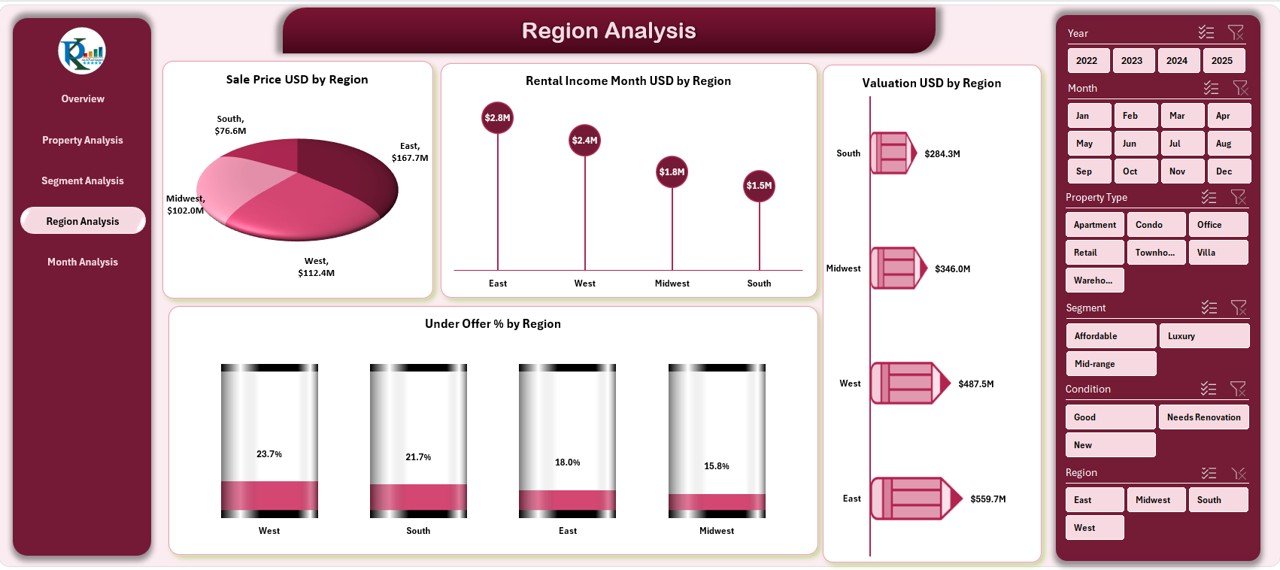
📍 Region-Wise Insights – Identify high-growth, high-value, and underperforming locations.
🎯 Segment Analysis – Understand premium vs budget market segments clearly.
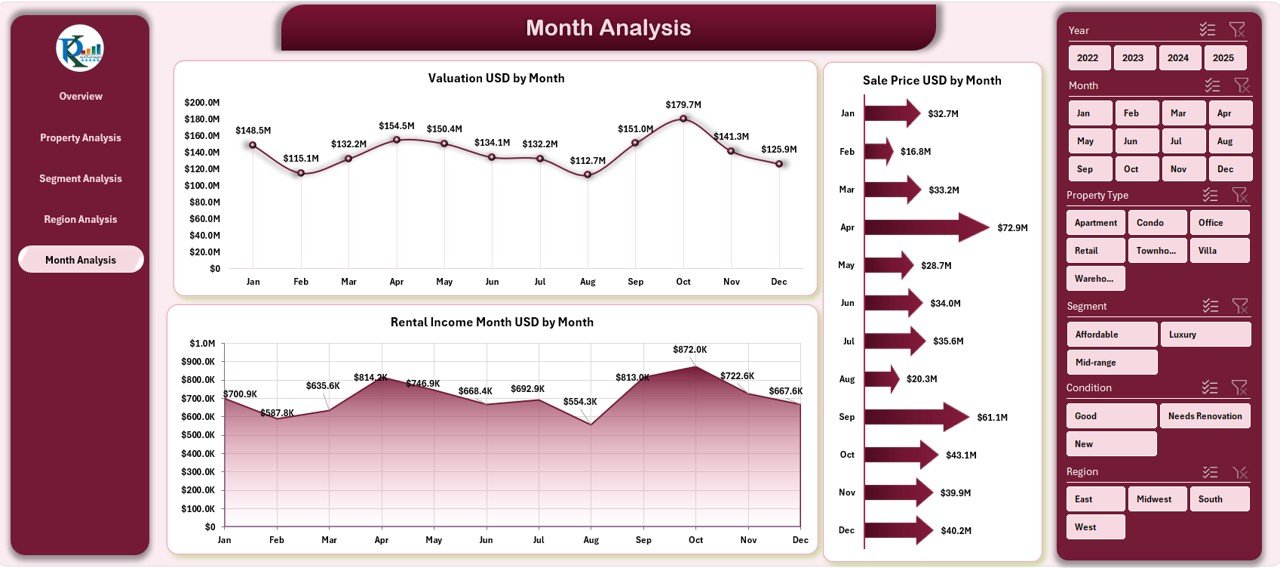
📈 Monthly Trend Tracking – Monitor pricing, valuation, and rental income changes over time.
🧭 Page Navigator – Smooth navigation across all analysis pages.
🎛️ Dynamic Slicers – Filter data by region, furnishing, condition, and time period instantly.
This dashboard turns Excel into a powerful real estate analytics engine.
📦 What’s Inside the Real Estate Valuation Dashboard in Excel
✅ Overview Page
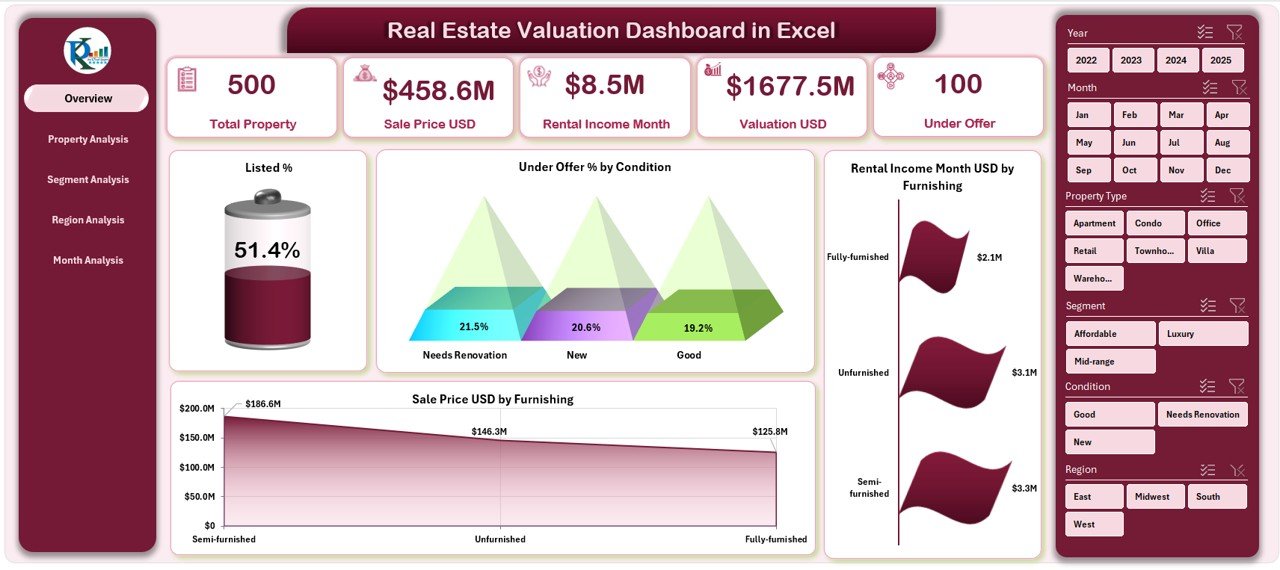
Total Properties
Listed %
Under Offer %
Total Valuation (USD)
Total Rental Income
Charts Included:
Listed % by Condition
Under Offer % by Condition
Rental Income per Month by Furnishing
Sales Price by Furnishing
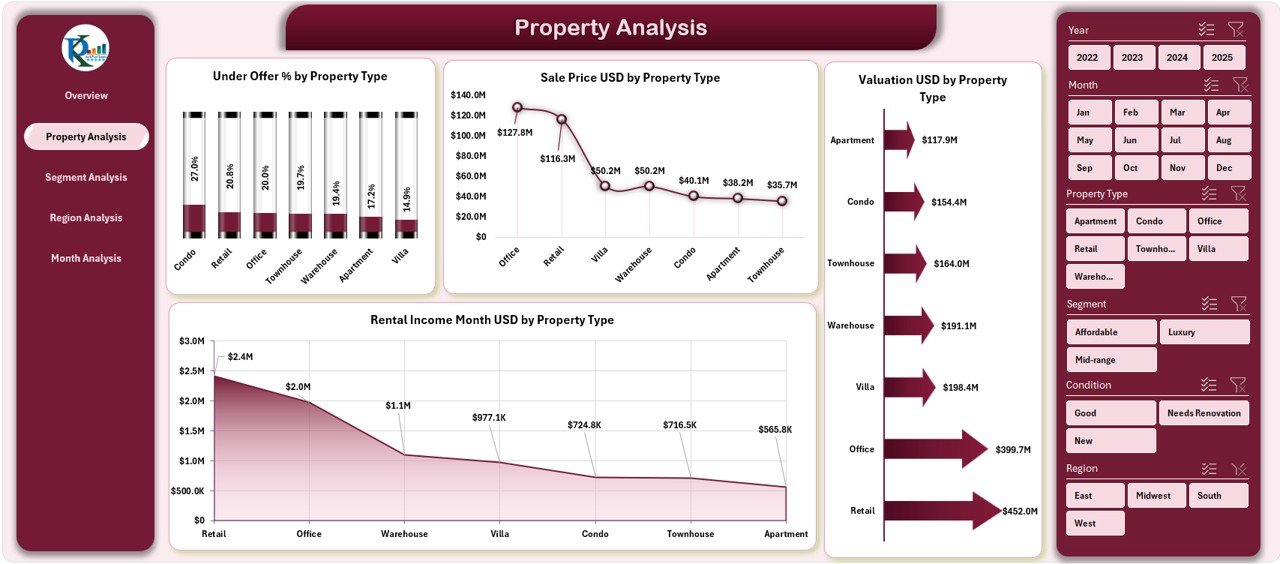
✅ Property Analysis Page
Valuation by Property Type
Sales Price by Property Type
Rental Income by Property Type
Under Offer % by Property Type
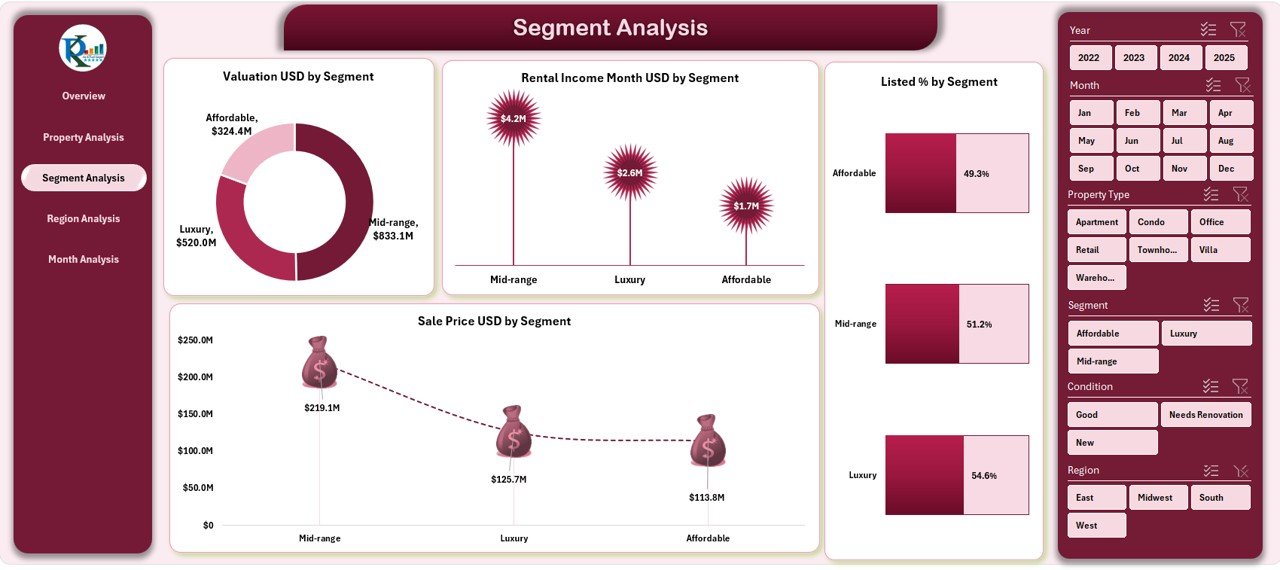
✅ Segment Analysis Page
Valuation by Segment
Rental Income by Segment
Sales Price by Segment
Listed % by Segment
✅ Region Analysis Page
Valuation by Region
Sales Price by Region
Rental Income by Region
Under Offer % by Region
✅ Month Analysis Page
Valuation by Month
Sales Price by Month
Rental Income by Month
✅ Backend Data & Support Sheets
Structured Data Sheet
Support Sheet for seamless calculations
Pivot-ready architecture
🛠️ How to Use the Real Estate Valuation Dashboard in Excel
1️⃣ Enter or paste property data into the Data Sheet
2️⃣ Refresh pivot tables (if required)
3️⃣ Use slicers to filter by region, segment, furnishing, or time
4️⃣ Instantly analyze valuation, pricing, and rental trends
5️⃣ Use insights for pricing, investment, and client discussions
No advanced Excel knowledge required ✅
👥 Who Can Benefit from This Dashboard
🏢 Real Estate Agents & Brokers
📊 Property Valuation Analysts
💰 Real Estate Investors
🏗️ Property Developers
🏘️ Leasing & Rental Managers
📈 Asset & Portfolio Managers
📑 Real Estate Consulting Firms
If you deal with property valuation or pricing decisions, this dashboard is made for you.
🚀 Why This Dashboard Creates Real Value
✅ Eliminates manual calculations
✅ Improves pricing and valuation accuracy
✅ Saves hours of reporting time
✅ Enhances investment decisions
✅ Enables professional client presentations
✅ Works fully inside Excel
✅ Easy to customize and scale
This dashboard helps you move from guesswork to data-driven real estate strategy.
📘 Click here to read the Detailed blog post
🎥 Visit our YouTube channel to learn step-by-step video tutorials
👉 https://youtube.com/@PKAnExcelExpert