The startup ecosystem moves fast, and every decision matters. Founders, investors, and analysts need clear, reliable, and real-time insights to take the right actions 🚀. But when data is scattered in multiple sheets, outdated files, or complex tools, decision-making slows down and growth becomes harder. That’s exactly why the Aristech Startups Dashboard in Excel is the perfect solution.
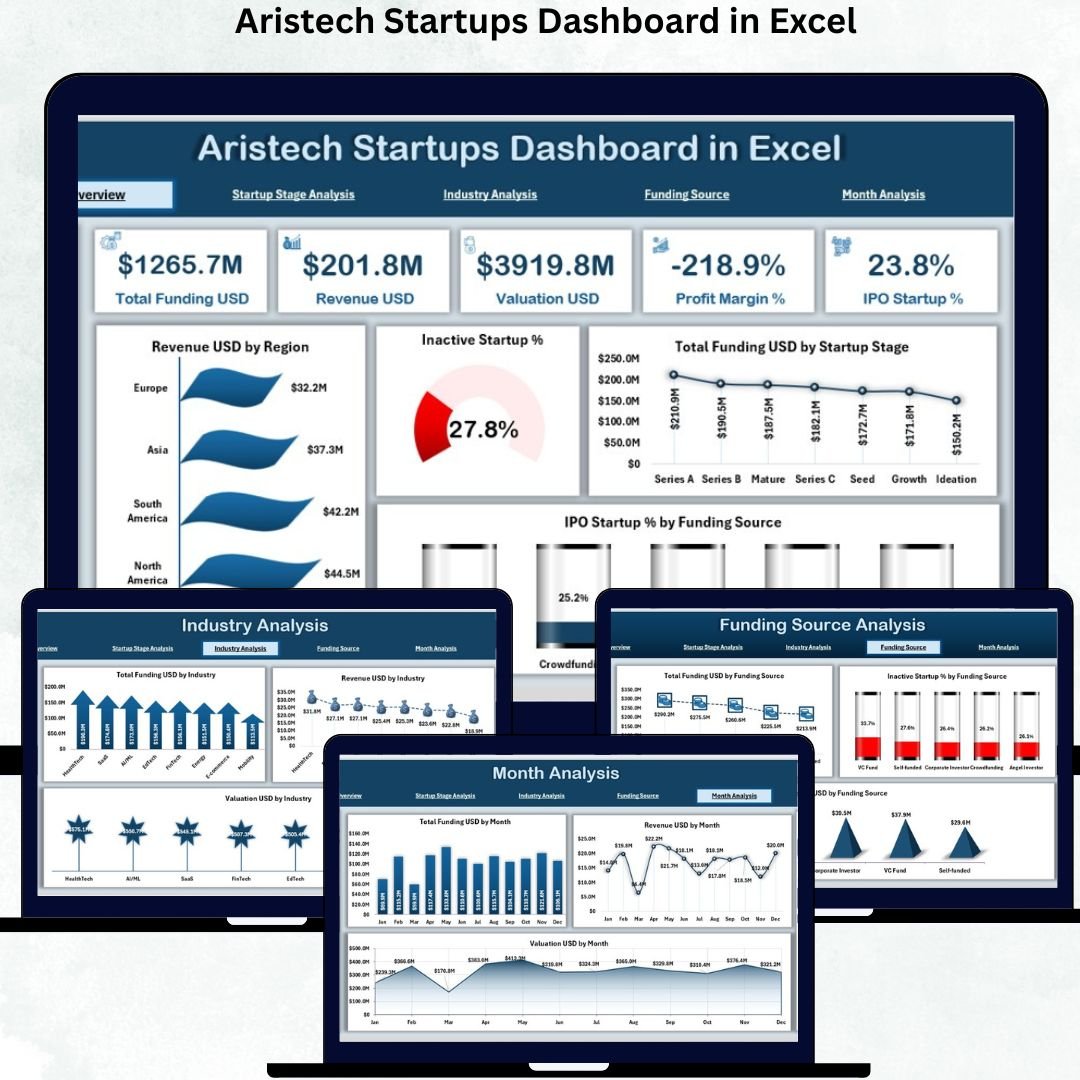
This ready-to-use Excel dashboard brings funding, revenue, valuation, startup stages, industry performance, and regional insights into one clean, interactive view. Built with powerful charts, slicers, filters, and auto-updating visuals, it helps you understand your startup ecosystem instantly—without advanced technical skills. Whether you’re presenting to investors, analyzing trends, or planning strategies, this dashboard gives you clarity and confidence.
🔥 Key Features of the Aristech Startups Dashboard in Excel
-
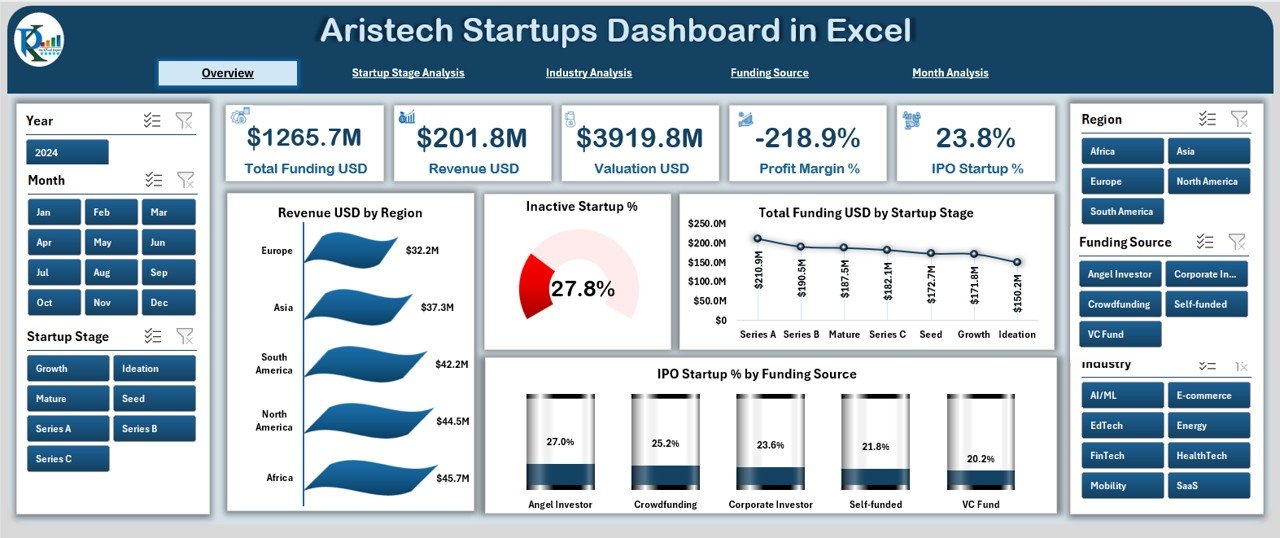
📊 Overview Page – See all major KPIs like revenue, funding, IPO %, inactive startup %, and valuation patterns in one place.
-
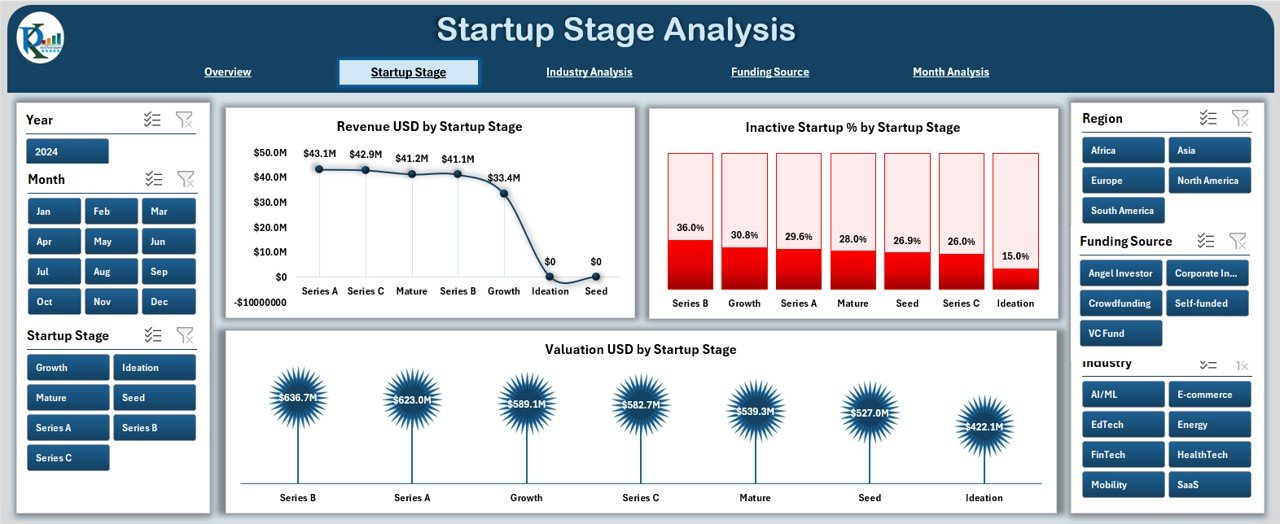
🚀 Startup Stage Analysis – Track how revenue, valuation, and failure rates change from Seed to IPO stages.
-
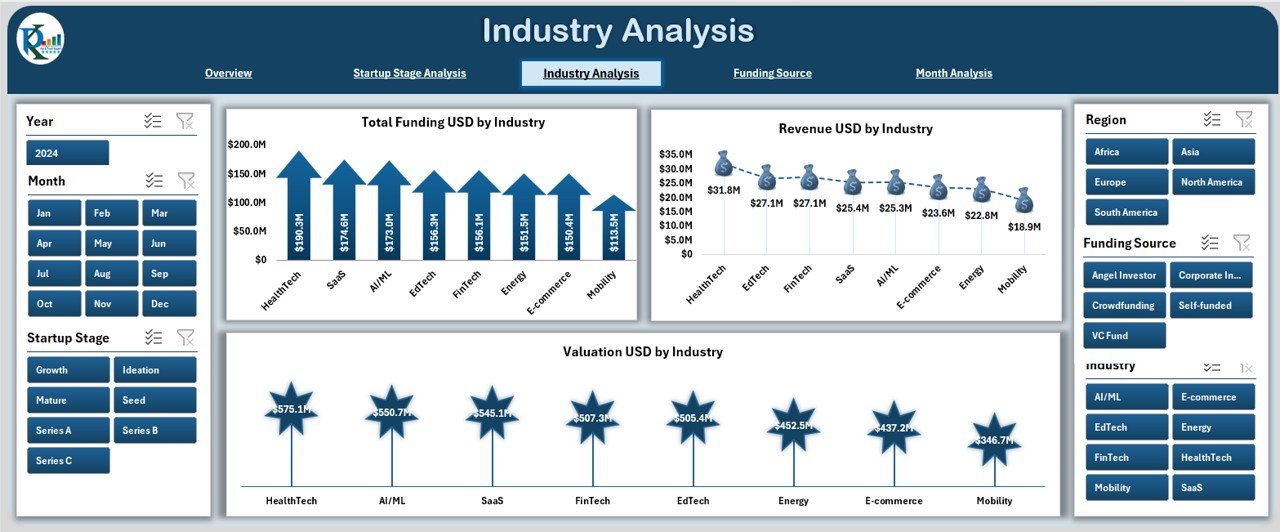
🏭 Industry Analysis – Compare industries such as technology, e-commerce, healthcare, fintech, logistics, etc.
-
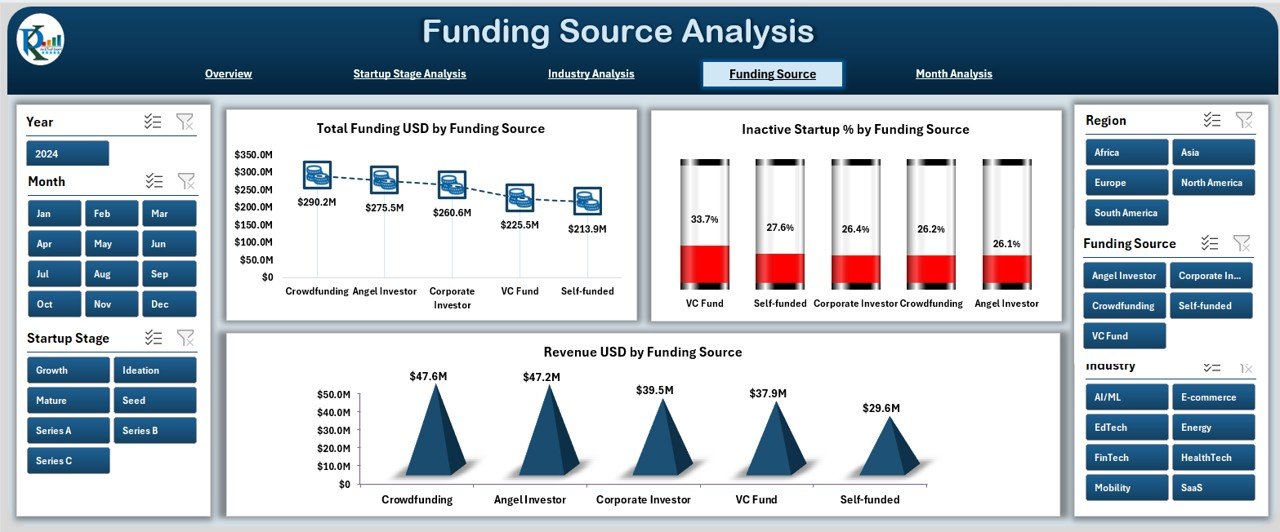
💰 Funding Source Analysis – Understand how VCs, angel investors, grants, crowdfunding, and other funding sources affect performance.
-
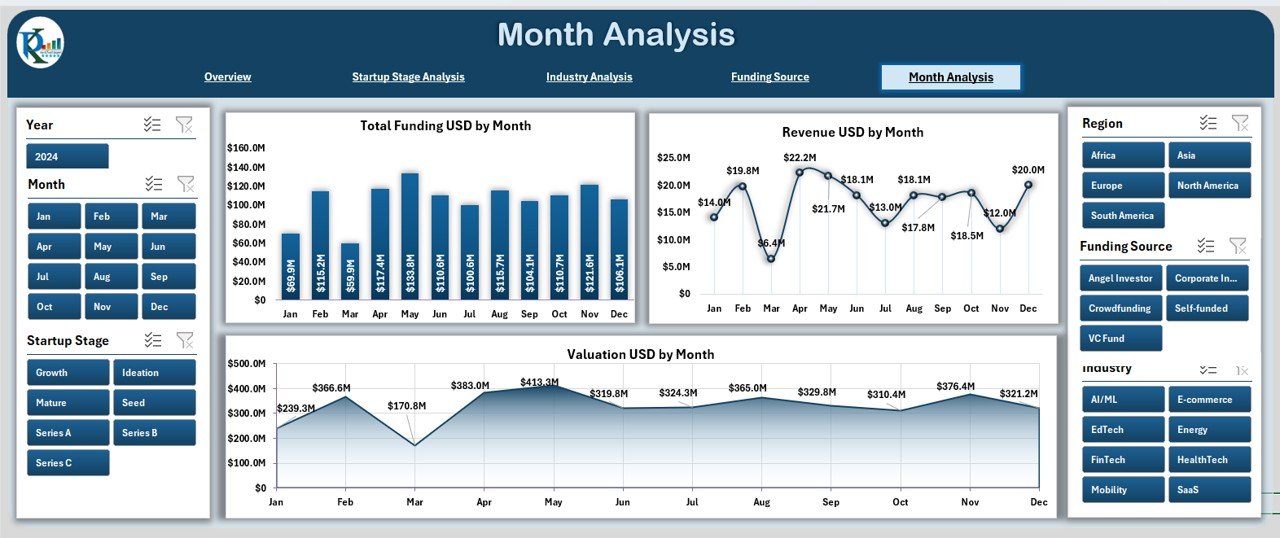
📅 Month Analysis – View month-wise revenue, funding, valuation, and seasonal growth patterns.
-
⚡ Fully Interactive – Slicers, filters, and dynamic charts that respond instantly to user selections.
-
💡 Investor-Friendly – Clean visuals perfect for pitch decks, funding meetings, and strategy presentations.
📂 What’s Inside the Aristech Startups Dashboard
-
Overview Page: High-level performance view with KPI cards and 4 powerful charts covering revenue, funding, IPO %, and inactive startup % by region and stage.
-
Startup Stage Analysis Page: Compare performance across Seed, Early Stage, Growth Stage, Expansion, and IPO using revenue, valuation, and failure rate charts.
-
Industry Analysis Page: Get industry-level insights using funding, valuation, and revenue charts across different sectors.
-
Funding Source Analysis Page: Understand which funding sources drive growth, shape revenue, and carry risks.
-
Month Analysis Page: Track monthly funding, revenue, and valuation patterns to plan budgets and forecast performance.
🛠️ How to Use the Aristech Startups Dashboard
-
Update your data sheet 💻 – Add or modify startup data such as funding, valuation, stage, and industry.
-
Refresh the dashboard 🔄 – All visuals update automatically.
-
Use slicers & filters 🎯 – Compare categories, regions, stages, and industries instantly.
-
Explore each page 🔍 – Each view gives a new layer of insight for analysis or presentations.
-
Use insights to act fast ⚡ – Identify risks, track growth, plan strategies, and present confidently.
🎯 Who Can Benefit from This Dashboard
-
Startup founders & co-founders
-
Angel investors & venture capital firms
-
Business consultants
-
Startup incubators & accelerators
-
University researchers & students
-
Financial analysts & startup advisory teams
This dashboard empowers decision-makers to understand performance patterns, reduce risks, plan growth strategies, and communicate insights effectively.
### Click here to read the Detailed blog post
Visit our YouTube channel to learn step-by-step video tutorials


Reviews
There are no reviews yet.