The Absenteeism Report in Excel is designed to provide businesses with an efficient and comprehensive solution for tracking and managing employee attendance. This tool offers key features that enhance both the usability and depth of the report, allowing for the easy analysis and management of employee absenteeism.
Key Features
-
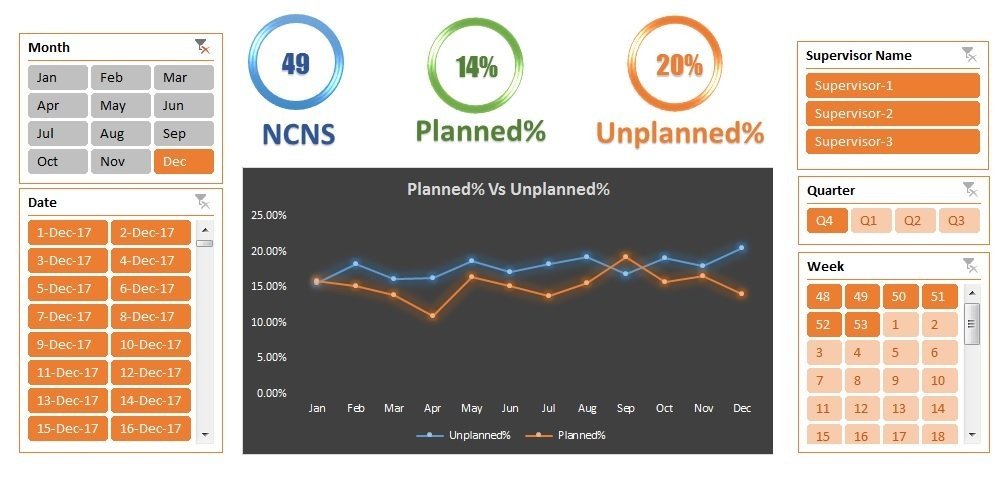
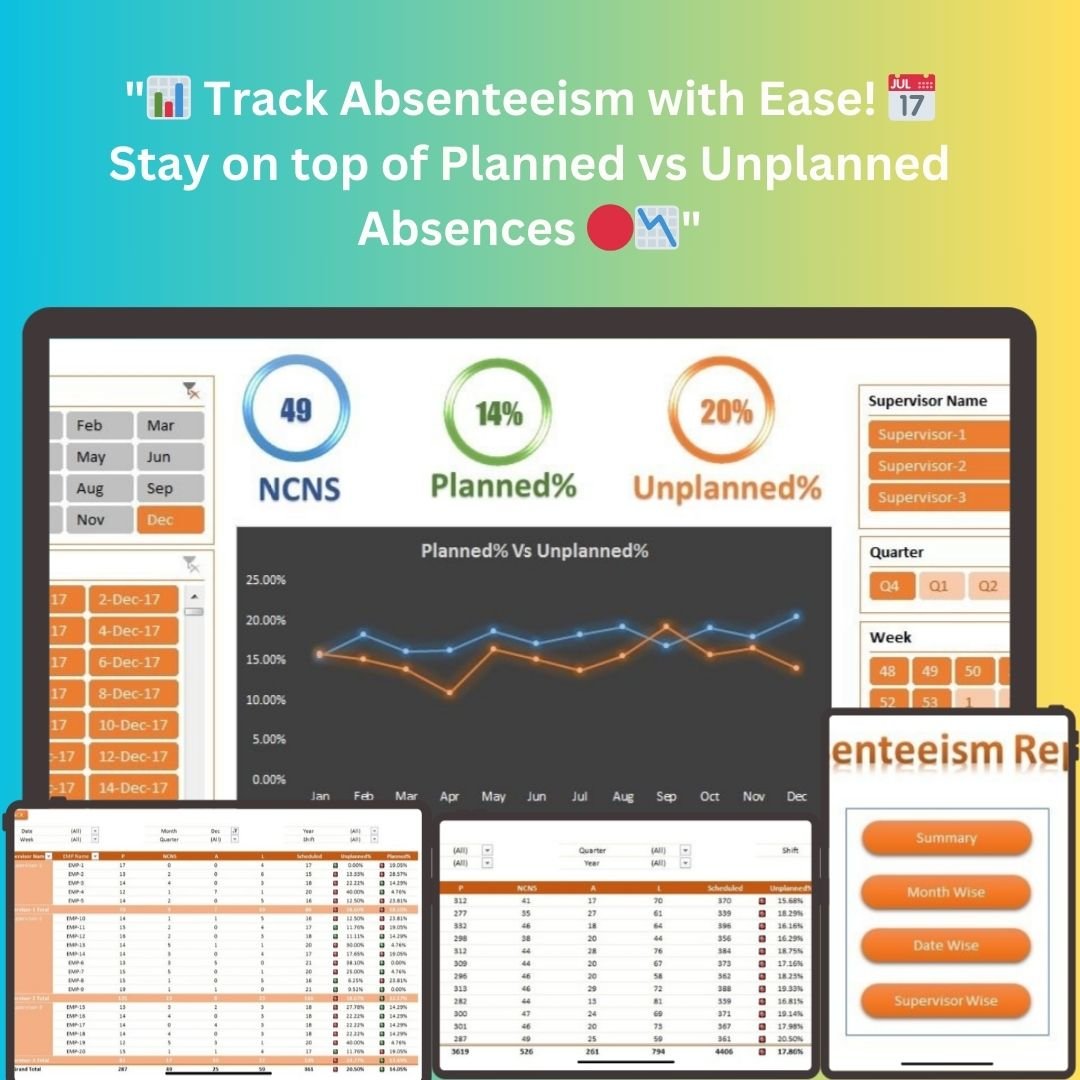
Interactive Index: The report includes an Index sheet that enables users to quickly navigate through different sections, including summaries, monthly reports, weekly data, and supervisor-specific insights. This user-friendly structure allows for streamlined data retrieval without the need to manually sift through large datasets.
-
Monthly Comparison Dashboard: The report provides a comparison of planned vs. unplanned absences, complemented by real-time tracking of No Call No Show (NCNS) data. This allows businesses to quickly assess absenteeism patterns and plan accordingly for staffing requirements.
-
Dynamic Slicers for Data Filtering: Dynamic slicers are incorporated into the report, allowing for customized data views. Users can filter reports by Month, Date, Supervisor, Quarter, and Week. This flexibility ensures that users can tailor the data presented to suit specific needs or business conditions.
-
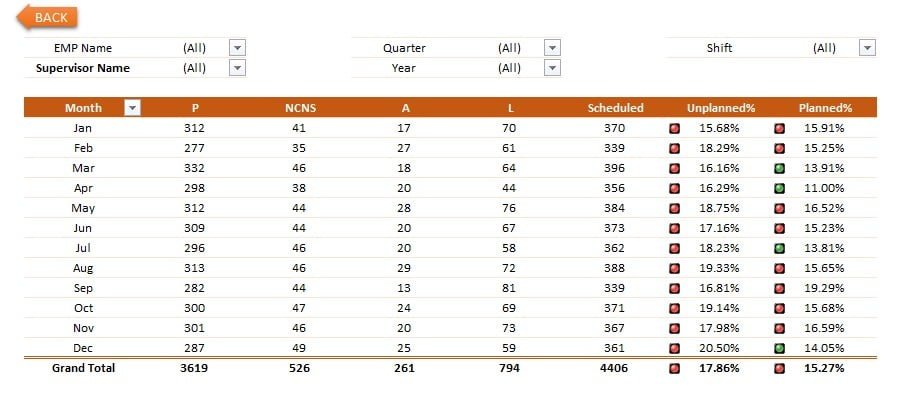
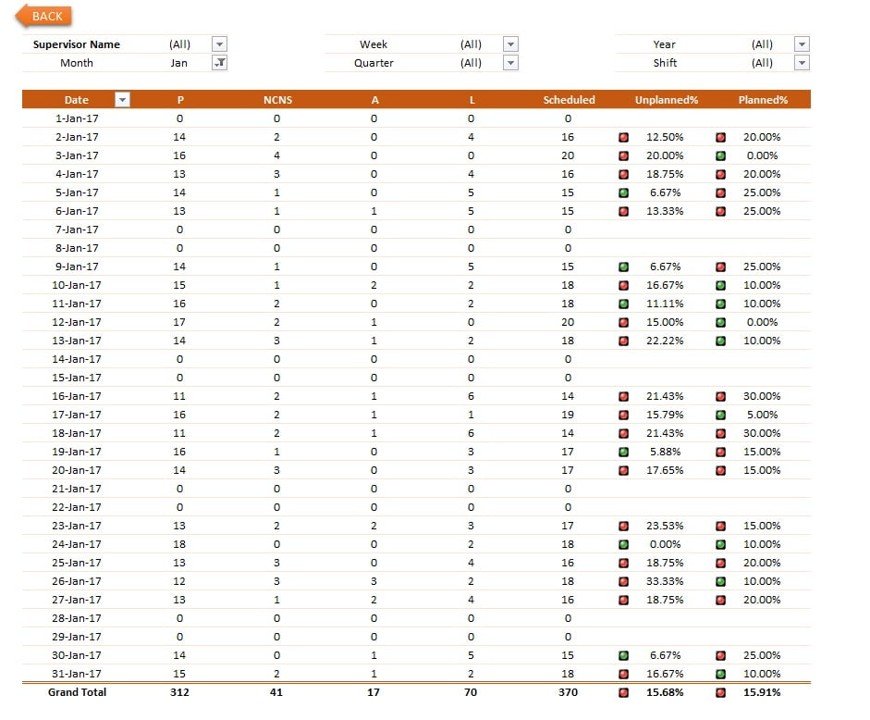
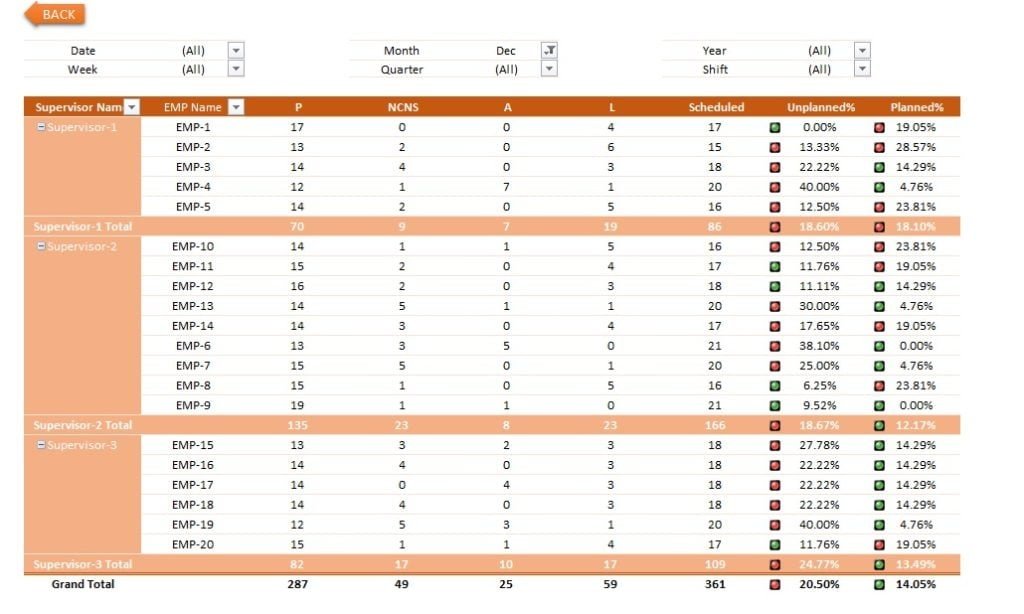
Traffic Light Indicators: Conditional formatting within the report includes traffic light indicators, which visually highlight absences based on planned and unplanned categories. These indicators use a color-coding system to compare absence percentages against pre-defined target thresholds, such as 12% for unplanned absences and 15% for planned absences. This visual cue provides immediate insight into how attendance is tracking against company benchmarks.
-
Detailed Data Views: The report features detailed attendance metrics organized by Month, Week, and Supervisor. This level of granularity ensures that decision-makers can assess absenteeism at both the individual and departmental levels. Pivot tables are used to display key metrics such as Present, Absent, and Leave counts, offering comprehensive insights into employee attendance.
-
Raw Data Management: A structured data sheet is included, which facilitates easy input and automatic calculation of fields. This feature streamlines the process of updating and maintaining the absenteeism data, ensuring that the report remains accurate and up-to-date. Automated calculations reduce manual errors and enhance data integrity.
Usage and Application
The Absenteeism Report in Excel serves as an essential tool for businesses aiming to manage and analyze employee attendance effectively. By using this tool, companies can ensure that they maintain an accurate overview of employee absenteeism, allowing for better resource planning and the identification of trends or patterns that may require attention. This tool is particularly beneficial for HR teams, operational managers, and senior leadership who need to monitor and manage employee attendance data to improve overall organizational performance.
With its powerful features and user-friendly design, the Absenteeism Report in Excel not only enhances operational efficiency but also enables more informed decision-making regarding workforce management.
Click here to read the detailed blog post
Visit our YouTube channel to learn step-by-step video tutorials
Watch the step-by-step video tutorial:
Also check our Download Attachments from Multiple Emails Automatically using VBA














Reviews
There are no reviews yet.