

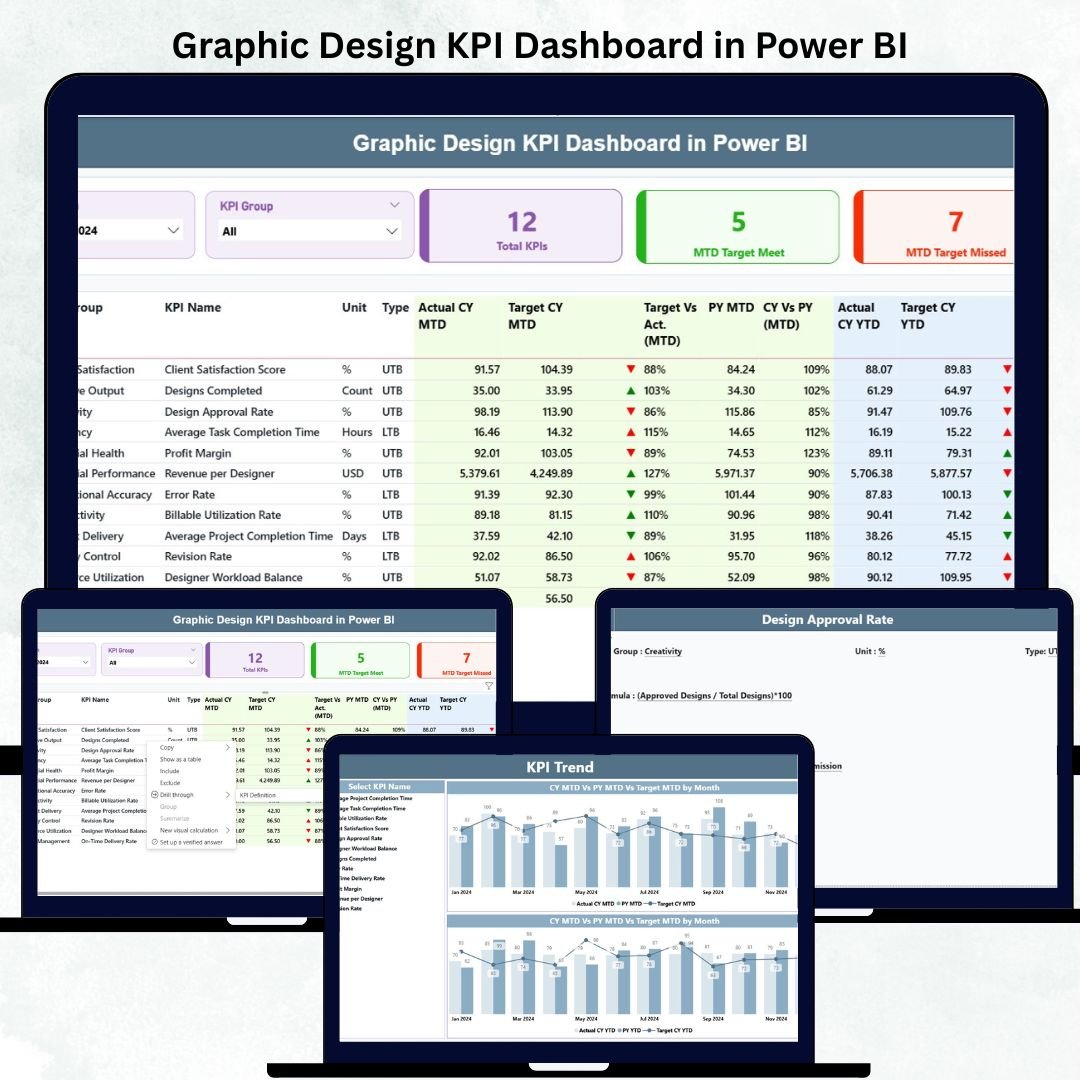
Managing a graphic design team is not easy. Designers work on branding, social media creatives, UI/UX, product packaging, advertising assets, and countless visual tasks every single month. While creativity is the priority, managers must also track deadlines, quality, workload, project progress, and ROI. Doing all this manually becomes overwhelming, confusing, and time-consuming.
This Graphic Design KPI Dashboard in Power BI is the perfect solution for design studios, in-house creative teams, agencies, and freelancers who want complete clarity, real-time insights, and effortless reporting. It transforms raw design performance data into meaningful visuals—helping teams deliver faster, improve quality, and stay fully aligned with targets.
This dashboard brings speed, transparency, and efficiency to the entire creative workflow, allowing managers to focus on decision-making and designers to focus on what they do best—creating amazing designs.Graphic Design KPI Dashboard in Power BI
✨ Key Features of the Graphic Design KPI Dashboard in Power BI
This dashboard includes three powerful pages designed to give you complete control and visibility over your design operations.
🔹 Summary Page – Your Main Performance Control Center
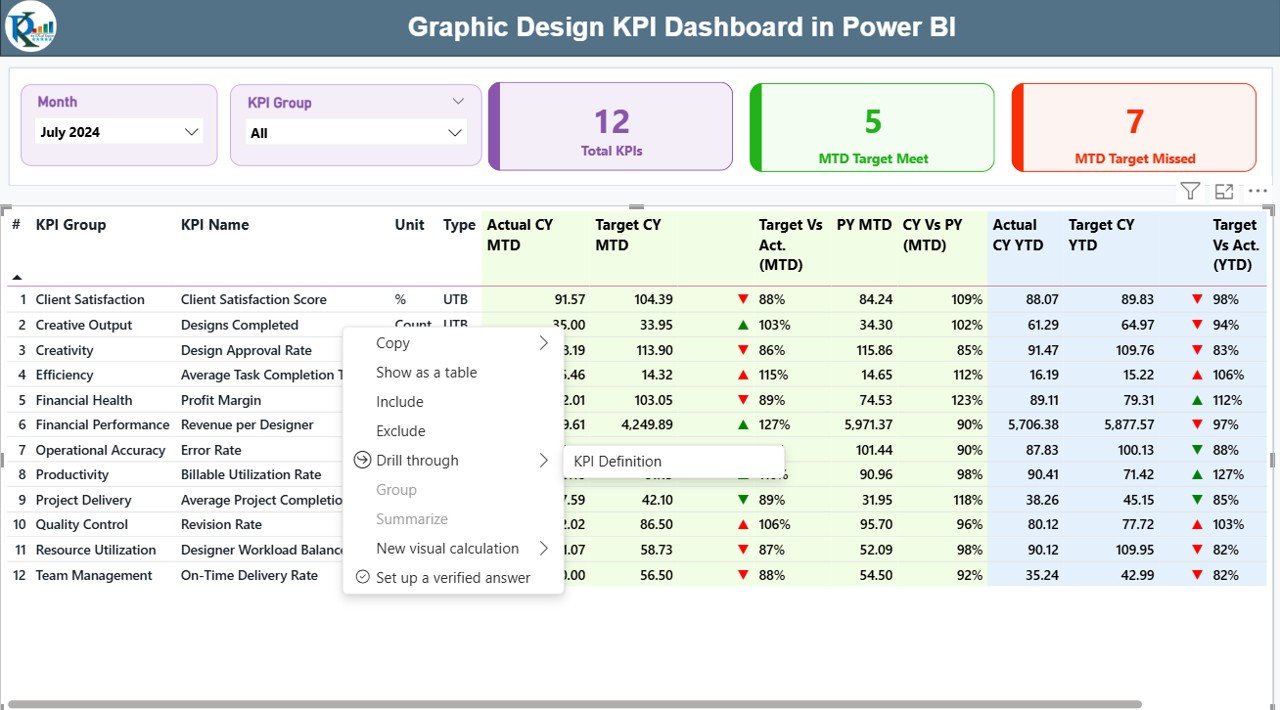
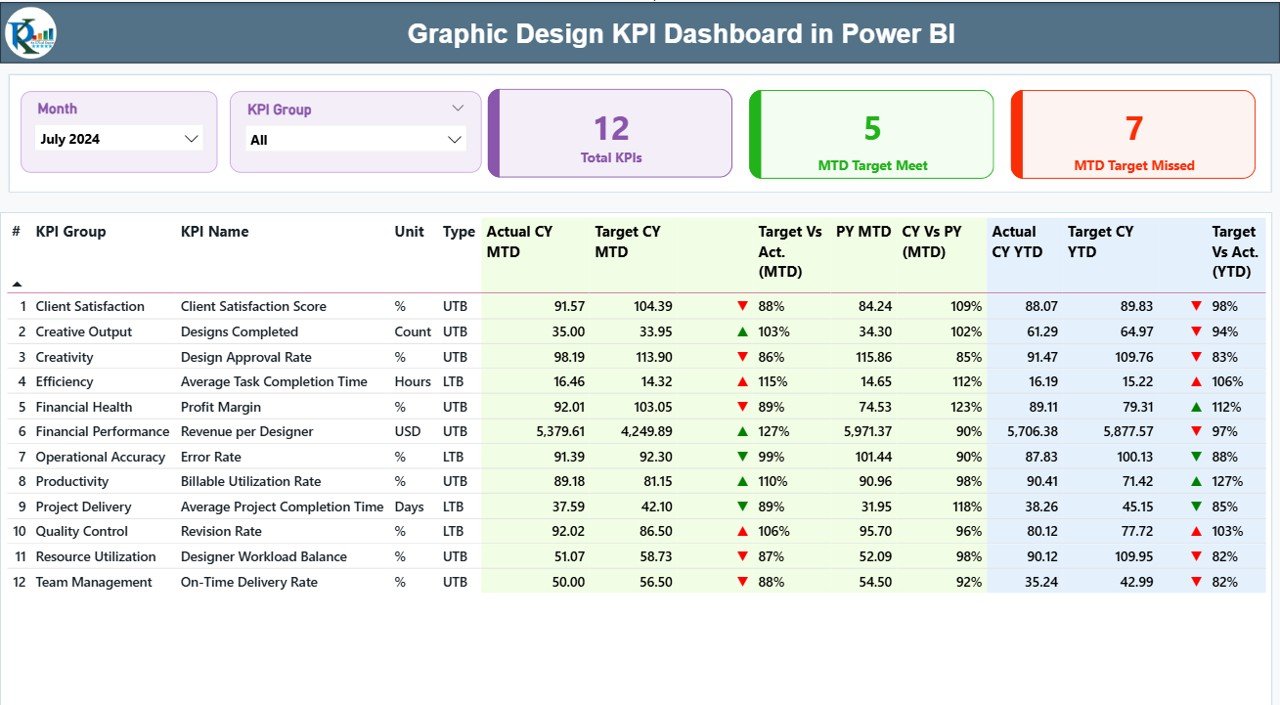
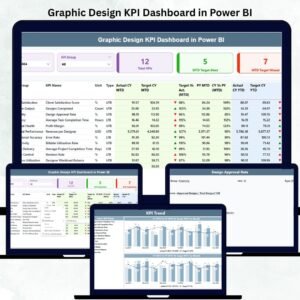
The Summary Page brings all KPI insights to one place. You can select any month using the Month Slicer, filter KPIs using the KPI Group Slicer, and instantly view the Total KPIs Count, MTD Target Met, and MTD Target Missed.
It also includes a detailed KPI table showing:
KPI Number
KPI Group
KPI Name
Unit
Type (UTB/LTB)
CY MTD Actual
CY MTD Target
Target vs Actual %
Previous Year Comparison
YTD Values and Trend Icons
This single page helps identify delays, performance gaps, and improvement areas instantly.
🔹 KPI Trend Page – Monitor MTD & YTD Movement Over Time
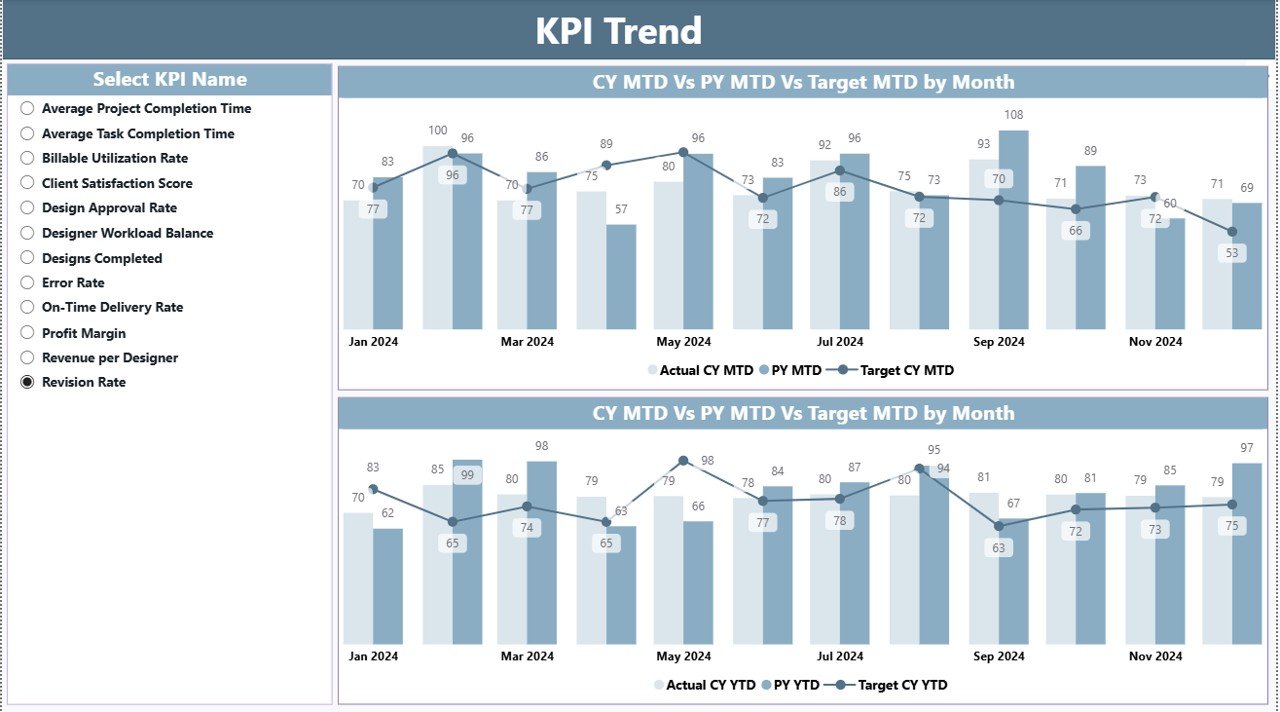
This page allows you to select any KPI and analyze its performance trend using interactive combo charts. It shows:
Current Year Actual
Target
Previous Year Actual
It helps identify growth patterns, seasonal performance, workload shifts, and consistency of output.
🔹 KPI Definition Page – Complete Transparency
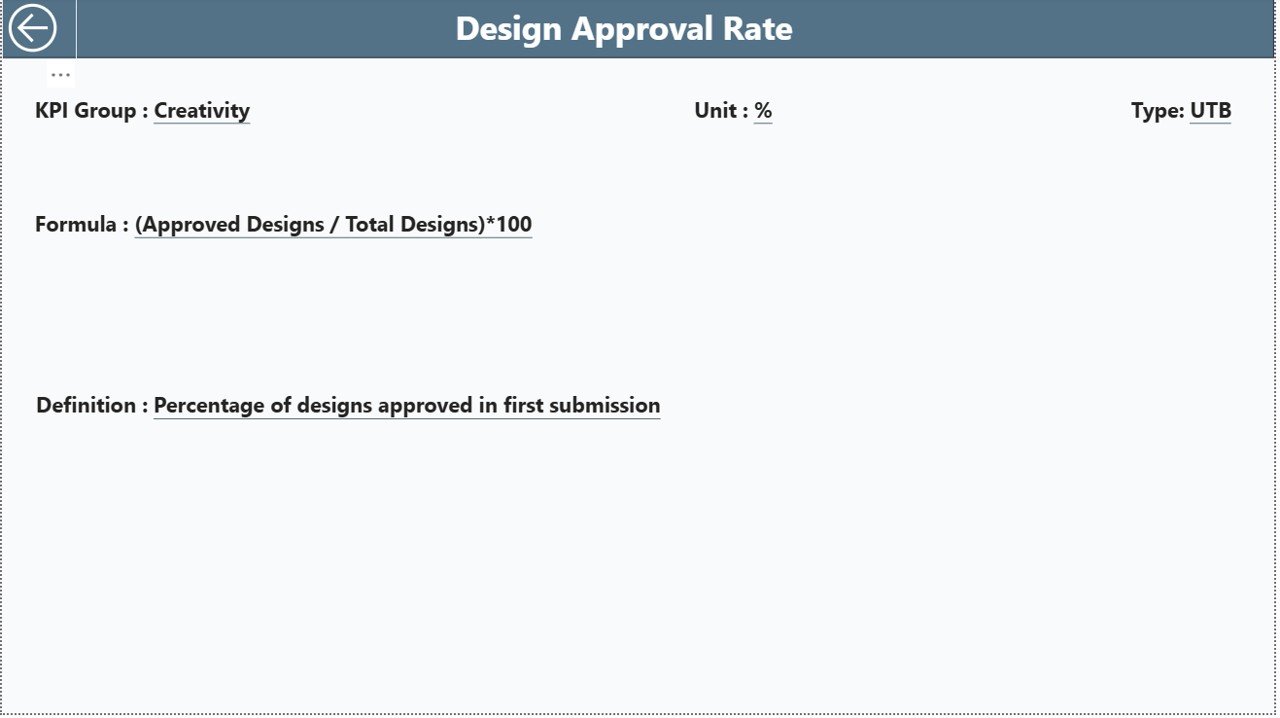
This drill-through page displays:
KPI Number
KPI Group
KPI Name
Unit
Formula
Definition
Type
Everyone on the team understands how performance is measured, ensuring 100% alignment.
📦 What’s Inside the Graphic Design KPI Dashboard
When you download this template, you’ll receive:Graphic Design KPI Dashboard in Power BI
Power BI Dashboard (.pbix file)
Excel Data Source File (Input_Actual, Input_Target, KPI Definitions)
Structured KPI Definition List
Clear KPI Groups (Productivity, Quality, Delivery, Financials, Client Satisfaction, Team Performance)
Automatic Trend Insights (MTD & YTD)
Instant Month & KPI Group Filtering
Graphic Design KPI Dashboard in Power BI
🛠 How to Use the Graphic Design KPI Dashboard
Using this dashboard is extremely simple:
Open the Excel Backend File
Update your monthly actuals and targets
Enter KPI names, units, formulas, and definitions
Refresh the Power BI File
Power BI automatically updates all visuals
Use Slicers for Quick Analysis
Select Month → Get instant updated numbers
Select KPI Group → View focused insights
Analyze Trends & Patterns
Use MTD/YTD charts to understand long-term growth
Drill Through for Definitions
Click any KPI → View its definition, formula, and type
No technical knowledge is required. Just update the Excel file and enjoy instant insights.
👥 Who Can Benefit from This Graphic Design KPI Dashboard
This dashboard is perfect for:Graphic Design KPI Dashboard in Power BI
🎨 Design Studios
Track project load, delivery timelines, quality control, and profitability.
🏢 Corporate In-House Design Teams
Monitor brand consistency, turnaround time, and performance improvement.
🧑💻 Freelance Designers
Track revisions, client satisfaction, efficiency, and delivery accuracy.
📈 Marketing & Creative Agencies
Measure team output, budget utilization, and client happiness across projects.
👨🏫 Design Managers & Team Leads
Make faster decisions, assign workload fairly, and track performance trends.
Anyone who manages creative work can use this dashboard to improve productivity, reduce revisions, and enhance client satisfaction.






















Reviews
There are no reviews yet.